. 2019 Apr 4;74(1):185-195.e4.
doi: 10.1016/j.molcel.2019.01.014. Epub 2019 Feb 20.

Continued Activity of the Pioneer Factor Zelda Is Required to Drive Zygotic Genome Activation

Affiliations

Continued Activity of the Pioneer Factor Zelda Is Required to Drive Zygotic Genome Activation

Stephen L McDaniel et al. Mol Cell. .

Abstract

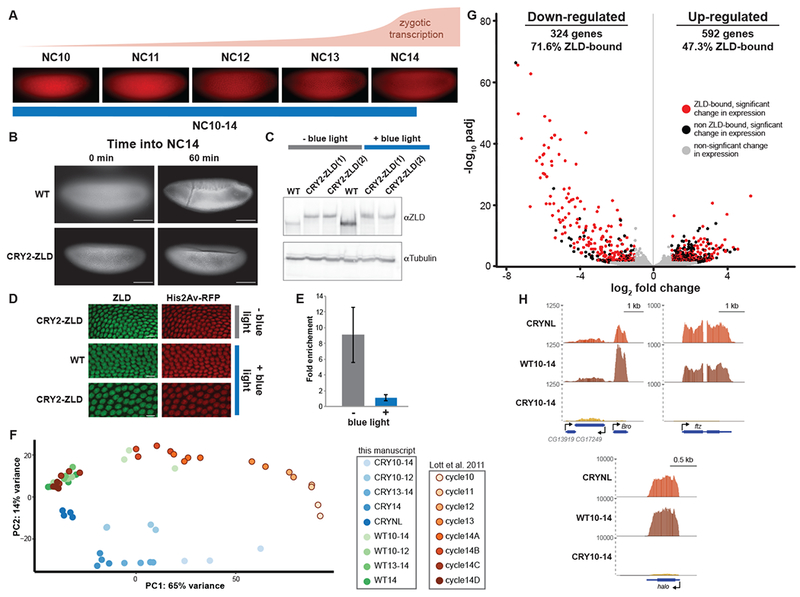
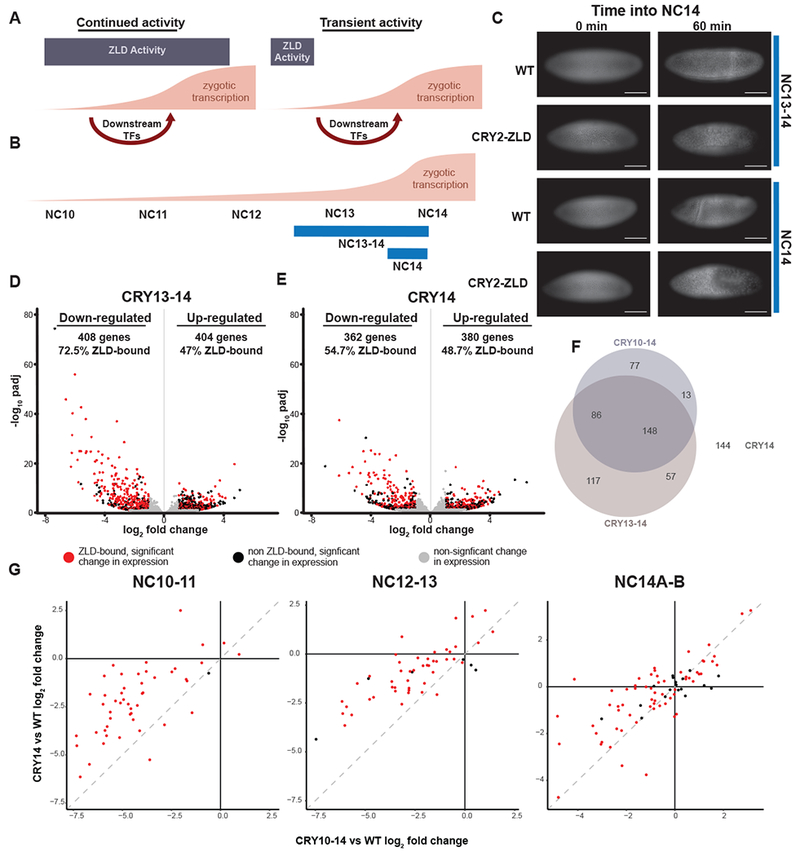
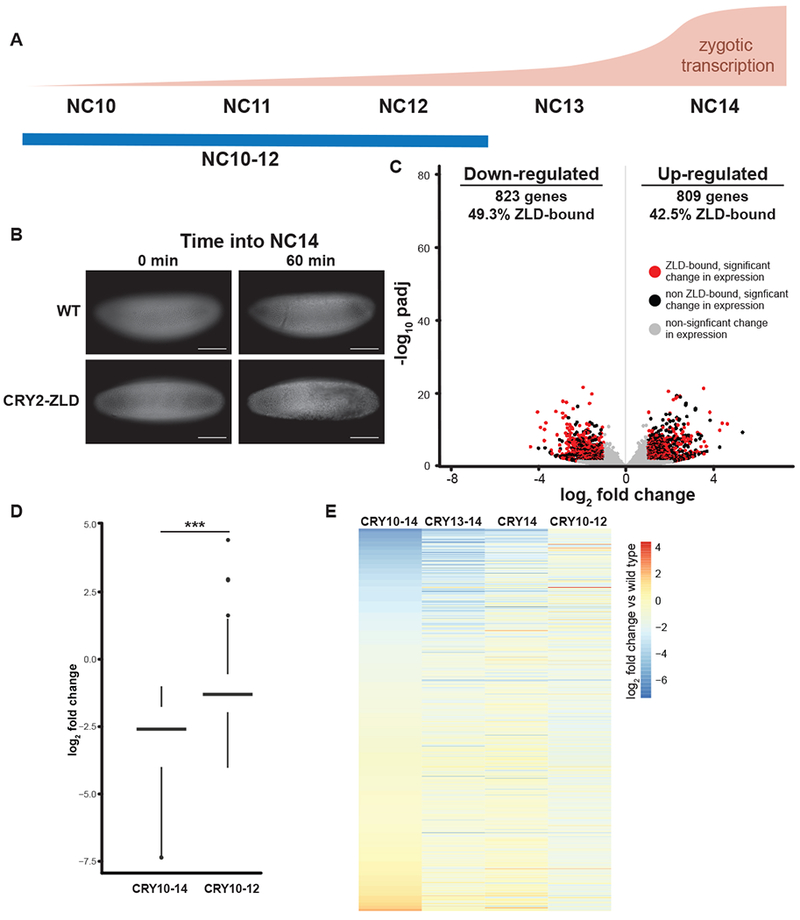
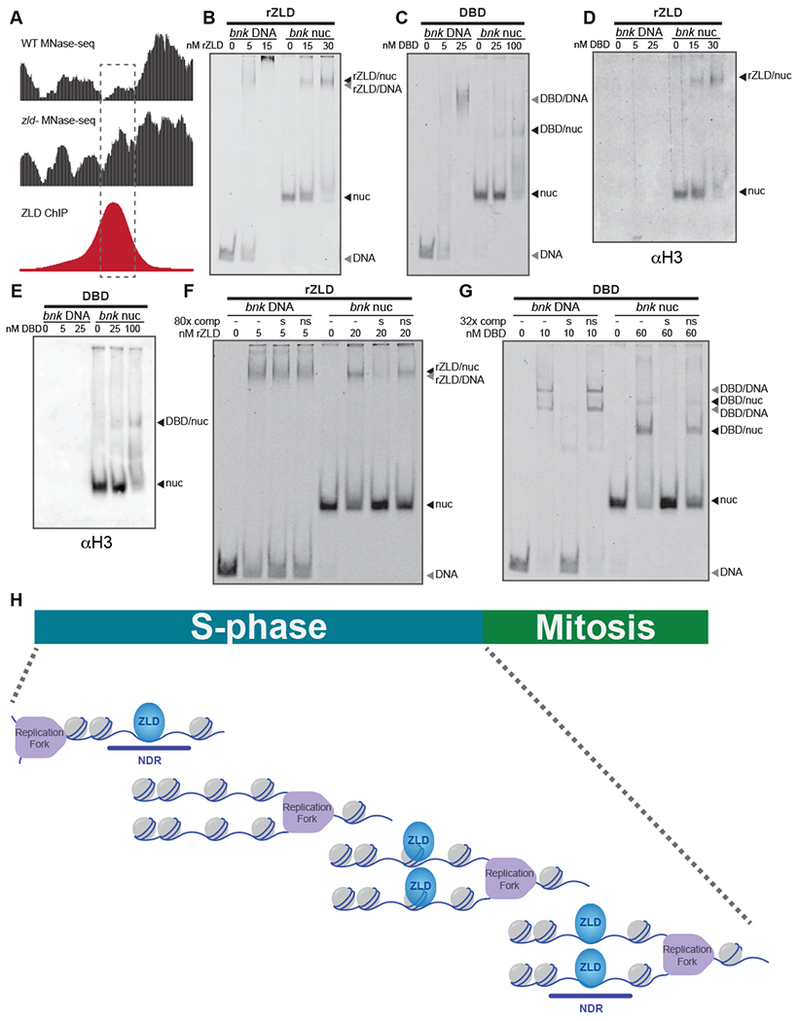
Reprogramming cell fate during the first stages of embryogenesis requires that transcriptional activators gain access to the genome and remodel the zygotic transcriptome. Nonetheless, it is not clear whether the continued activity of these pioneering factors is required throughout zygotic genome activation or whether they are only required early to establish cis-regulatory regions. To address this question, we developed an optogenetic strategy to rapidly and reversibly inactivate the master regulator of genome activation in Drosophila, Zelda. Using this strategy, we demonstrate that continued Zelda activity is required throughout genome activation. We show that Zelda binds DNA in the context of nucleosomes and suggest that this allows Zelda to occupy the genome despite the rapid division cycles in the early embryo. These data identify a powerful strategy to inactivate transcription factor function during development and suggest that reprogramming in the embryo may require specific, continuous pioneering functions to activate the genome.

Keywords: Drosophila; MZT; ZGA; Zelda; maternal-to-zygotic transition; optogenetic; pioneer factor; transcription; zygotic genome activation.


Conflict of interest statement

Declaration of Interests

The authors declare no competing interests.

Figures

Figure 1:
Figure 1:
Rapid inactivation of ZLD using optogenetic manipulation. (A) Representative images of His2AvRFP expressing embryos in the identified nuclear cycles (NC) with approximate timing and levels of ZGA shown above. Blue line below indicates timing of blue-light exposure for embryos harvested for RNA-seq analyzed in G and H. (B) His2Av-RFP images of embryos exposed to blue light starting at NC10. Both wild-type (WT) embryos and CRY2-tagged ZLD (CRY2-ZLD) were imaged at the initiation of NC14 (0 min) or near the completion of NC14 (60 min). Scale bar is 100 μm. (C) Immunoblot for ZLD on embryos 2-3 hour after egg laying both with (+) and without (−) blue-light exposure. Two different lines of CRY2-tagged ZLD expressing embryos are included. (D) Immunostaining for ZLD (green) and His2Av-RFP (red) on embryos harvested 2-3 hour after egg laying expressing His2AvRFP alone (WT) or CRY2-ZLD with and without exposure to blue light starting at egg laying. Scale bar is 10 μm. (E) ChIP-qPCR analysis of ZLD binding to the promoter of Sryα in the presence (+) and absence (−) of blue light. Fold enrichment is compared to a region of Act5C not bound by ZLD. Error bars show the standard deviation (n = 2). (F) Distribution of datasets based on principal components for all the single-embryo data generated in this manuscript as well as the staged embryos from Lott et al. 2011. (G) Volcano plot highlighting the hundreds of genes that were mis-regulated in CRY2-tagged ZLD expressing embryos upon blue-light exposure from NC10 through NC14. Red dots indicate genes with proximal ZLD ChIP-seq peaks that change in gene expression upon blue-light exposure. Black dots indicate additional genes that change in expression upon blue-light exposure (adjusted p-value < 0.05, fold change > 2). Gray dots indicate genes that do not significantly change expression upon blue-light exposure. (see also Figure S1 and Table S1) (H) Genome browser tracks of RNA-seq data from wild-type (WT10-14) or CRY2-tagged ZLD (CRY10-14) embryos exposed to blue light for nuclear cycles 10-14 or CRY2-tagged ZLD mbryos without blue-light exposure (CRYNL). Tracks are shown for three previously identified, ZLD-responsive genes, Bro, ftz, and halo.
Figure 2:
Figure 2:
Continued ZLD activity is required to drive the major wave of ZGA. (A) Models depicting the possible requirements for ZLD during ZGA. On the left, ZLD is required through ZGA to potentiate transcription-factor binding and gene expression. On the right, ZLD is only required early, during the minor wave of ZGA. Downstream transcription factors then drive the major wave of ZGA. (B) The approximate timing and levels of ZGA are shown with blue lines below indicating the timing of blue-light exposure for embryos harvested for RNA-seq analyzed in D and E. (C) His2Av-RFP images of embryos exposed to blue light starting at NC13 or NC14 as indicated. Both wild-type (WT) embryos and CRY2-tagged ZLD (CRY2-ZLD) were imaged at the initiation of NC14 (0 min) or near the completion of NC14 (60 min). Scale bar is 100 μm. (D-E) Volcano plots highlighting the hundreds of genes that were mis-regulated in CRY2-tagged ZLD expressing embryos upon blue-light exposure from NC13 through NC14 (see also Table S2) (D) or from the beginning of NC14 (see also Table S2) (E). Red dots indicate genes with proximal ZLD ChIP-seq peaks that change in gene expression upon blue-light exposure. Black dots indicate additional genes that change in expression upon blue-light exposure (adjusted p-value < 0.05, fold change > 2). Gray dots indicate genes that do not significantly change expression upon blue-light exposure. (F) Venn diagram of the overlap amongst down-regulated genes in CRY2-ZLD embryos exposed to blue light from NC10-14, from NC13-14, and NC14. (G) Log2 fold change of gene expression over wild type in CRY2-ZLD embryos exposed to blue light only during NC14 was plotted against log2 fold change for CRY2-ZLD embryos exposed to blue light throughout ZGA (NC10-14). Zygotically expressed genes were analyzed based upon the timing at which gene expression initiated (indicated above each plot: NC10-11, NC12-13, NC14A-14B). Dotted gray lines mark a one-to-one correlation between the changes in gene expression in both blue-light regimes.
Figure 3:
Figure 3:
ZLD activity restricted to nuclear cycles 13-14 is able to drive gene expression. (A) The approximate timing and levels of ZGA are shown with blue lines below indicating the timing of blue-light exposure for embryos harvested for RNA-seq analyzed in C. (B) His2Av-RFP images of embryos exposed to blue light starting from NC10 though NC12. Both wild-type (WT) embryos and CRY2-tagged ZLD (CRY2-ZLD) were imaged at the initiation of NC14 (0 min) or near the completion of NC14 (60 min). Scale bar is 100 μm. (C) Volcano plot highlighting the hundreds of genes that were mis-regulated in CRY2-tagged ZLD expressing embryos upon blue-light exposure from NC10 through NC12. Red dots indicate genes with proximal ZLD ChlP-seq peaks that change in gene expression upon blue-light exposure. Black dots indicate additional genes that change in expression upon blue-light exposure (adjusted p-value < 0.05, fold change > 2). Gray dots indicate genes that do not significantly change expression upon blue-light exposure. (see also Table S3) (D) Box plot of the log2 fold change in gene expression upon blue-light exposure either from NC10-14 (CRY10-14) or NC10-12 (CRY10-12) for the set of ZLD-bound genes that are down-regulated in CRY2-tagged ZLD expressing embryos. ***, p = 7.64 × 10⁻³³ (two-sided Wilcoxian rank sum test) (E) Heat map of all the genes that significantly changed in gene expression upon blue-light exposure in any of the four conditions used in this study (indicated above). Genes are ordered based on the levels of change in embryos exposed to blue light from NC10-14.
Figure 4:
Figure 4:
ZLD binds nucleosomal DNA with sequence specificity. (see also Figures S2, S3, and S4) (A) Genome browser tracks for a region of the bnk locus used to reconstitute nucleosomes. MNase-seq from wild-type embryos (WT) or embryos depleted for maternal zld (zld−) (Sun et al., 2015) and ZLD ChIP-seq (Harrison et al., 2011) are shown. Dashed rectangle highlights the region used to reconstitute nucleosomes. (B) Representative EMSA showing the affinity of increasing amounts of recombinant full-length ZLD (rZLD) to Cy5-labeled bnk DNA or bnk nucleosomes. (C) EMSA with increasing amounts of recombinant ZLD DNA-binding domain (DBD) to Cy5-labeled bnk DNA or bnk nucleosomes. (D-E) Protein from the EMSAs shown in (B) or (C) transferred to PVDF and blotted for histone H3. (F) EMSA demonstrating the specificity of binding of full-length ZLD (rZLD) to bnk DNA and bnk nucleosomes. Reactions included either no double-stranded oligonucleotide competitor (−), unlabeled, specific, double-stranded oligonucleotide competitor containing a canonical ZLD-binding motif (s), or unlabeled, non-specific, double-stranded oligonucleotide competitor containing a mutated ZLD-binding motif (ns). (G) EMSAs demonstrating the specificity of binding of the ZLD DNA-binding domain (DBD) to bnk DNA and bnk nucleosomes. Reactions were incubated with competitor as in (F). In all reactions, labelled probes were at a concentration of 2.5 nM. (H) Model of ZLD binding to nucleosomes following the replication fork to mediate rapid re-establishment of accessible, nucleosome-depleted regions (NDR) during the short (5-14 minute) S-phases of the early embryonic nuclear cycles (NC10-13). Because ZLD is largely absent from the mitotic chromosomes, rapid DNA binding by ZLD during S-phase is required to maintain chromatin occupancy.

Similar articles

Cited by

References

    1. Anderson KV, and Lengyel JA (1979). Rates of synthesis of major classes of RNA in Drosophila embryos. Dev Biol 70, 217–231. - PubMed
    1. Blythe SA, and Wieschaus EF (2015). Zygotic genome activation triggers the DNA replication checkpoint at the midblastula transition. Cell 160, 1169–1181. - PMC - PubMed
    1. Blythe SA, and Wieschaus EF (2016). Establishment and maintenance of heritable chromatin structure during early Drosophila embryogenesis. Elife 5. - PMC - PubMed
    1. Bolger AM, Lohse M, and Usadel B (2014). Trimmomatic: a flexible trimmer for Illumina sequence data. Bioinformatics 30, 2114–2120. - PMC - PubMed
    1. ten Bosch JR, Benavides JA, and Cline TW (2006). The TAGteam DNA motif controls the timing of Drosophila pre-blastoderm transcription. Development 133, 1967–1977. - PubMed

Publication types

MeSH terms