. 2019 Mar:41:286-298.
doi: 10.1016/j.ebiom.2018.12.049. Epub 2019 Feb 21.

MALAT1 sponges miR-106b-5p to promote the invasion and metastasis of colorectal cancer via SLAIN2 enhanced microtubules mobility

Affiliations

MALAT1 sponges miR-106b-5p to promote the invasion and metastasis of colorectal cancer via SLAIN2 enhanced microtubules mobility

Meng Zhuang et al. EBioMedicine. 2019 Mar.

Abstract

Background: The low expression of miR93/25 (members of miR-106b~25 cluster) promoted the invasion and metastasis of colon cancer cells, which predicted poor survival. However, the role of miR-106b-5p, the member of miR-106b~25 cluster, in colorectal cancer (CRC) remains unclear.

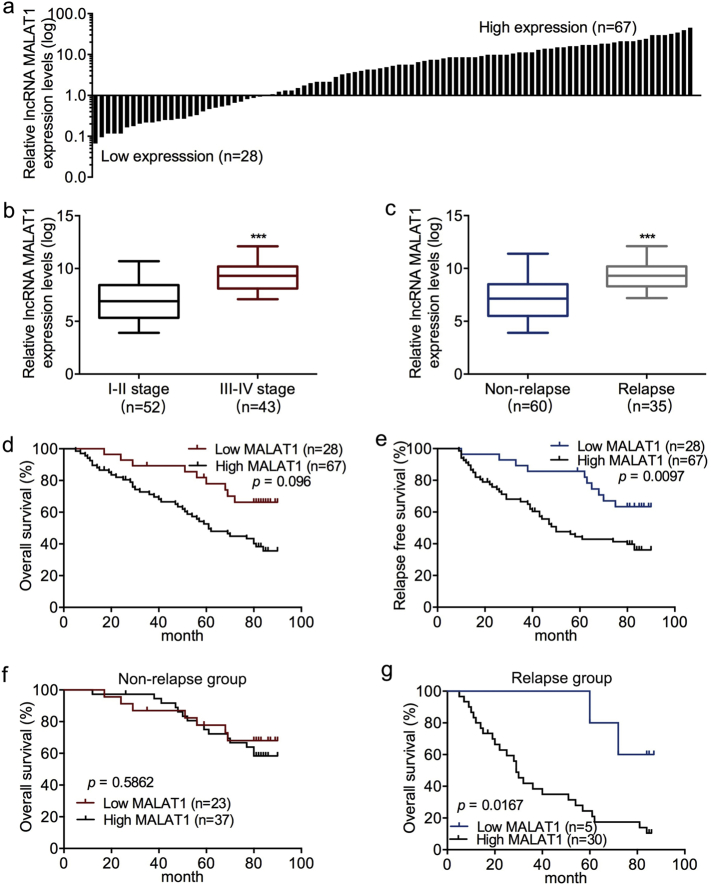
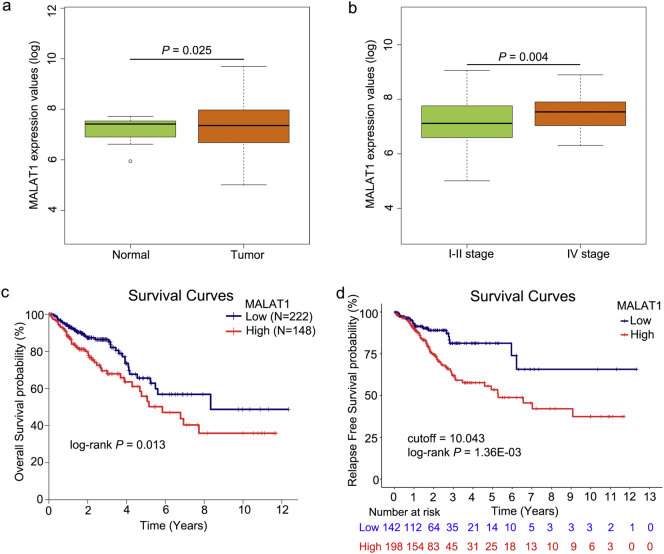
Methods: Bioinformatics methods were used to predict the potential pairs of lncRNA-miRNA-mRNA. In situ hybridization and qPCR were used to evaluate the expression of MALAT1 and miR-106b-5p in the paraffin-embedded normal and CRC tissues. Kaplan-Meier analysis with the log-rank test was used for survival analyses. Immunohistochemistry staining was applied to investigate the expression of SLAIN2. Fluorescence recovery after photobleaching assay was applied to observe the microtubule (MT) mobility. In vitro and in vivo invasion and metastasis assays were used to explore the function of MALAT1/miR-106b-5p/SLAIN2 in the progression of CRC.

Findings: miR-106b-5p was identified as a suppressor in CRC. Functionally, ectopic or silencing the expression of miR-106b-5p inhibited or promoted the invasion and metastasis of CRC cells in vitro and in vivo. The long non-coding RNA MALAT1 regulated the miR-106b-5p expression and further mediated the mobility of SLAIN2-related MTs by functioning as a competing endogenous RNA in vitro and in vivo, which resulted in the progression of CRC. Clinically, low miR-106b-5p expression predicted poor survival of CRC patients, especially in combination with high MALAT1/ SLAIN2 expression.

Interpretation: miR-106b-5p served as a suppressor in combination with MALAT1/miR-106b-5p/SLAIN2, which might be a group of potential prognostic biomarkers in the prognosis of CRC. FUND: This work was supported by National Program Project for Precision Medicine in National Research and Development Plan of China (2016YFC0905300), National Natural Science Foundation of China (81572930), National Key Research and Development Program of the Ministry of Science and Technology of China (2016YFC0905303, 2016YFC1303200), Beijing Science and Technology Program (D17110002617004), Non-profit Central Research Institute Fund of Chinese Academy of Medical Sciences (2018PT32012), CAMS Innovation Fund for Medical Sciences (CIFMS) (2016-I2M-1-001), Incentive Fund for Academic Leaders of Oncology Hospital, Chinese Academy of Medical Sciences (RC2016003), and Beijing Hope Run Special Fund from Cancer Foundation of China (LC2017A19). The project of Shanghai Jiaotong Univversity (YG2017QN30).

Keywords: Colorectal cancer progression; MALAT1; Microtubules mobility; miR-106ba-5p.


Figures

Fig. 1
Fig. 1
Low expression of miR-106b-5p is correlated to tumor progression and predicts poor survival in CRC patients. (a) The expression levels of miR-106b-5p in 95 pairs of CRC and normal tissues by qPCR analyses. (b) Relative miR-106b-5p expression levels in stage I-II and stage III-IV tumor tissues. (c) Relative miR-106b-5p expression levels in tumor relapse and non-relapse groups. (d–e) Kaplan–Meier analysis with a log-rank test for OS (d) and RFS (e) in 95 CRC patients according to miR-106b-5p expression. (f–g) Kaplan–Meier analysis with a log-rank test for OS in non-relapse groups (f) and relapse groups (g). Box and whiskers plot: min to max; **P < .01; ***P < .001, two-tailed Student t-test.
Fig. 2
Fig. 2
Low expression of miR-106b-5p promotes CRC migration and invasion in vitro and metastasis in vivo. (a–b) The effects of miR-106b-5p downregulation on migratory (a) and invasive (b) capabilities in SW480 cells. (c–d) The effects of miR-106b-5p overexpression on migratory (c) and invasive (d) abilities in HCT-8 cells. Original magnification × 200; scale bar 50 μm. (e) Representative image of ultrasound detection (left panel) and HE staining (right panel; original magnification × 400; scale bar 50 μm) of liver metastasis in nude mice three weeks after the injection of CRC cells via tail vein; tumor node (red and black arrows); normal liver cell (green arrow). (f) Nude mice was divided into four groups (n = 5) and injected with miR-106b-5p silenced-SW480, miR-106b-5p overexpressed-HCT-8 or their controls. The number of tumor colony in the liver of nude mice was counted with ultrasound detection. Error bars in Fig. f denote s.d. of each group (5 mice). In remaining cases, error bars denote s.d. of triplicates. *P < .05; **P < .01 ***P < .001, Student's t-test. (For interpretation of the references to colour in this figure legend, the reader is referred to the web version of this article.)
Fig. 3
Fig. 3
MALAT1 functions as a competing endogenous RNA by sponging miR-106b-5p. (a) Predicted paired bases of miR-106b-5p in MALAT1. Mut type of MALAT1 and miR-106b-5p was generated by the mutation at the paired bases. (b) Schematic images of a construction containing MALAT1 wild or mutant type combined with MS2 binding sequence. (c) MS2-RIP followed by miR-106b-5p qPCR to measure miR-106b-5p endogenously associated with MALAT1. (d) SW480 and HCT-8 cell lysates were incubated with biotin-labeled MALAT1, qPCR analyses miR-106b-5p expression in the products of pulldown by biotin. (e) SW480 and HCT-8 cell lysates were incubated with biotin-labeled miR-106b-5p. qPCR analyses for MALAT1 expression in the products of pulldown. (f–g) Effects of miR-106b-5p knock down or overexpression on luciferase reporter activity with the wild-type and mutated MALAT1. (h–i) AGO2-RIP followed by qPCR to evaluate MALAT1 level after miR-106b-5p knockdown or overexpression. (j–k) Relative miR-106b-5p expression levels in SW480 cells transfected with MALAT1 or mut MALAT1 and HCT-8 cells transfected with shMALAT1. (l) The correlation analysis (Pearson's correlation) of MALAT1 and miR-106b-5p expression in 95 CRC tissues. Error bars in Fig. c–k denote s.d. of triplicates. **P < .01; ***P < .001; ns for no significance. Student's t-test.
Fig. 4
Fig. 4
MALAT1 regulates the expression of SLAIN2 through competitive interaction with miR-106b-5p. (a) Potential targets of miR-106b-5p predicted with five miRNA target databases. (b) Schematic diagram of the luciferase reporter containing SLAIN2 3′UTR. Mutations were generated at the predicted miR-106b-5p-binding sites. (c) Roles of gradient concentration of miR-16b-5p inhibitor or mimics on the luciferase reporter activity with the wild-type SLAIN2 3′UTR. (d–e) Effects of miR-106b-5p overexpression or knock down on luciferase reporter activity with the wild-type and mutated SLAIN2 3′UTR. (f–g) SLAIN2 RNA expression in miR-106b-5p-overexpressed SW480 and silenced HCT-8 cells. (h–i) SLAIN2 protein levels in the above cells. (j) MALAT1 and SLAIN2 share the same miRNA binding site. (k–l) Luciferase activity of SLAIN2 wild-type or mutated 3′UTR in SW480 cells co-transfected with MALAT1, MALAT1 mut or MALAT1 + miR-106b-5p (k) and HCT-8 cells co-transfected with shNC, shMALAT1 or shMALAT1+ miR-106b-5p (l). (m–n) SLAIN2 RNA expression level in SW480 cells transfected with MALAT1, MALAT1 mut or MALAT1 + miR-106b-5p (m) and HCT-8 cells transfected with shNC, shMALAT1 or shMALAT1+ miR-106b-5p (n). (o) Western blot analysis of SLAIN2 expression in the above cells. (p) Representative IHC staining of SLAIN2 in 95 CRC tissues, original magnification × 200; scale bar 100 μm. (q–r) The correlation analyses (Pearson's correlation) of miR-106b-5p expression (q) or MALAT1 level (r) and SLAIN2 IHC scores in 95 CRC samples. Error bars denote s.d. of triplicates. *P < .05; **P < .01; ***P < .001; ns means no significance. Student's t-test.
Fig. 5
Fig. 5
SLAIN2 promotes CRC invasion and metastasis via facilitates microtubules mobility. (a) The SLAIN2 expression evaluated by Western blot after transfected with Lv-SLAIN2 in SW480 cells. (b–c) The effects of SLAIN2 overexpression on migration and invasion.in SW480 cells. Original magnification × 200; scale bar 50 μm. (d) SLAIN2 expression levels were tested by western blot after transfected with three shRNAs in HCT-8 cells. (e–f) The roles of SLAIN2 knock-down on migratory and invasive capabilities in HCT-8 cells. Original magnification × 200; scale bar 50 μm. (g–h) The number of liver metastatic lesions in nude mice injected with the above SW480 (g) and HCT-8 (h) cells via tail vein. (i–j) FRAP assay analysis of mobility fraction and T1/2 (Time it took for half of the mobile fraction of microtubules to recover) after SLAIN2 overexpression and knock-down. (k) Western blot measured acetylated α-tubulin in SLAIN2 overexpressed-SW480 and SLAIN2-silenced HCT-8 cells. **P < .01; ***P < .001. Error bars in Fig. g–h denote s.d. of each group (5 mice). In remaining cases, error bars denote s.d. of triplicates. **P < .01 ***P < .001. P values were calculated with two-way ANOVA in Fig. i and Student's t-test in other panels.
Fig. 6
Fig. 6
MALAT1 sponges miR-106b-5p to promote the invasion and metastasis via SLAIN2-mediated the enhanced MTs mobility. (a) FRAP assay analysis of mobility fraction and T1/2 (Time it took for half of the mobile fraction of microtubules to recover) in SW480 cells after transfected with MALAT1, MALAT1 mut or MALAT1 + miR-106b-5p. (b) Mobility fraction and T1/2 was measured with FRAP assay between the group treated with shNC, shMALAT1 and shMALAT1+ miR-106b-5p inhibitor in HCT-8 cells. (c–d) Western blot evaluated acetylated α-tubulin expression in MALAT1, MALAT1 mut or MALAT1 + miR-106b-5p transfected SW480 (c) and shNC, shMALAT1 and shMALAT1+ miR-106b-5p inhibitor treated HCT-8 cells (d). (e–f) Transwell assay analyzed the migratory and invasive abilities in MALAT1, MALAT1 mut or MALAT1 + miR-106b-5p transfected SW480 cells. (g–h) The changes of migratory and invasive abilities in shNC, shMALAT1 and shMALAT1+ miR-106b-5p inhibitor treated HCT-8 cells. (i–j) The number of liver metastatic lesions in nude mice injected with the above SW480 and HCT-8 cells via tail vein. Error bars in Fig. i–j denote s.d. of each group (5 mice). In remaining cases, error bars denote s.d. of triplicates. *P < .05; **P < .01; ***P < .001. P values were calculated with two-way ANOVA in left panel of a-b and Student's t-test in other panels.
Fig. 7
Fig. 7
High-level of MALAT1 is associated with CRC metastasis and predicts poor survival. (a) The expression of MALAT1 in 95 pairs of CRC and normal tissues by qPCR analyses. Data was calculated with 2−ΔΔCt method. (b) Relative MALAT1 expression levels in stage I-II and stage III-IV tumor tissues. (c) Relative MALAT1 expression levels in tumor relapse and non-relapse groups. (d–e) Kaplan–Meier analysis with a log-rank test for OS (d) and RFS (e) in 95 CRC patients according to MALAT1 expression. (f–g) Kaplan–Meier analysis with a log-rank test for OS in non-relapse (f) and relapse groups (g). Box and whiskers plot: min to max; ***P < .001, two-tailed Student t-test.
Fig. S1
Fig. S1
The expression and prognosis analysis of miR-106b according to TCGA database. (a) The expression levels of miR-106b in the TCGA CRC dataset. (b) Kaplan-Meier curves for OS of CRC patients in the TCGA dataset (n = 328).
Fig. S2
Fig. S2
miR-106b-5p is downregulated in CRC cell lines. (a) The expression of miR-106b-5p in one normal intestinal epithelial cell and 7 CRC cell lines by qPCR analyses. (b–c) Changes of miR-106b-5p expression in miR-106-5p-mimics treated HCT-8 cells (b) and in miR-106b-5p inhibitor treated SW480 cells (c). Error bars denote s.d. of triplicates. **P < .01. Student's t-test.
Fig. S3
Fig. S3
MALAT1 is the potential ceRNA of miR-106b-5p. (a) The expression of four miR-106b-5p associated lncRNAs predicted by bioinformatics in 20 pairs of CRC and normal tissues by qPCR analysis. (b) Relative HOTAIR and MALAT1 expression levels in stage I-II and stage III-IV tumor tissues. (c) MALAT1 expression levels in one normal intestinal epithelial cell and 7 CRC cell lines. (d) Correlation analysis (Pearson correlation) of MALAT1 and miR-106b-5p expression levels in 8 cell lines. (e–f) Changes of MALAT1 levels in MALAT1 plasmid transfected SW480 cells (e) and shMALAT1 transfected HCT-8 cells (f). (g) RNA fluorescence in situ hybridization (FISH) assay for MALAT1 and miR-106b-5p. Box and whiskers plot: min to max. Error bars denote s.d. of triplicates. *P < .05; ***P < .001. Student t-test.
Fig. S4
Fig. S4
SLAIN2 is the potential targets of miR-106b-5p. (a) qPCR analysis for the 9 predicted targets of miR-106b-5p in HCT-8 cells transfected with miR-106b-5p mimics. (b) Expression levels of miR-106b-5p in one normal intestinal epithelial cell and 7 CRC cell lines. (c) Correlation analysis (Pearson correlation) of miR-106b-5p and SLAIN2 mRNA expression levels in 8 cell lines.
Fig. S5
Fig. S5
MALAT1 promotes the migration and invasion by sponges miR-106b-5p in vitro. (a–b) Transwell assay for the migratory and invasive abilities in MALAT1, MALAT1 mut or MALAT1 + miR-106b-5p transfected SW480 cells. (c–d) The changes of migratory and invasive abilities in HCT-8 cells after treated with shNC, shMALAT1 and shMALAT1+ miR-106b-5p inhibitor. Original magnification ×200; scale bar 50 μm.
Fig. S6
Fig. S6
The expression and prognosis analysis of MALAT1 according to TCGA database. (a–b) Comparisons of the expression of MALAT1 in the TCGA CRC dataset (a, normal VS tumor; b, I-II stage VS IV stage). (c–d) Kaplan-Meier curves for OS (c, n = 370) and RFS (d, n = 340) of CRC patients in the TCGA dataset.

Similar articles

Cited by

References

    1. Siegel R.L., Miller K.D., Jemal A. Cancer Statistics. 2018;68(1):7–30. - PubMed
    1. Brouwer N.P.M., Bos A.C.R.K., Lemmens V.E.P.P. An overview of 25 years of incidence, treatment and outcome of colorectal cancer patients. Int J Cancer. 2018 Aug 10 - PMC - PubMed
    1. Hanahan D., Weinberg R.A. Hallmarks of cancer: the next generation. Cell. 2011;144(5):646–674. - PubMed
    1. Adams B.D., Parsons C., Walker L., Zhang W.C., Slack F.J. Targeting noncoding RNAs in disease. J Clin Invest. 2017;127(3):761–771. - PMC - PubMed
    1. Li Q., Zou C., Zou C. MicroRNA-25 functions as a potential tumor suppressor in colon cancer by targeting Smad7. Cancer Lett. 2013;335(1):168–174. - PubMed

MeSH terms