. 2019 Jun;175(2):327-337.
doi: 10.1007/s10549-019-05161-8. Epub 2019 Feb 23.

SNAIL is induced by tamoxifen and leads to growth inhibition in invasive lobular breast carcinoma

Affiliations

SNAIL is induced by tamoxifen and leads to growth inhibition in invasive lobular breast carcinoma

Emily A Bossart et al. Breast Cancer Res Treat. 2019 Jun.

Abstract

Purpose: Invasive lobular carcinoma (ILC) is a histological subtype of breast cancer that is predominantly estrogen receptor alpha (ER)-positive (+) and is thus treated with endocrine therapies. Herein, we sought to understand the molecular underpinnings of the 4-hydroxytamoxifen (4OHT) resistance in ILC by assessing the potential role of the epithelial-to-mesenchymal transition transcription factor (EMT-TF) SNAIL (SNAI1).

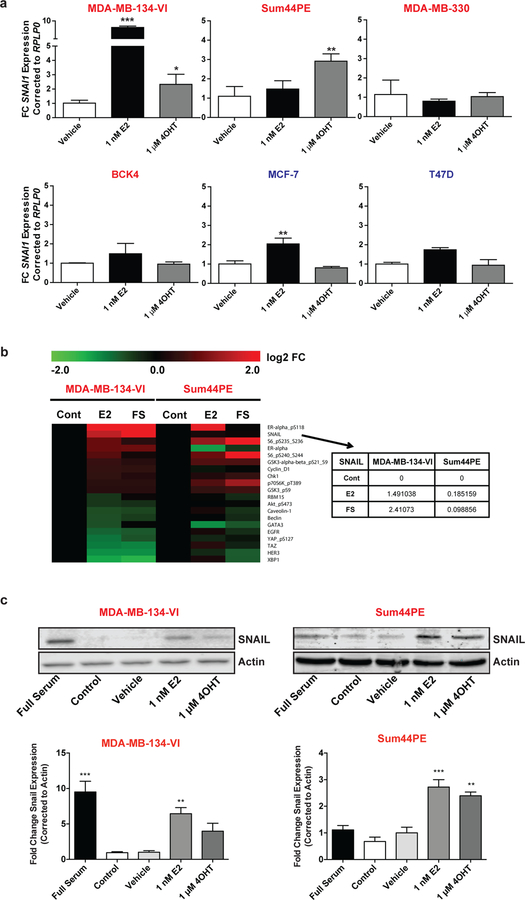
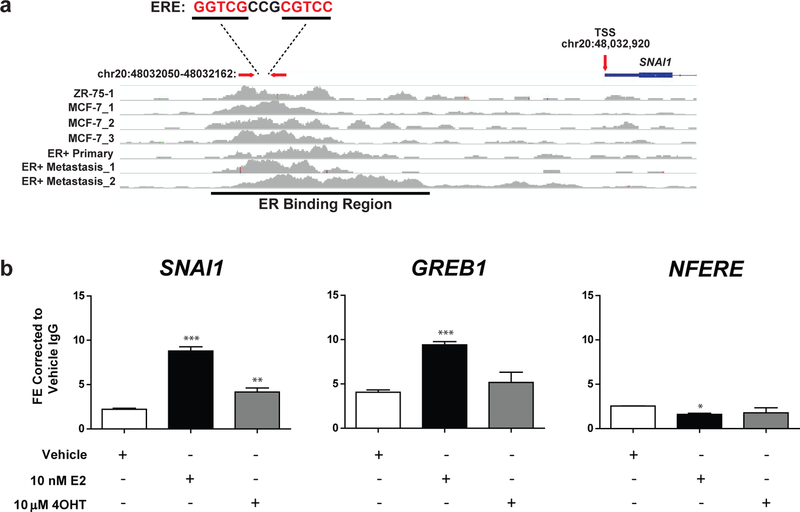
Methods: Using a series of breast cancer cell lines, we measured the basal, estrogen and 4OHT-induced expression of SNAIL and other EMT-TF family members by quantitative reverse transcription-polymerase chain reaction and immunoblotting. Chromatin immunoprecipitation experiments were performed to assess ER binding to the SNAIL promoter. Cell proliferation, cell cycle and apoptosis were assessed in 2D cultures. 3D growth was assessed in Matrigel and Collagen I cultures.

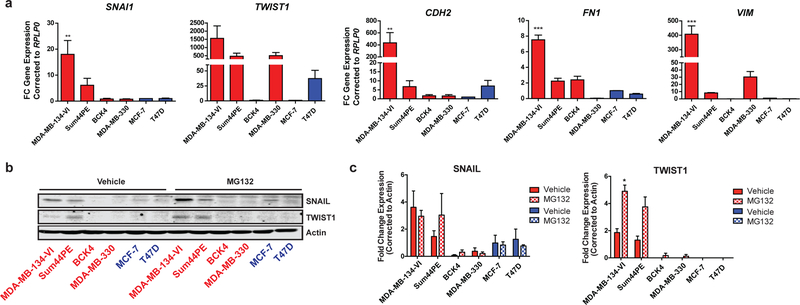
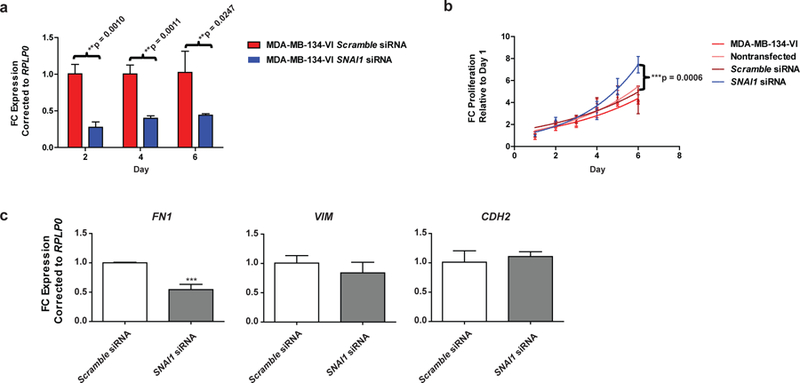
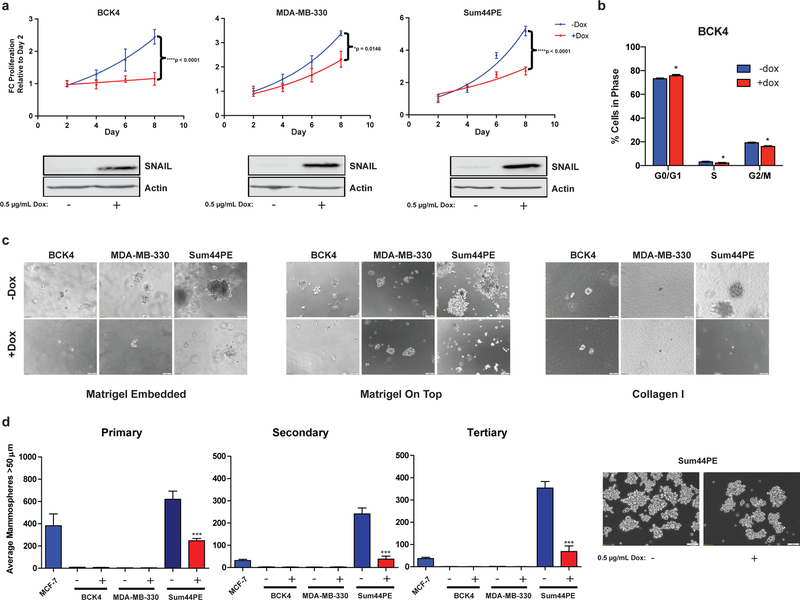
Results: Estrogen and 4OHT induced SNAIL expression, but not that of the other EMT-TF family members SLUG (SNAI2) and SMUC (SNAI3), with the 4OHT effect being specific to the lobular but not the ductal subtype. We observed estrogen and 4OHT-induced ER recruitment to the SNAI1 promoter and high endogenous basal levels of SNAIL and several EMT-TFs in ILC cell lines. While SNAIL knockdown had a minor impact on the 4OHT partial agonism in estrogen-depleted conditions, it led to a surprising increase in cell proliferation in full serum. In complementary experiments, inducible SNAI1 overexpression caused decreased proliferation, associated with a cell cycle arrest in G0/G1. Additionally, apoptosis was observed in BCK4 cells.

Conclusion: These data suggest a previously unrecognized role for SNAIL in ILC, substantiating a context-dependent behavior for this EMT-TF.

Keywords: Breast cancer; EMT; ER; Lobular; SNAIL; Tamoxifen.


Conflict of interest statement

Conflict of Interest

Dr. Timothy F. Burns serves on an Advisory Board for AbbVie, Inc., and Dr Oesterreich is member of External Scientific Advisory Board Panel of NSABP. The authors declare that they have no conflict of interest.

Figures

Fig. 1
Fig. 1
4OHT Acts as an Agonist in ER+ ILC Cells. a SNAI1 qRT-PCR assessment of ILC (red) and IDC (blue) cells was performed at 24 hours post deprivation/treatments (Vehicle 0.1% DMSO). Quantifications are a representative single experiment ± STDEV of technical triplicates, with similar results in two additional independently performed experiments. Asterisks depict significance compared to Vehicle from One Way ANOVA followed by Tukey’s post-test. b RPPA analysis of MDA-MB-134-VI and Sum44PE cells in Full Serum (FS) or deprived of exogenous estrogens (Cont) followed by treatment with 1 nM E2 for 24 hours. Top ten E2-upregulated and downregulated proteins in MDA-MB-134-VI cells are displayed. Log2 fold change (FC) for SNAIL is depicted in the table. (C) SNAIL immunoblots were performed in MDA-MB-134-VI and Sum44PE cells at 24 hours post deprivation/treatments. Representative images are displayed (top) along with quantification of band intensities (bottom). Graphs represent mean +/− standard error relative to Vehicle from independent experiments (n=3). Asterisks depict significance compared to Vehicle from One Way ANOVA followed by Dunnett’s post-test. (*p<0.05, **p<0.005, ***p<0.0005)
Fig. 2
Fig. 2
ER is Recruited to the Promoter of SNAI1. a Conserved EREs upstream of the SNAI1 transcriptional start site (TSS) from in silico analyses of publicly available ER ChIP data were identified. Build hg18 was used. The general ER binding region is underlined. Arrows indicate the position of designed ChIP qRT-PCR primers and the TSS, and an excerpt shows the ERE in the ChIP qRT-PCR primer region with base pairs from the ER motif shown in red font and spacer base pairs in black font. The primer region is 1 kbp upstream of the TSS. b ER ChIP was performed in MDA-MB-134-VI cells after a period of three days of estrogen deprivation and treatment with vehicle (0.1% DMSO), E2, or 4OHT for 8 hours. ChIP qRT-PCR was performed and displayed as mean ± STDEV of technical triplicates relative to vehicle IgG control for region of interest SNAI1, positive E2 control GREB1, and negative control NFERE. Statistics were performed using One Way ANOVA followed by Tukey’s post-test (*p<0.05, **p<0.005, ***p<0.0005) with comparison relative to vehicle control displayed with asterisks. Data are representative of two independently performed experiments
Fig. 3
Fig. 3
EMT-TF Related Genes are Upregulated in ILC. a mRNA and b protein expression of two EMT-TFs and downstream EMT targets in ILC (red) and IDC (blue) ER+ cells. Combined qRT-PCR data from three independent experiments are shown relative to MCF-7 as means ± SEM. One Way ANOVA followed by Tukey’s post-test are displayed with asterisks comparing cells to MCF-7 expression of a gene of interest. Immunoblot is representative of a set of three independently performed experiments ± 5 µM MG132 treatment for two hours. c Quantification of band intensities from b. Graphs represent mean +/− standard error relative to Vehicle from independent experiments (n=3). Asterisks depict significance from t-tests followed by correction for multiple comparisons using the Holm-Sidak method. (*p<0.05, **p<0.005, ***p<0.0005)
Fig. 4
Fig. 4
Transient SNAI1 Knockdown Leads to Decreases in Few EMT-TF Targets and Increases Proliferation. Transient knockdown of SNAI1 was performed in 2D plates with Scramble or SNAI1 siRNA. a qRT-PCR confirmation of transient knockdown of SNAI1 throughout experiment was completed at days two, four, and six with Student’s t-test evaluations shown. Data represent three independently repeated experiments. b Representative 2D proliferation data corrected to background media fluorescence and shown relative to day one values. Non-linear regression exponential growth curves were fitted and a comparison of growth rates was performed; significance between Scramble and SNAI1 siRNA groups is displayed. c Representative qRT-PCR data of probed downstream EMT-TF targets are displayed as means relative to Scramble ± STDEV of technical triplicates with One Way ANOVA followed by Tukey’s post-test (*p<0.05, **p<0.005, ***p<0.0005) displayed by asterisks. Data represent two independently repeated experiments. MDA-MB-134-VI: no transfection reagent or siRNA. Nontransfected: transfection reagent only; no siRNA
Fig. 5
Fig. 5
SNAIL Overexpression Causes Decreased Proliferative, Invasive, and Stem-Like Phenotypes. Inducible SNAIL overexpression ILC BCK4, MDA-MB-330, and Sum44PE cells were treated to ± Dox in a 2D environments followed by b evaluation of cell cycle profiles for BCK4 cells at day 4. Data in b are representative of two independently performed experiments with three technical replicates per experiment ± STDEV and asterisks depict significance from t-tests followed by correction for multiple comparisons using the Holm-Sidak method. In addition, cells were probed for phenotypic changes in c 3D environments, or d in a mammosphere assay. Scale bars represent 50 µm. Proliferation curves and protein were assessed as previously. Data in a are a representative experiment of three independently performed experiments with six technical replicates per time point ± STDEV, displayed relative to day 2. Data in d are three independently performed experiment means ± SEM, each performed with technical triplicates. One Way ANOVA followed by Tukey’s post-test (*p<0.05, ***p<0.0005; ****p<0.0001), are displayed with asterisks comparing ± Dox treatment. Images from c and d represent phase images at day 24 or day 17, respectively, 20X magnification

Similar articles

Cited by

References

    1. Howlader N, N.A., Krapcho M, Miller D, Bishop K, Kosary CL, et al. SEER Cancer Statistics Review, 1975–2014 2017. April 2017; Based on November 2016 SEER data submission].
    1. Society AC Cancer Facts and Figures 2017 2017.
    1. Barroso-Sousa R and Metzger-Filho O, Differences between invasive lobular and invasive ductal carcinoma of the breast: results and therapeutic implications. Ther Adv Med Oncol, 2016. 8(4): p. 261–6. - PMC - PubMed
    1. Ciriello G, et al., Comprehensive Molecular Portraits of Invasive Lobular Breast Cancer. Cell, 2015. 163(2): p. 506–19. - PMC - PubMed
    1. Christgen M, et al., Lobular breast cancer: Clinical, molecular and morphological characteristics. Pathol Res Pract, 2016. 212(7): p. 583–97. - PubMed

MeSH terms