. 2019 Mar 7;176(6):1502-1515.e10.
doi: 10.1016/j.cell.2019.01.020. Epub 2019 Feb 21.

Extensive Heterogeneity and Intrinsic Variation in Spatial Genome Organization

Affiliations

Extensive Heterogeneity and Intrinsic Variation in Spatial Genome Organization

Elizabeth H Finn et al. Cell. .

Abstract

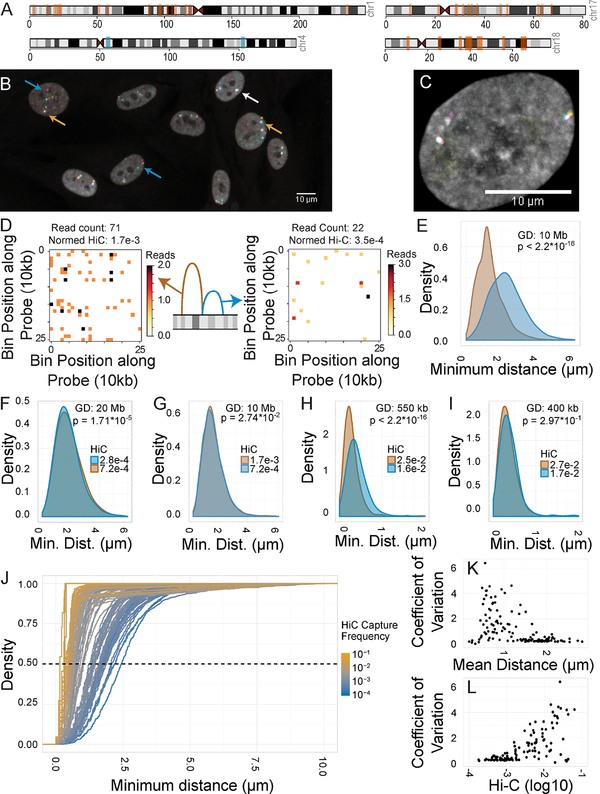
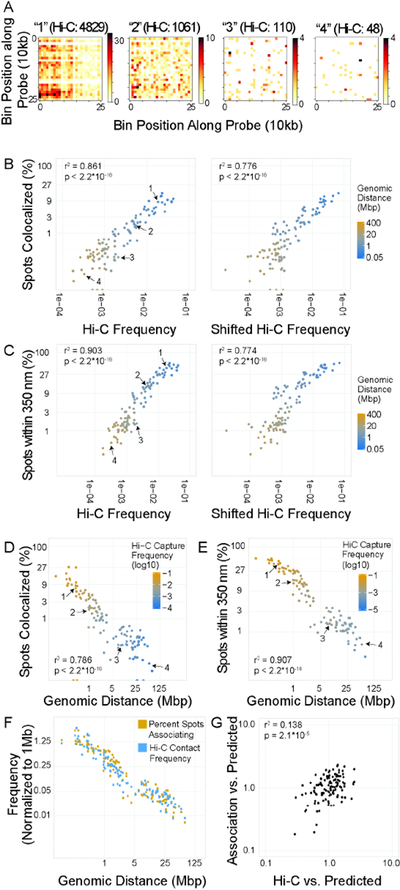
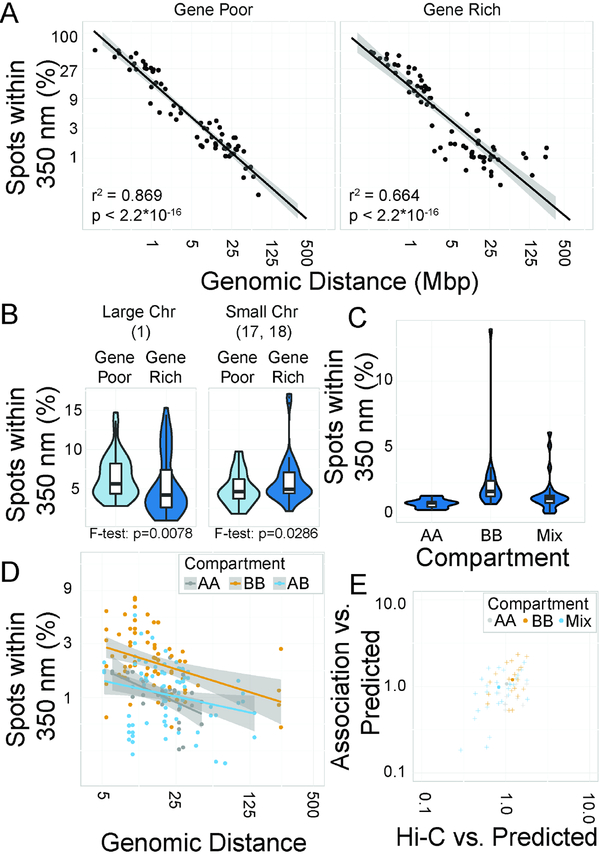
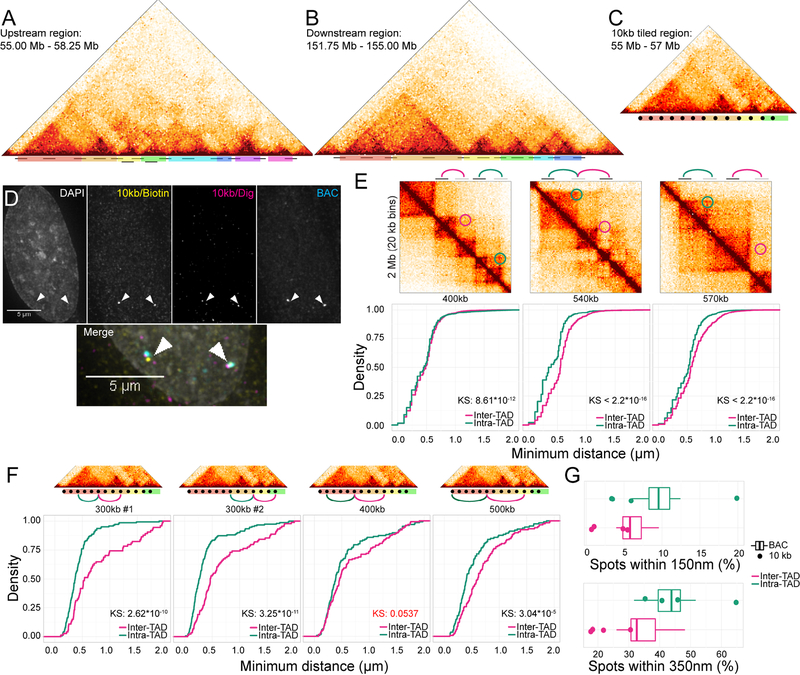
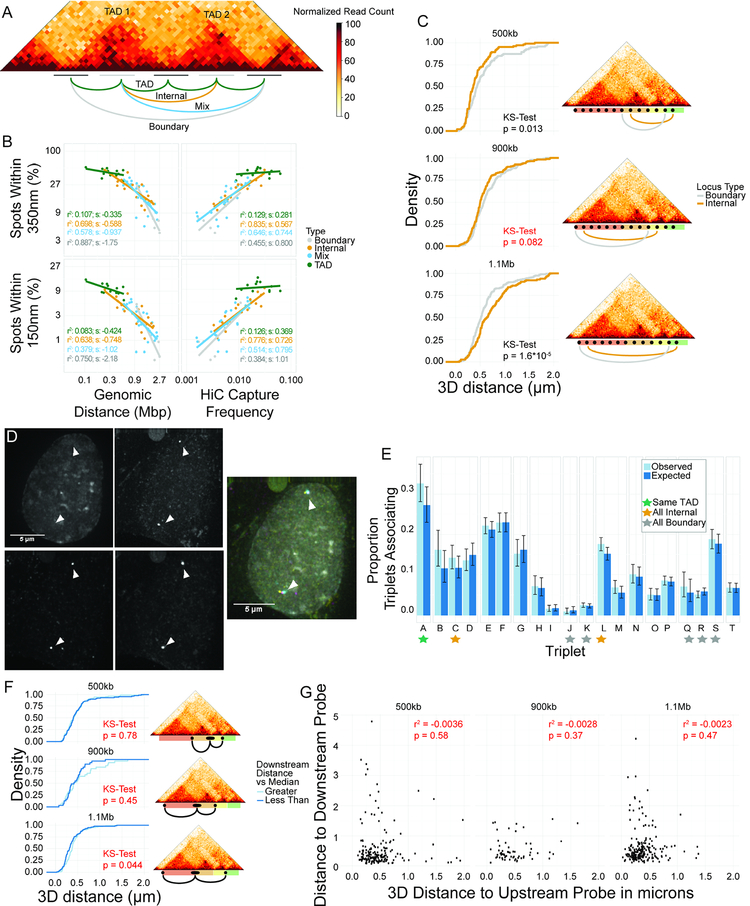
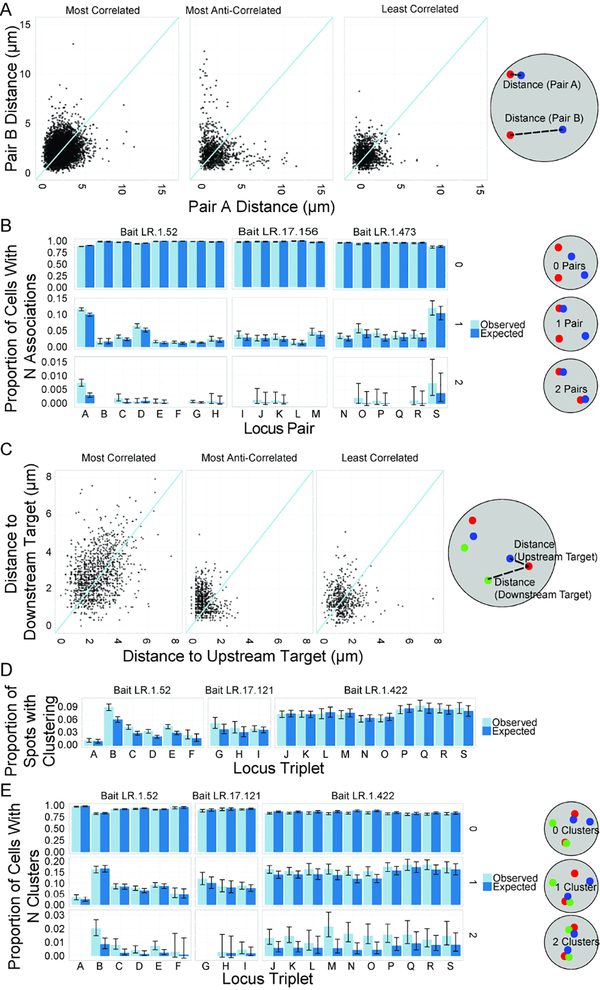
Several general principles of global 3D genome organization have recently been established, including non-random positioning of chromosomes and genes in the cell nucleus, distinct chromatin compartments, and topologically associating domains (TADs). However, the extent and nature of cell-to-cell and cell-intrinsic variability in genome architecture are still poorly characterized. Here, we systematically probe heterogeneity in genome organization. High-throughput optical mapping of several hundred intra-chromosomal interactions in individual human fibroblasts demonstrates low association frequencies, which are determined by genomic distance, higher-order chromatin architecture, and chromatin environment. The structure of TADs is variable between individual cells, and inter-TAD associations are common. Furthermore, single-cell analysis reveals independent behavior of individual alleles in single nuclei. Our observations reveal extensive variability and heterogeneity in genome organization at the level of individual alleles and demonstrate the coexistence of a broad spectrum of genome configurations in a cell population.


Conflict of interest statement

DECLARATION OF INTERESTS

The authors declare no competing interests.

Figures

Figure 1:
Figure 1:. Spatial mapping of genome interactors.
A: Ideogram of loci used for spatial mapping. Orange bars: long-range sites. Blue bars: tiled regions. B: FISH image HFFs stained for three loci on chromosome 1. Blue arrows: spots separated by large distances. White arrow: all spots colocalized. Orange arrows: two of three spots colocalized. C: FISH image of an HFF stained for three loci on chromosome 4. D: Schematic diagram and Hi-C maps of “interactor” and “non-interactor”. E: 3D distance distributions minimal distances between “interactor” (brown) and “non-interactor” (blue). F-I: Distance distributions for distance-matched regions. 2D distances are used in panels H and I. J: Cumulative distance distributions for all tested pairs. Dashed line: median (50% total density). K-L: Coefficient of variation of spatial distance vs. Hi-C frequency or mean spatial distance for all 125 pairs.
Figure 2:
Figure 2:. Correlation between Hi-C, genomic distance, and colocalization.
A: 10 kb resolution Hi-C maps of 250×250 kb regions centered on four interactions with variable Hi-C frequencies. These pairs are marked as 1–4 in subsequent scatter plots. B, C: Scatter plot of percentage of spot pairs with measured 3D distance = 0 (B) or < 350nm (C) vs. Hi-C frequency or shifted Hi-C frequency. D, E: Scatter plot of percentage of spot pairs with measured 3D distance = 0 (D) or < 350nm (E) vs. genomic distance. F: Scatterplot of enrichment of percent spots associating or Hi-C capture frequency vs. 1 Mb average for each site pair vs. genomic distance. G: Scatterplot of values normalized by distance-based predictions. Predicted values were generated based on a single power law model, and the ratio between predicted and observed value was used.
Figure 3:
Figure 3:. Modifiers of association frequencies.
A: Scatterplots of percentage of spot pairs within 350 nm vs. genomic distance. Line of best fit indicated. B: Violin plots of percentage of spot pairs within 350 nm. C: Violin plots of percentage of spot pairs within 350 nm by compartment. D: Scatterplot of percentage of spot pairs within 350 nm vs. genomic distance. E: Scatterplot of association likelihood vs. Hi-C score, normalized to a distance-based power law model.
Figure 4:
Figure 4:. Enrichment of Intra-TAD interactions.
A-C: Hi-C plots showing regions tiled with location of probes marked (black bars) and TADs color-coded. D: FISH image using 10 kb probes and positive control BAC. E: Hi-C snapshots and distance distributions for distance matched interaction pairs between and within TADs, as measured by BAC probes. F: As in E, but with 10 kb probes. Non-significant p-value marked in red. G: Box plots showing distribution of percent spots within 150 or 350 nm. Boxes: BAC probes, points: 10 kb probes.
Figure 5:
Figure 5:. Neighboring and nearby TADs associate at internal regions, not boundaries.
A: Diagram of four classes of interactions. B: Scatterplots of percentage of spot pairs within 350 nm (top panels) or 150 nm (bottom panels) vs. either genomic distance (left panels) or Hi-C capture frequency (right panels). C: CDFs of 3D distances for boundary element association and internal region association using 10 kb probes. Non-significant p-value in red. D: Representative image of tight colocalization of BAC probe and two 10 kb probes. E: Barplot of proportion of triplet clusters (colocalization of all three probes) vs. expected numbers based on an assumption of statistical independence between pairwise interactions. Triplet IDs in Table S3. F: CDFs of distance distributions for upstream 10kb probes, classified based on distance from BAC to downstream 10kb probe. Downstream probe farther than median: light blue. Downstream probe is closer than median: dark blue. Maps at the right show location of probe pairs tested. Non-significant p-values in red. G: Scatterplots showing lack of correlation between distance to upstream and downstream 10kb probes.
Figure 6:
Figure 6:. Allelic independence of interactions.
A: Scatterplots of minimal distances of both alleles of an interaction pair on a per-cell basis at the most correlated site pair, least correlated site pair, and most anti-correlated site pair. B: Bar graph showing observed and expected proportion of cells with 0, 1, or 2 associations within 350 nm between spots for a variety of selected site pairs. C: Scatterplots showing correlation of distances between bait and two targets (upstream target and downstream target) on a per-bait basis, for most correlated, most anti-correlated, and least correlated triplets. D: Bar graph showing observed and expected proportion of bait spots with a triplet association within 350 nm for selected triplets. E: Bar graph showing observed and expected proportion of cells with 0, 1, or 2 triplet associations for selected triplets. For all comparisons, see Figure S6. Probe IDs for all panels in Table S3.

Comment in

  • Erratic loci relationships.
    Zlotorynski E. Zlotorynski E. Nat Rev Mol Cell Biol. 2019 Apr;20(4):196-197. doi: 10.1038/s41580-019-0115-5. Nat Rev Mol Cell Biol. 2019. PMID: 30833794 No abstract available.

References

    1. Abdennur N, Goloborodko A, Imakaev M, and Mirny L (2017). Mirnylab/cooler v0.7.6 (Version 0.7.6). Zenodo 10.5281/zenodo.1039971 - DOI
    1. Ay F, Vu TH, Zeitz MJ, Varoquaux N, Carette JE, Vert JP, Hoffman AR, and Noble WS (2015). Identifying multi-locus chromatin contacts in human cells using tethered multiple 3 C. BMC genomics 16, 121. - PMC - PubMed
    1. Beagrie RA, Scialdone A, Schueler M, Kraemer DC, Chotalia M, Xie SQ, Barbieri M, de Santiago I, Lavitas LM, Branco MR, et al. (2017). Complex multi-enhancer contacts captured by genome architecture mapping. Nature 543, 519–524. - PMC - PubMed
    1. Benanti JA, and Galloway DA (2004). Normal human fibroblasts are resistant to RASinduced senescence. Mol Cell Biol 24, 2842–2852. - PMC - PubMed
    1. Benedetti F, Dorier J, Burnier Y, and Stasiak A (2014). Models that include supercoiling of topological domains reproduce several known features of interphase chromosomes. Nucleic Acids Res 42, 2848–2855. - PMC - PubMed

Publication types