. 2019 Mar 7;176(6):1447-1460.e14.
doi: 10.1016/j.cell.2019.01.016. Epub 2019 Feb 21.

Acetylation Blocks cGAS Activity and Inhibits Self-DNA-Induced Autoimmunity

Affiliations

Acetylation Blocks cGAS Activity and Inhibits Self-DNA-Induced Autoimmunity

Jiang Dai et al. Cell. .

Abstract

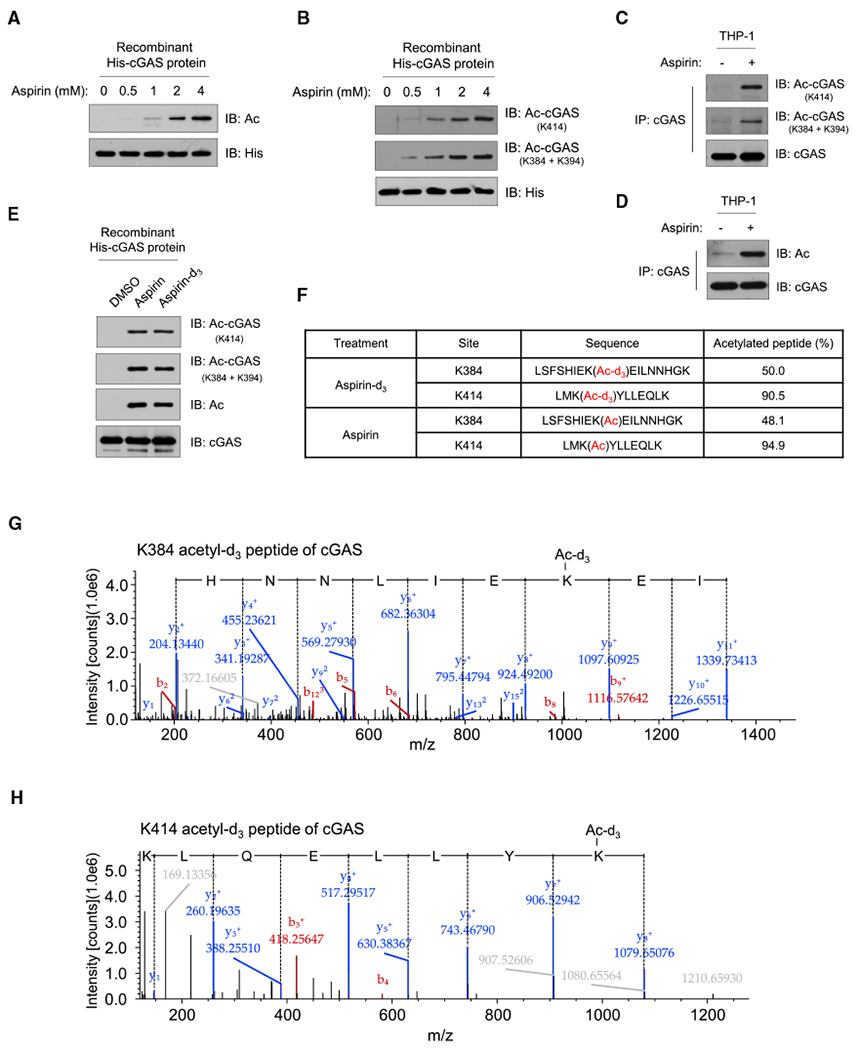
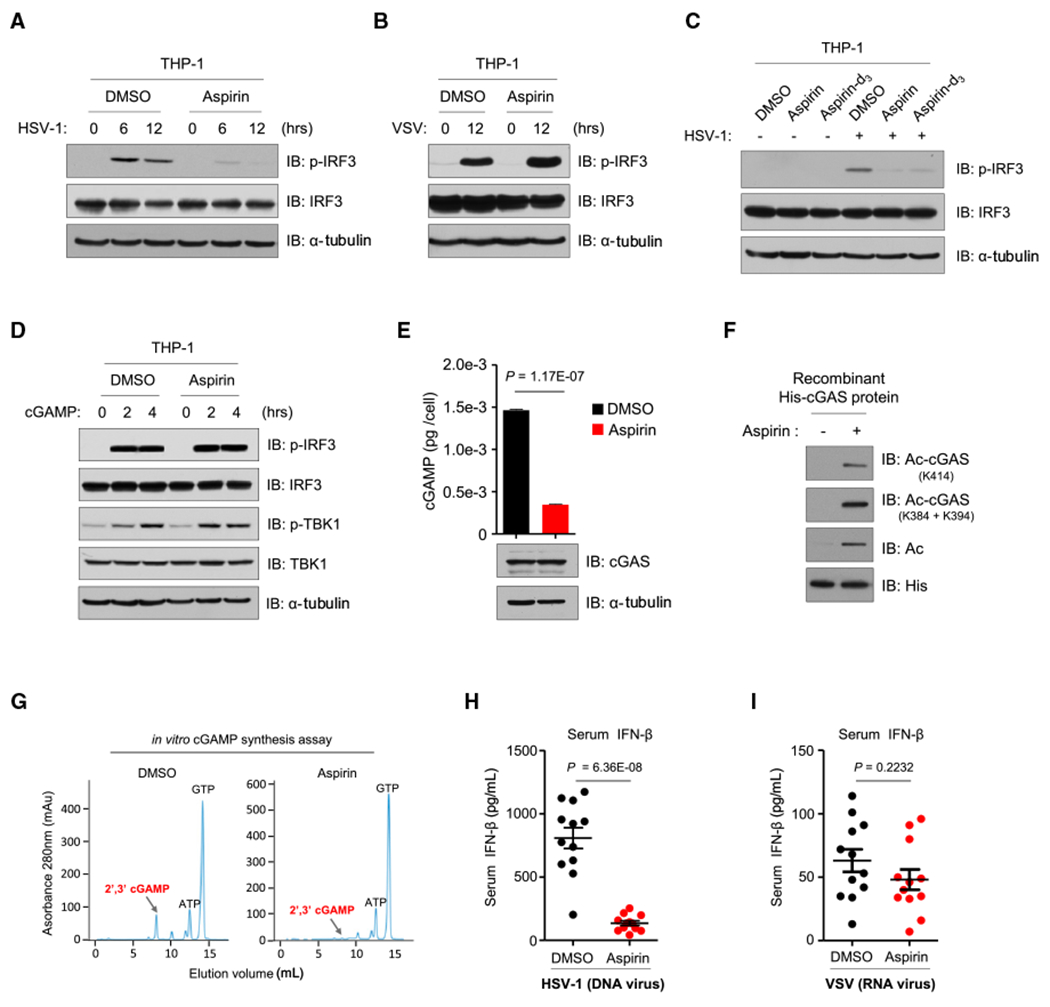
The presence of DNA in the cytoplasm is normally a sign of microbial infections and is quickly detected by cyclic GMP-AMP synthase (cGAS) to elicit anti-infection immune responses. However, chronic activation of cGAS by self-DNA leads to severe autoimmune diseases for which no effective treatment is available yet. Here we report that acetylation inhibits cGAS activation and that the enforced acetylation of cGAS by aspirin robustly suppresses self-DNA-induced autoimmunity. We find that cGAS acetylation on either Lys384, Lys394, or Lys414 contributes to keeping cGAS inactive. cGAS is deacetylated in response to DNA challenges. Importantly, we show that aspirin can directly acetylate cGAS and efficiently inhibit cGAS-mediated immune responses. Finally, we demonstrate that aspirin can effectively suppress self-DNA-induced autoimmunity in Aicardi-Goutières syndrome (AGS) patient cells and in an AGS mouse model. Thus, our study reveals that acetylation contributes to cGAS activity regulation and provides a potential therapy for treating DNA-mediated autoimmune diseases.

Keywords: Aicardi-Goutiéres syndrome; Trex1; acetylation; aspirin; autoimmune disease; cGAS; interferonopathies.


Figures

Figure 1.
Figure 1.. Acetylation Inhibits cGAS-Mediated Type I IFN Production
(A and B) Plasmids encoding FLAG-tagged wild-type (WT) human cGAS and its acetylation-mimetic (K-to-Q) mutants (A) or K-to-R mutants (B) were transfected into HEK293T cells that stably expressed STING (HEK293T-STING). Shown is immunoblot analysis of phosphorylation of IRF3 in the cells. (C–H) cGAS knockout THP-1 cells were infected with a lentivirus carrying WT or acetylation-mimetic cGAS to make cell lines expressing different cGAS mutants. The cells were differentiated with phorbol-12-myristate-13-acetate (PMA) for 72 h, followed by transfection of HT-DNA (2 μg/mL) for 6 h (C and D) or 3 h (G) or for the indicated time (E, F, and H). IRF3 phosphorylation was detected by immunoblotting (C and E). Total RNAs were extracted, and the IFNB1 mRNA levels were analyzed by qPCR (D and F). The production of cGAMP was detected by LC-MS/MRM. Data are mean ± SEM from triplicates (technical replicates); unpaired t test (D and F–H). Anti-α-tubulin (A–C and E) blots indicate loading of lanes. Data represent at least three independent experiments. See also Figure S1.
Figure 2.
Figure 2.. Acetylation Suppresses cGAS Activity
(A) A schematic describing the generation of site-specific acetylated recombinant cGAS protein with an acetyl-lysine tRNA, which incorporates the acetyl-lysine on the amber codon (uracil, adenine, guanine [UAG]). (B) Immunoblot analysis of the acetylated recombinant cGAS proteins with site-specific cGAS acetylation antibodies and the pan-acetyl-lysine antibody. The anti-His blot indicates loading of lanes. (C) Ion exchange chromatography analysis of cGAMP production from an in vitro cGAMP synthesis assay. (D) Real-time association and dissociation of non-acetylated or acetylated recombinant cGAS proteins with biotin-EGFP (EGFP-coding DNA sequence) were recorded by ForteBio Octet red 96. Processed kinetics data show binding affinity constants (equilibrium dissociation constant, KD). (E) FLAG-tagged WT cGAS was expressed in HEK293T cells. The cell lysates were then incubated with recombinant His-tagged cGAS proteins, cGASNon-Ac, cGASLys384Ac, cGASLys394Ac, or cGASLys414Ac. The cGAS-cGAS interaction was examined by pulling down His-tagged cGAS protein and immunoblotting with anti-FLAG antibody. (F) cGAS knockout THP-1 cells were infected with a lentivirus carrying WT or acetylation-mimetic cGAS to make cell lines expressing different cGAS mutants. Cells were differentiated with PMA for 72 h, followed by cycloheximide (CHX) (100 μg/mL) treatment for the indicated time. cGAS was immunoblotted. The anti-GAPDH blot indicates loading of lanes. (G) Immunofluorescence analysis of cGAS (red) in PMA-differentiated FLAG-cGAS or FLAG-cGAS3KQ expressing THP-1 cells. Hoechst (blue) stained the nuclei. Data represent at least three independent experiments. See also Figure S2.
Figure 3.
Figure 3.. Deacetylation of cGAS upon DNA Treatment Is Involved in cGAS Activation
(A) PMA-differentiated THP-1 cells that stably express FLAG-cGAS were left untreated or treated with HT-DNA (2 μg/mL) for 3 h. FLAG-cGAS was immunoprecipitated, and the acetylation of cGAS was analyzed with site-specific cGAS acetylation antibodies as indicated. (B) PMA-differentiated THP-1 cells were infected with HSV-1 (MOI = 10:1) for 6 h. cGAS was immunoprecipitated, and the acetylation of cGAS was analyzed with site-specific cGAS acetylation antibodies as indicated. (C) PMA-differentiated THP-1 cells were treated with HT-DNA (2 μg/mL) for 3 h. The interaction between HDAC3 and cGAS was examined by immunoprecipitation (IP) and immunoblotting. (D) Immunofluorescence analysis of cGAS (green) and HDAC3 (red) in human primary macrophages that were left untreated or stimulated with HT-DNA (1 μg/mL) for 2 h. Hoechst (blue) stained the nuclei. (E) THP-1 cells were transfected with control siRNAs or HDAC3 siRNAs for 24 h, followed by PMA treatment for another 48 h. Cells were then treated with HT-DNA (2 μg/mL) for 3 h. cGAS was immunoprecipitated, and acetylation of cGAS was analyzed with site-specific cGAS acetylation antibodies. ※ indicates non-specific bands (B and E). WCL, whole cell lysate (A–C and E). Anti-α-tubulin blots indicate loading of lanes (C and E). Data represent three independent experiments. See also Figure S3 and Table S1.
Figure 4.
Figure 4.. Aspirin Directly Acetylates Cgas
(A and B) Incubation of recombinant cGAS protein with aspirin. Shown is immunoblot analysis of cGAS acetylation with a pan-acetyl-lysine antibody (A) or site-specific cGAS acetylation antibodies (B). (C and D) PMA-differentiated THP-1 cells were treated with DMSO (–) or aspirin (4 mM) for 24 h, and cGAS was immunoprecipitated. cGAS acetylation was analyzed by immunoblotting with site-specific cGAS acetylation antibodies (C) or pan-acetyl-lysine antibody (D). (E) Incubation of recombinant cGAS protein with aspirin (4 mM) or isotopically labeled aspirin-d3 (4 mM). Shown is immunoblot analysis of cGAS acetylation with a pan-acetyl-lysine antibody or site-specific cGAS acetylation antibodies. (F–H) PMA-differentiated FLAG-cGAS-expressing THP-1 cells were treated with aspirin-d3 (4 mM) or aspirin (4 mM) for 24 h, and FLAG-cGAS was immunoprecipitated. The percentage of cGAS acetylation of the indicated sites (F) and the representative K384 (G) and K414 (H) acetylated peptides of cGAS with acetyl-d3 were analyzed by Thermo Scientific Q Exactive HF Hybrid Quadrupole-Orbitrap mass spectrometer. The y ion peaks are shown in blue, and the b ion peaks are shown in red. The partial amino acid sequence (from left to right, C-terminal to N-terminal) deduced from y ions is shown on the spectrum. The mass difference between y9 and y8 ions (G) or y8 and y7 ions (H) is the mass of the acetyl-d3-modified lysine residue. Anti-His blots (A and B) indicate loading of lanes. Data represent at least three independent experiments. See also Figure S4 and Table S2.
Figure 5.
Figure 5.. Aspirin Inhibits cGAS-Mediated IFN Production
(A and B) PMA-differentiated THP-1 cells were infected with HSV-1 (MOI = 10:1) (A) or VSV (MOI = 10:1) (B) after DMSO or aspirin (4 mM) pretreatment, and the phosphorylation of IRF3 was analyzed by immunoblotting. (C) PMA-differentiated THP-1 cells were infected with HSV-1 (MOI = 10:1) after DMSO, aspirin (4 mM), or aspirin-d3 (4 mM) pretreatment, and the phosphorylation of IRF3 was analyzed by immunoblotting. (D) PMA-differentiated THP-1 cells were pre-treated with DMSO or aspirin (4 mM) for 24 h, followed by treatment with cGAMP (1 μg/mL) for the indicated hours. Shown is immunoblot analysis of the phosphorylation of IRF3 and TBK1. (E) PMA-differentiated THP-1 cells were treated with DMSO or aspirin for 24 h, followed by a 2-h treatment of HT-DNA (1 μg/mL). cGAMP production was quantified by LC-MS/MRM; data are mean ± SEM from triplicates (technical replicates), unpaired t test. Shown is immunoblot analysis of cGAS in the corresponding protein samples (bottom). (F and G) Immunoblot analysis (F) and in vitro cGAMP synthesis assay (G) of recombinant cGAS proteins in the presence of DMSO or aspirin (4 mM). Site-specific cGAS acetylation antibodies and the pan-acetyl-lysine antibody were used to analyze cGAS acetylation. The anti-His blot indicates loading of lanes (F). (H and I) Wild-type C57BL/6J mice were given a daily intraperitoneal (i.p.) injection of DMSO (n = 12) or aspirin (50 mg/kg, n = 12) for 2 days, followed by i.p. injection of either HSV-1 (H) or VSV (I) for 6 h. Serum from mice was obtained for ELISA analysis of IFN-β concentration. Data are mean ± SEM, unpaired t test. Anti-α-tubulin blots indicate loading of lanes (A–E). Combined data of two independent experiments are shown (H and I); other data represent three independent experiments. See also Figure S5.
Figure 6.
Figure 6.. Aspirin Suppresses DNA-Mediated Autoimmunity in Mice
(A) Bone marrow cells from Trex1−/− mice were treated with aspirin at the indicated concentrations for 2 days. The mRNA levels of ISGs, as indicated, were analyzed by qPCR (relative to that of WT bone marrow cells). The IC50 was calculated by Statistical Package for the Social Sciences (SPSS). Data are mean ± SEM from triplicates (technical replicates). (B) Trex1−/− mice (n = 6) were given daily administration (i.p.) of aspirin (50 mg/kg), salicylic acid (50 mg/kg), diclofenac sodium (1 mg/kg), or DMSO for 7 days, and then the mRNA levels of ISGs in the mouse hearts were analyzed by qPCR. Data are mean ± SEM, unpaired t test. (C) 3-week old Trex1−/− mice were given daily treatment of aspirin (50 mg/kg), salicylic acid (50 mg/kg), diclofenac sodium (1 mg/kg), or DMSO for 1 week by i.p. injection. m-cGAS in the spleen was immunoprecipitated, and the acetylation of m-cGAS was analyzed with pan-acetyl-lysine antibody; anti-α-tubulin blots indicate loading of lanes. * indicates non-specific bands. (D) 3-week old Trex1−/− mice were administered (i.p.) aspirin (50 mg/kg), salicylic acid (50 mg/kg), diclofenac sodium (1 mg/kg), or DMSO daily. Survival curves of mice are shown. Statistical analysis was performed with a log rank (Mantel-Cox) test. (E) Trex1−/− mice (n = 6) were given daily administration (i.p.) of MS-275 (20 mg/kg) or DMSO for 10 days, mRNA levels of ISGs in mouse hearts were analyzed by qPCR. Data are mean ± SEM, unpaired t test. Data represent at least two independent experiments (A–C and E); combined data of at least two independent experiments are shown (D). See also Figure S6.
Figure 7.
Figure 7.. Aspirin Suppresses DNA-Mediated Autoimmunity in Human Patient Cells
(A) Schematic diagram showing the frameshift mutation of TREX1 in the AGS patient (AGS, bottom) in comparison with his healthy brother (Healthy, top). The frameshift mutation (c. 459-460insA, red A in the diagram) results in a premature stop codon (red *) at the position of the 156th amino acid. The dark gray color in the schematic indicates different regions according to Uniprot: Q9NSU2-1. The first region (position 75–76) is described as a substrate-binding region, the second region (position 109–118) is a proline-rich region, and the last region (position 291–369) is necessary for endoplasmic reticulum localization. (B) Immunoblot analysis of TREX1 and cGAS in PBMCs from the healthy brother and the AGS patient; the anti-α-tubulin blot indicates loading of lanes. (C) PBMCs from the healthy brother and the AGS patient were treated with DMSO or aspirin (4 mM) for 2 days. The mRNA levels of ISGs were detected by qPCR. Data are mean ± SEM from triplicates (technical replicates), unpaired t test. Data represent at least two independent experiments (B and C). See also Figure S7.

Comment in

  • Aspirin meets cGAS.
    Elkon KB. Elkon KB. Nat Rev Rheumatol. 2019 May;15(5):254-255. doi: 10.1038/s41584-019-0205-y. Nat Rev Rheumatol. 2019. PMID: 30914774 No abstract available.

References

    1. Ahn J, and Barber GN (2014). Self-DNA, STING-dependent signaling and the origins of autoinflammatory disease. Curr. Opin. Immunol 31, 121–126. - PubMed
    1. Aicardi J, and Goutières F (1984). A progressive familial encephalopathy in infancy with calcifications of the basal ganglia and chronic cerebrospinal fluid lymphocytosis. Ann. Neurol 15, 49–54. - PubMed
    1. An J, Woodward JJ, Sasaki T, Minie M, and Elkon KB (2015). Cutting edge: Antimalarial drugs inhibit IFN-β production through blockade of cyclic GMP-AMP synthase-DNA interaction. J. Immunol 194, 4089–4093. - PubMed
    1. Barbalat R, Ewald SE, Mouchess ML, and Barton GM (2011). Nucleic acid recognition by the innate immune system. Annu. Rev. Immunol 29, 185–214. - PubMed
    1. Bowie A (2012). The STING in the tail for cytosolic DNA-dependent activation of IRF3. Sci. Signal 5, pe9. - PubMed

Publication types

MeSH terms

Supplementary concepts