. 2019 Mar 7;24(3):487-497.e7.
doi: 10.1016/j.stem.2018.12.015. Epub 2019 Feb 21.

hESC-Derived Thalamic Organoids Form Reciprocal Projections When Fused with Cortical Organoids

Affiliations

hESC-Derived Thalamic Organoids Form Reciprocal Projections When Fused with Cortical Organoids

Yangfei Xiang et al. Cell Stem Cell. .

Abstract

Human brain organoid techniques have rapidly advanced to facilitate investigating human brain development and diseases. These efforts have largely focused on generating telencephalon due to its direct relevance in a variety of forebrain disorders. Despite its importance as a relay hub between cortex and peripheral tissues, the investigation of three-dimensional (3D) organoid models for the human thalamus has not been explored. Here, we describe a method to differentiate human embryonic stem cells (hESCs) to thalamic organoids (hThOs) that specifically recapitulate the development of thalamus. Single-cell RNA sequencing revealed a formation of distinct thalamic lineages, which diverge from telencephalic fate. Importantly, we developed a 3D system to create the reciprocal projections between thalamus and cortex by fusing the two distinct region-specific organoids representing the developing thalamus or cortex. Our study provides a platform for understanding human thalamic development and modeling circuit organizations and related disorders in the brain.

Keywords: brain organoid; cortex; corticothalamic; fusion; hESC; single cell RNA-seq; thalamic organoid; thalamocortical; thalamus.


Conflict of interest statement

Declaration of Interests

The authors declare no conflict of interest.

Figures
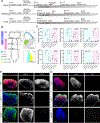
Figure 1.
Figure 1.. Generation of Region-specific Human Brain Organoids
(A) Schematic view of the methods for generating hThOs, hMGEOs, and hCOs. (B) Schematic view of expression patterns of regional markers during thalamus, cortex, and MGE development. (C) qPCR analysis for expressions of regional markers in developing hThOs, hMGEOs, and hCOs. Each data represents expressions in pooled batch of 3 to 4 organoids, and 3 batches were collected for analysis. Mean ± SD is shown. *p<0.05, **p<0.01, ***p<0.001. (D) Immunostaining for MAP2 and thalamic marker TCF7L2 in day 41 hThO, hCO, and hMGEO. The scale bar represents 250 μm. (E) Immunostaining for thalamic and cortical progenitor marker PAX6, and cortical marker TBR1 in day 41 hThO, hCO, and hMGEO. The scale bar represents 250 μm. See also Figure S1.
Figure 2.
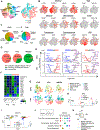
Figure 2.. Single-cell Analysis of Region-specific Brain Organoids
(A) tSNE plot of hThO-derived single cells distinguished by annotations (left) or time point (right). Early stage: day 34; late stage: day 89. (B) Expression pattern of cell-type and brain-region specific markers in hThO-derived cells. Relative expression level is plotted from gray to red colors. (C) Ratio of hThO-derived cells clustered into each annotation. (D) Ratio of excitatory and inhibitory neurons late stage brain organoids. (E) Differential expression analysis between different brain organoids. Representative genes are colored by red (hCO), blue (hMGEO) and purple (hThO). (F) GSEA of region-specific genes in different brain organoids. Normalized enrichment scores (NES) are plotted from blue to green colors. M1C/S1C: primary moter-sensory cortex; PCX: parietal neocortex; OCX: occipital neocortex; URL: upper rhombic lip; DFC: dorsolateral prefrontal cortex; MFC: anterior cingulate cortex; OFC: orbital frontal cortex; AMY: amygdaloid complex; LGE: lateral ganglionic eminence; CGE: candal ganglionic eminence; MGE: medial ganglionic eminence; HIP: hippocampus; DTH: dorsal thalamus. (G) tSNE plot of cells derived from hThOs, hCOs and hMGEOs. Early and late time point data are shown at top and bottom panel, respectively. (H and I) 3D diffusion map of NPCs and neurons from different organoids. Branches (left) and origin of cells (right) are shown by different colors. Note hThO-derived neurons were uniquely clustered in branch NB5. (J) GO enrichment of each branch of neurons derived from different organoids. Branch identities are the same as shown in (I). (K) Enrichment of disease-related genes in each branch. Enrichment and depletion in each branch are shown by −log10(FDR) and log10(FDR), respectively. Branch identities are the same as shown in (I). See also Figure S1.
Figure 3.
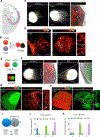
Figure 3.. hThCOs Model Connections Between Thalamus and Cortex
(A) Schematic view of axon connections between thalamus and cortex in the brain. (B) Schematic view showing the generation of hThCOs using mCherry+ hThO and hCO without fluorescence reporter. (C) Epifluorescence images showing TC projections in an intact hThCO. Arrows indicate axon bundles. The scale bar represents 250 μm. (D) 3D confocal imaging revealing TC projections in an intact hThCO near the border of fusion (left panel), and on the hCO side (right panel). Arrows indicate axon bundles. Regions a and b in the right panel are enlarged, and axonal boutons are indicated by arrow heads. The scale bar represents 50 μm. (E) Schematic view showing the generation of hThCOs using mCherry+ hThO and GFP+ hCO. (F) Epifluorescence images showing reciprocal TC and CT projections in an intact hThCO generated from mCherry+ hThO and GFP+ hCO. TC projections are shown in the left panel, and CT projections are shown in the right panel. Arrows indicate axon bundles. The scale bar represents 250 μm. (G and H) 3D confocal imaging revealing TC (G) and CT (H) projections in an intact hThCO generated from mCherry+ hThO and GFP+ hCO. Arrow heads indicate growth cones. The scale bar represents 50 μm. (I) Schematic view of method for quantifying axon targeting. (J and K) Quantifications of range index for TC (J) and CT (K) projections at 1, 2, and 3 days post-fusion (dpf). See also Figure S2 and S3.
Figure 4.
Figure 4.. TC Targeting and Synaptogenesis in hThCOs
(A) Immunostaining for PAX6 and mCherry in hThCO section produced by fusing mCherry+ hThO and mCherry hCO. The hCO side is shown. The scale bar represents 50 μm. (B and C) Immunostaining for mCherry and SYP in hThCO section (B) and enlarged image of region a (C). hThCO was produced by fusing mCherry+ hThO and mCherry hCO. hCO side is shown. Arrows indicate regions enriched with mCherry+ axons. The scale bar represents 100 μm in (B) and 50 μm in (C). (D) Quantification of distribution of mCherry+ axons within and outside of VZ/SVZ-areas in hCOs. Mean ± SD is shown. ***p<0.001. (E) Immunostaining for mCherry and vGLUT2 in hThCO section. hThCO was produced by fusing mCherry+ hThO and mCherry hCO. hCO side is shown. The scale bar represents 25 μm. (F) Quantification of axons expressing mCherry and vGLUT2 in hCOs. Mean ± SD is shown. ***p<0.001 (compared with vGLUT2+/mCherry+ group). (G) Immunostaining for mCherry and MAP2 in hThCO section. hThCO was produced by fusing mCherry+ hThO and mCherry hCO. hCO side is shown. The region outlined by dashed line is further presented on the right. The scale bar represents 50 μm. (H) Immunostaining for mCherry, SYP and PSD95 in hThCO section. hThCO was produced by fusing mCherry+ hThO and mCherry hCO. hCO side was examined for synaptic structures. Arrows indicate presynaptic SYP+ puncta and arrow heads indicate postsynaptic PSD95+ puncta. The scale bar represents 5 μm. See also Figure S4.

References

    1. Andreasen NC (1997). The role of the thalamus in schizophrenia. Can J Psychiatry 42, 27–33. - PubMed
    1. Bagley JA, Reumann D, Bian S, Levi-Strauss J, and Knoblich JA (2017). Fused cerebral organoids model interactions between brain regions. Nat Methods 14, 743–+. - PMC - PubMed
    1. Barch DM, and Ceaser A (2012). Cognition in schizophrenia: core psychological and neural mechanisms. Trends Cogn Sci 16, 27–34. - PMC - PubMed
    1. Birey F, Andersen J, Makinson CD, Islam S, Wei W, Huber N, Fan HC, Metzler KRC, Panagiotakos G, Thom N, et al. (2017). Assembly of functionally integrated human forebrain spheroids. Nature 545, 54–59. - PMC - PubMed
    1. Brown EC, Clark DL, Hassel S, MacQueen G, and Ramasubbu R (2017). Thalamocortical connectivity in major depressive disorder. J Affect Disord 217, 125–131. - PubMed

Publication types