

Referral Decision Making of General Practitioners: A Signal Detection Study
- PMID: 30799690
- PMCID: PMC6311616
- DOI: 10.1177/0272989X18813357
Referral Decision Making of General Practitioners: A Signal Detection Study
Abstract
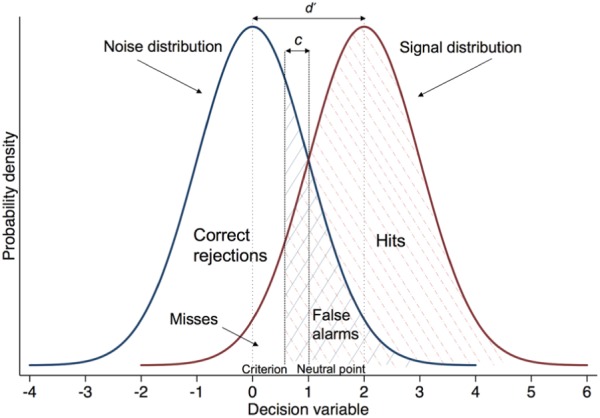
Background: Signal detection theory (SDT) describes how respondents categorize ambiguous stimuli over repeated trials. It measures separately "discrimination" (ability to recognize a signal amid noise) and "criterion" (inclination to respond "signal" v. "noise"). This is important because respondents may produce the same accuracy rate for different reasons. We employed SDT to measure the referral decision making of general practitioners (GPs) in cases of possible lung cancer.
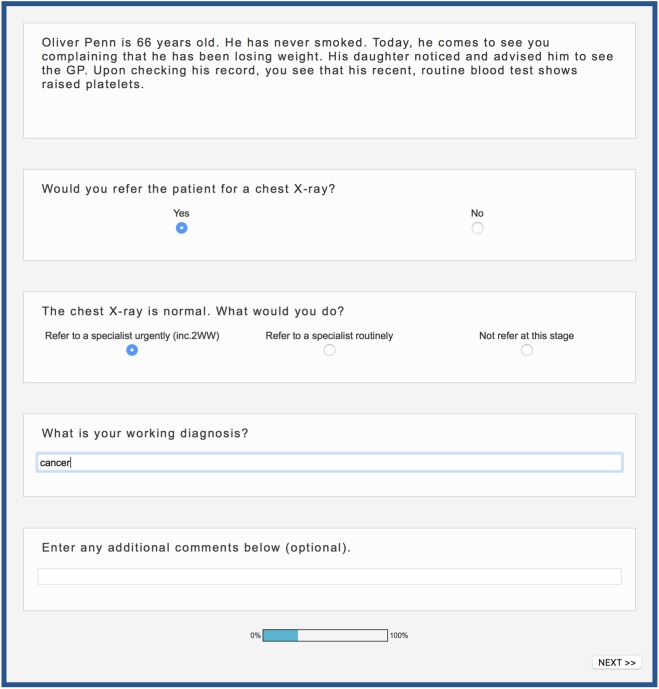
Methods: We constructed 44 vignettes of patients for whom lung cancer could be considered and estimated their 1-year risk. Under UK risk-based guidelines, half of the vignettes required urgent referral. We recruited 216 GPs from practices across England. Practices differed in the positive predictive value (PPV) of their urgent referrals (chance of referrals identifying cancer) and the sensitivity (chance of cancer patients being picked up via urgent referral from their practice). Participants saw the vignettes online and indicated whether they would refer each patient urgently or not. We calculated each GP's discrimination ( d ') and criterion ( c) and regressed these on practice PPV and sensitivity, as well as on GP experience and gender.
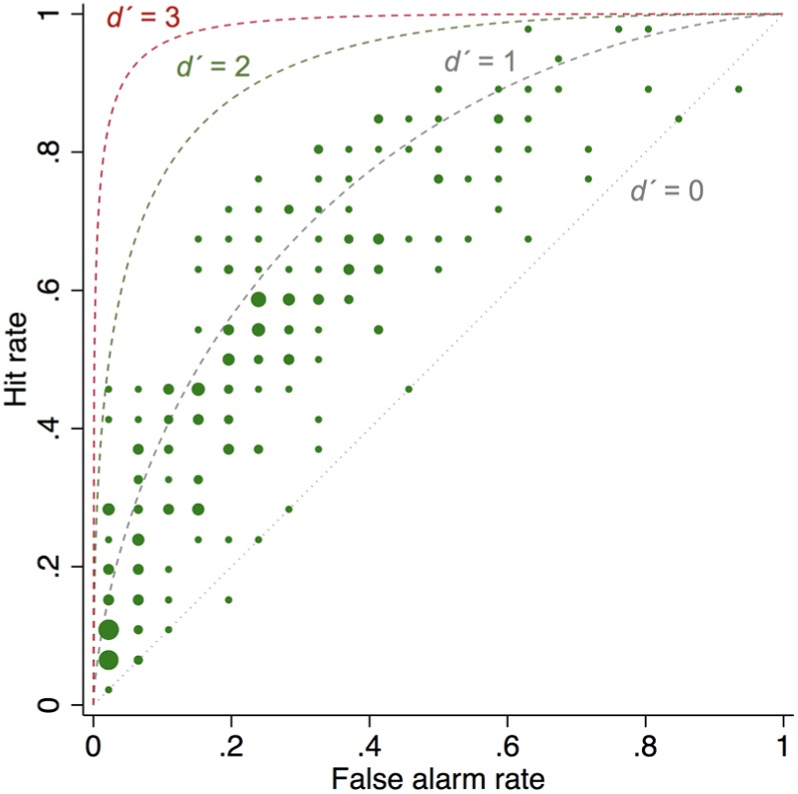
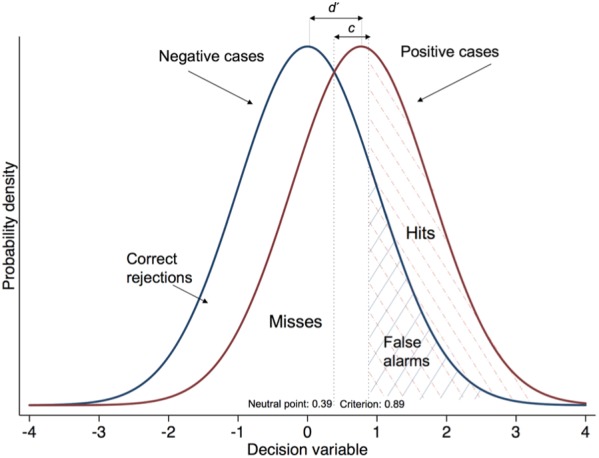
Results: Criterion was associated with practice PPV: as PPV increased, GPs' c also increased, indicating lower inclination to refer ( b = 0.06 [0.02-0.09]; P = 0.001). Female GPs were more inclined to refer than male GPs ( b = -0.20 [-0.40 to -0.001]; P = 0.049). Average discrimination was modest ( d' = 0.77), highly variable (range, -0.28 to 1.91), and not associated with practice referral performance.
Conclusions: High referral PPV at the organizational level indicates GPs' inclination to avoid false positives, not better discrimination. Rather than bluntly mandating increases in practice PPV via more referrals, it is necessary to increase discrimination by improving the evidence base for cancer referral decisions.
Keywords: cancer referral; conversion rate; detection rate; primary care; signal detection theory.
Conflict of interest statement
The author(s) declared no potential conflicts of interest with respect to the research, authorship, and/or publication of this article.
Figures
References
-
- Department of Health. The NHS cancer plan. Dep Health. 2000;(September):1–98.
-
- Macmillan N, Creelman C. Detection Theory: A User’s Guide. 2nd ed. New York: Lawrence Erlbaum; 2005.
-
- Swets JA, Dawes RM, Monahan J. Psychological science can improve diagnostic decisions. Psychol Sci Public Interes. 2000;1(1):1–26. - PubMed
-
- Pastore RE, Crawley EJ, Berens MS, Skelly MA. “Nonparametric” A′ and other modern misconceptions about signal detection theory. Psychon Bull Rev. 2003;10(3):556–9. - PubMed
