. 2019 Jan 16:2019:8148510.
doi: 10.1155/2019/8148510. eCollection 2019.

Curcumin Suppresses Hepatic Stellate Cell-Induced Hepatocarcinoma Angiogenesis and Invasion through Downregulating CTGF

Affiliations

Curcumin Suppresses Hepatic Stellate Cell-Induced Hepatocarcinoma Angiogenesis and Invasion through Downregulating CTGF

Shan Shao et al. Oxid Med Cell Longev. .

Abstract

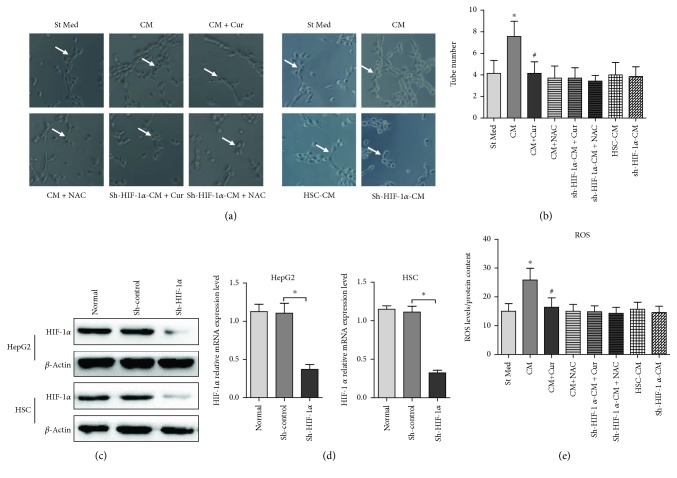
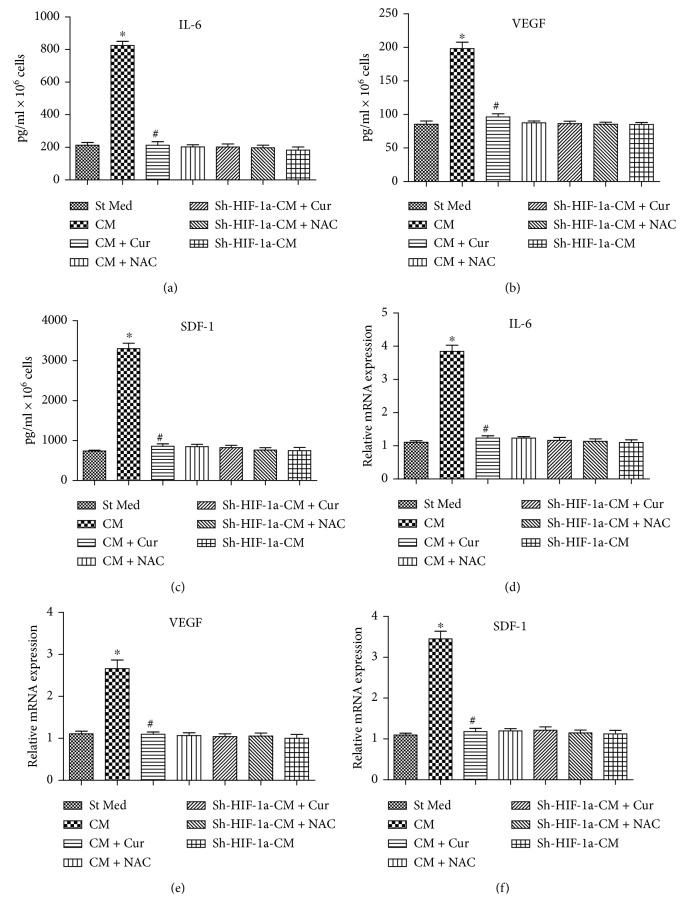
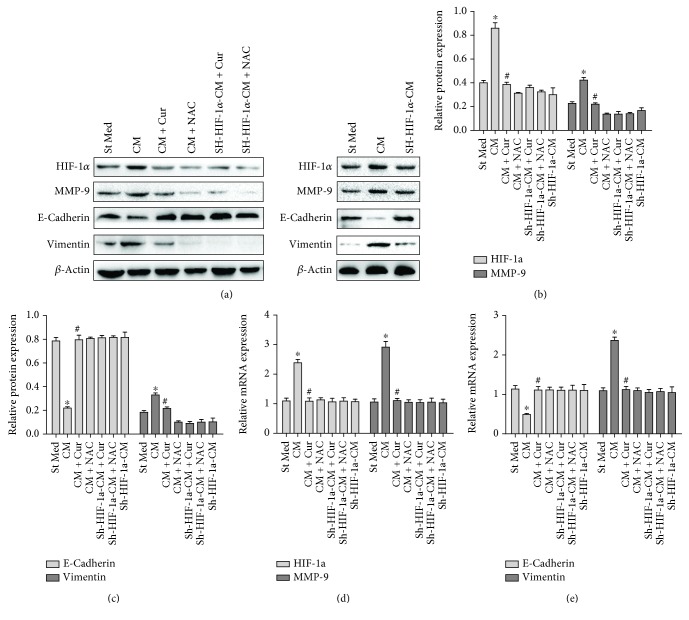
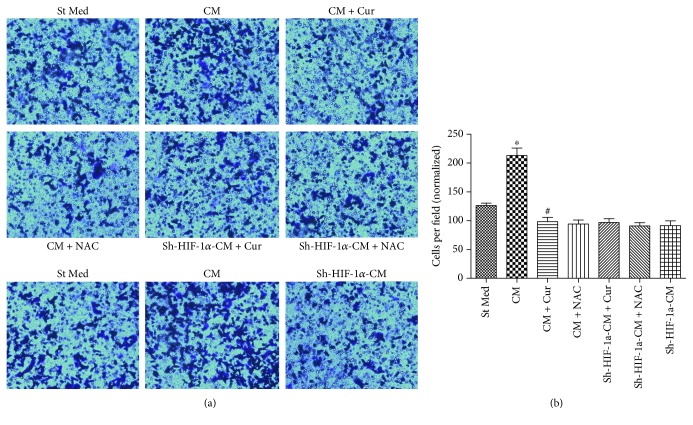
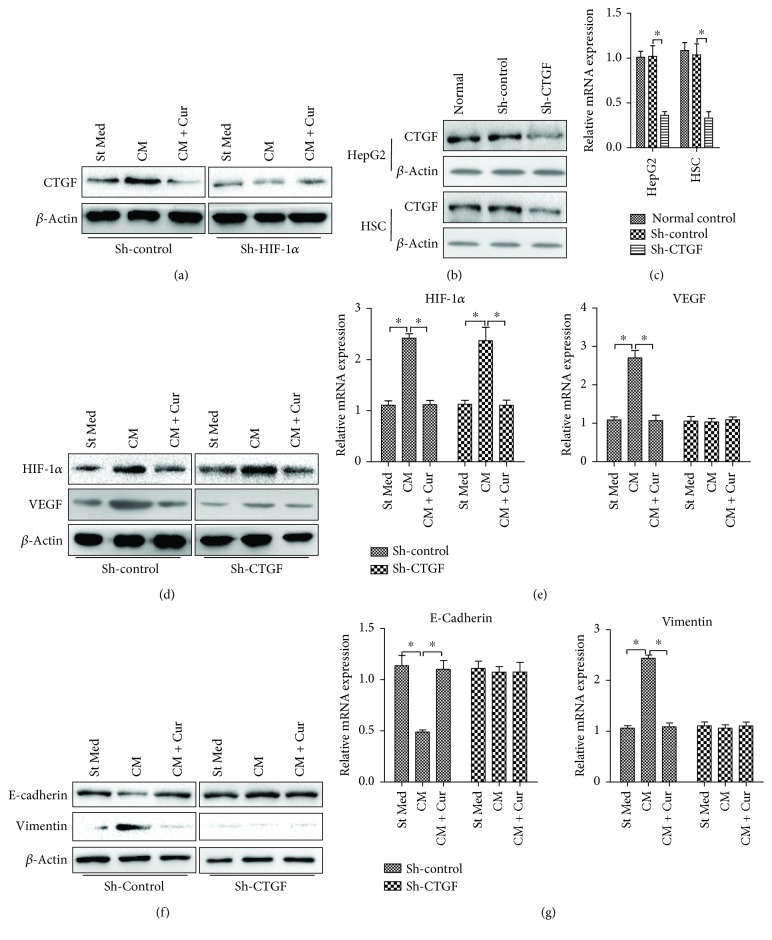
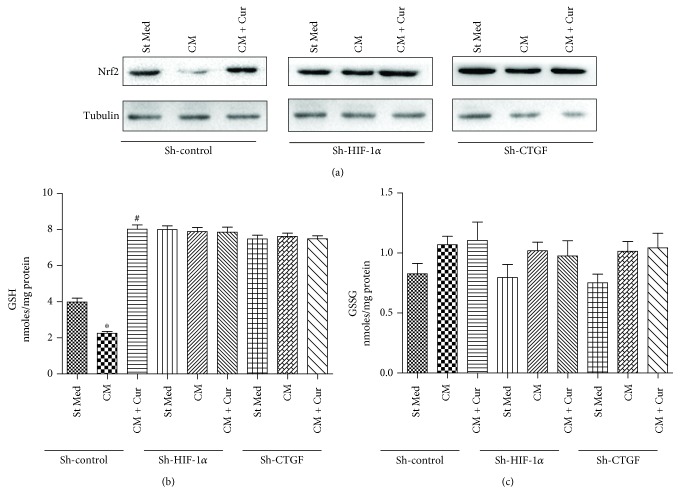
Microenvironment plays a vital role in tumor progression; we focused on elucidating the role of hepatic stellate cells (HSCs) in hepatocarcinoma (HCC) aggressiveness and investigated the potential protective effect of curcumin on HSC-driven hepatocarcinoma angiogenesis and invasion. Our data suggest that HSCs increase HCC reactive oxygen species (ROS) production to upregulate hypoxia-inducible factor-1α (HIF-1α) expression to promote angiogenesis, epithelial to mesenchymal transition (EMT) process and invasion. And HSCs could secrete soluble factors, such as interleukin-6 (IL-6), vascular endothelial cell growth factor (VEGF), and stromal-derived factor-1 (SDF-1) to facilitate HCC progression. Curcumin could significantly suppress the above HSC-induced effects in HCC and could abrogate ROS and HIF-1α expression in HCC. HIF-1α or connective tissue growth factor (CTGF) knockdown could abolish the aforementioned curcumin affection. Moreover, CTGF is a downstream gene of HIF-1α. In addition, nuclear factor E2-related factor 2 (Nrf2) and glutathione (GSH) are involved in curcumin protection of HCC. These data indicate that curcumin may induce ROS scavenging by upregulating Nrf2 and GSH, thus inhibiting HIF-1α stabilization to suppress CTGF expression to exhibit its protection on HCC. Curcumin has a promising therapeutic effect on HCC. CTGF is responsible for curcumin-induced protection in HCC.


Figures

Figure 1
Figure 1
Curcumin inhibits HSC-induced HCC angiogenesis by suppressing HIF-1α. HUVECs were incubated with conditioned medium from the HepG2 (St Med), HepG2 + HSC (CM), HepG2 + HSC + curcumin (CM + Cur), HepG2 + HSC + NAC (CM + NAC), sh-HIF-1α-HepG2 + HSC + curcumin (sh-HIF-1α-CM + Cur), sh-HIF-1α-HepG2 + HSC + NAC (sh-HIF-1α-CM + NAC) groups, HSC only (HSC-CM), and sh-HIF-1α-HepG2 only (sh-HIF-1α-CM). Cur stands for Curcumin. 50 μM Curcumin was added into the medium for 24 h in CM + Cur group or sh-HIF-1α-CM + Cur group. 20 mM NAC was added into the medium for 24 h in CM + NAC group or sh-HIF-1α-CM + NAC group. (a) Angiogenesis was evaluated based on tube formation (indicated by arrows). (b) Tube numbers were counted. p < 0.05 versus St Med group (n = 6), #p < 0.05 versus CM group (n = 6). (c) HIF-1α in HepG2 cells or HSCs was silenced by sh-RNA. HIF-1α and β-actin expression levels were determined by immunoblotting. p < 0.05, sh-control versus sh-HIF-1α, n = 3. (d) HepG2 or HSCs were treated as in (c), and HIF-1α and β-actin expression levels were determined by qRT-PCR. p < 0.05, sh-control versus sh-HIF-1α, n = 3. All data are representative of at least three independent experiments. (e) Hydrogen peroxide production in HepG2 cells was determined using DCF-DA, and total protein content was used to normalize the data. p < 0.05 versus St Med group (n = 6), #p < 0.05 versus CM (n = 6).
Figure 2
Figure 2
Curcumin decreased VEGF, IL-6, and SDF-1 expression in HCC via inhibiting HIF-1α. St Med stands for standard media of PSC cells, CM stands for conditioned media from HepG2 cells, CM + Cur stands for conditioned media from HepG2 cells pretreated with curcumin, CM + NAC stands for conditioned media from HepG2 cells pretreated with NAC, sh-HIF-1α-CM + Cur stands for HSC cell knockdown with sh-HIF-1α and cultured with conditioned media from HepG2 cells pretreated with curcumin, sh-HIF-1α-CM + NAC stands for HSC knockdown with sh-HIF-1α and cultured with conditioned media from HepG2 cells pretreated with NAC, and sh-HIF-1α-CM stands for HSC cell knockdown with sh-HIF-1α and cultured with conditioned media from HepG2 cells. ELISA was assayed to assess IL-6 (a), VEGF (b), and SDF-1 (c) expression in the conditioned medium of the indicated groups. IL-6 (d), VEGF (e), and SDF-1 (f) mRNA expression in HSCs was detected by qRT-PCR, as described in the Materials and Methods. p < 0.05 versus St Med group (n = 6), #p < 0.05 versus CM (n = 6). All data are representative of at least three independent experiments.
Figure 3
Figure 3
Curcumin abrogated HSC-induced increases in HIF-1α, MMP-9 expression and EMT process in HepG2 cells though down-regulating HIF-1α. St Med stands for standard media of HepG2 cells, CM stands for conditioned media from HSCs, CM + Cur stands for conditioned media from HSCs with curcumin exposure, CM + NAC stands for conditioned media from HSCs with NAC exposure, sh-HIF-1α-CM + Cur stands for sh-HIF-1α knockdown HepG2 cells treated with conditioned media from HSCs pretreated with curcumin, sh-HIF-1α-CM + NAC stands for sh-HIF-1α knockdown HepG2 cells treated with conditioned media from HSCs pretreated with NAC, and sh-HIF-1α-CM stands for sh-HIF-1α knockdown HepG2 cells treated with conditioned media from HSCs. (A&B&C) HIF-1α, MMP-9, E-cadherin, vimentin, and β-actin protein expression levels were evaluated by immunoblotting. p < 0.05 versus St Med group (n = 3), #p < 0.05 versus CM group (n = 3). (d, e) HIF-1α, MMP-9, E-cadherin, vimentin, and β-actin mRNA expression levels were determined by qRT-PCR. p < 0.05 versus St Med group (n = 3); #p < 0.05 versus CM (n = 3). All data are representative of at least three independent experiments.
Figure 4
Figure 4
Curcumin suppressed HSC-induced invasion in HepG2 cells through decreasing HIF-1α. St Med stands for standard media of HepG2 cells, CM stands for conditioned media from HSCs, CM + Cur stands for conditioned media from HSCs with curcumin exposure, CM + NAC stands for conditioned media from HSCs with NAC exposure, sh-HIF-1α-CM + Cur stands for sh-HIF-1α knockdown HepG2 cells treated with conditioned media from HSCs pretreated with curcumin, sh-HIF-1α-CM + NAC stands for sh-HIF-1α knockdown HepG2 cells treated with conditioned media from HSCs pretreated with NAC, and sh-HIF-1α-CM stands for sh-HIF-1α knockdown HepG2 cells treated with conditioned media from HSCs. The cells were placed in a Matrigel-coated invasion chamber for 20 h. (a, b) We evaluated invasion ability by counting the numbers of migrated cells in ten randomly selected fields under a light microscope at ×100 magnification. p < 0.05 versus St Med group (n = 6), #p < 0.05 versus CM (n = 6). All data are representative of at least three independent experiments.
Figure 5
Figure 5
CTGF interference abrogates the observed effects of HIF-1α silencing and curcumin on HSC activation and HCC invasion. (a) HepG2 cells were silenced by control shRNA (sh-control) or shRNA targeting HIF-1α (sh-HIF-1α); CTGF protein levels of HepG2 cells were analyzed by western blot. CTGF interference efficiency in HSCs and HepG2 cells were analyzed by western blot (b) and qRT-PCR (c). (d, e) HSCs transfected with shRNA were cultured with or without curcumin for 12 h and serum starved for an additional 24 h. (d) HIF-1α and VEGF protein level of HSCs were analyzed by western blot. (e) HIF-1α and VEGF mRNA level of HSCs were analyzed by qRT-PCR. HepG2 cells transfected with CTGF shRNA were incubated with the conditioned media (CM) from HSCs with or without curcumin for 24 h. The cells were lysed, and E-cadherin and vimentin expression levels were analyzed by western blot (f) and qRT-PCR (g). p < 0.05. All data are representative of at least three independent experiments.
Figure 6
Figure 6
Nrf2 and GSH participate in curcumin-induced HCC protection. (a) HepG2 cells were silenced by control shRNA (sh-control), shRNA targeting HIF-1α (sh-HIF-1α), or shRNA targeting CTGF (sh-CTGF); nuclear Nrf2 protein levels of HepG2 cells were analyzed by western blot. (b) Glutathione (GSH) and glutathione disulfide (GSSG) levels were evaluated in HepG2 cells. p < 0.05 versus St Med group (n = 3), #p < 0.05 versus CM (n = 3). All data are representative of at least three independent experiments.

Similar articles

Cited by

References

    1. Forner A. Hepatocellular carcinoma surveillance with miRNAs. The Lancet Oncology. 2015;16(7):743–745. doi: 10.1016/S1470-2045(15)00014-5. - DOI - PubMed
    1. Abou-Alfa G. K., Venook A. P. The antiangiogenic ceiling in hepatocellular carcinoma: does it exist and has it been reached? The Lancet Oncology. 2013;14(7):e283–e288. doi: 10.1016/S1470-2045(13)70161-X. - DOI - PubMed
    1. Bowyer C., Lewis A. L., Lloyd A. W., Phillips G. J., Macfarlane W. M. Hypoxia as a target for drug combination therapy of liver cancer. Anti-Cancer Drugs. 2017;28(7):771–780. doi: 10.1097/CAD.0000000000000516. - DOI - PMC - PubMed
    1. Forner A., Llovet J. M., Bruix J. Hepatocellular carcinoma. Lancet. 2012;379(9822):1245–1255. doi: 10.1016/S0140-6736(11)61347-0. - DOI - PubMed
    1. Forner A., Reig M., Bruix J. Hepatocellular carcinoma. Lancet. 2018;391(10127):1301–1314. doi: 10.1016/S0140-6736(18)30010-2. - DOI - PubMed

MeSH terms