

Region-segmentation strategy for Bruch's membrane opening detection in spectral domain optical coherence tomography images
- PMID: 30800497
- PMCID: PMC6377878
- DOI: 10.1364/BOE.10.000526
Region-segmentation strategy for Bruch's membrane opening detection in spectral domain optical coherence tomography images
Abstract
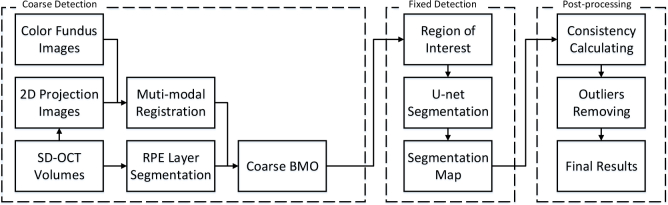
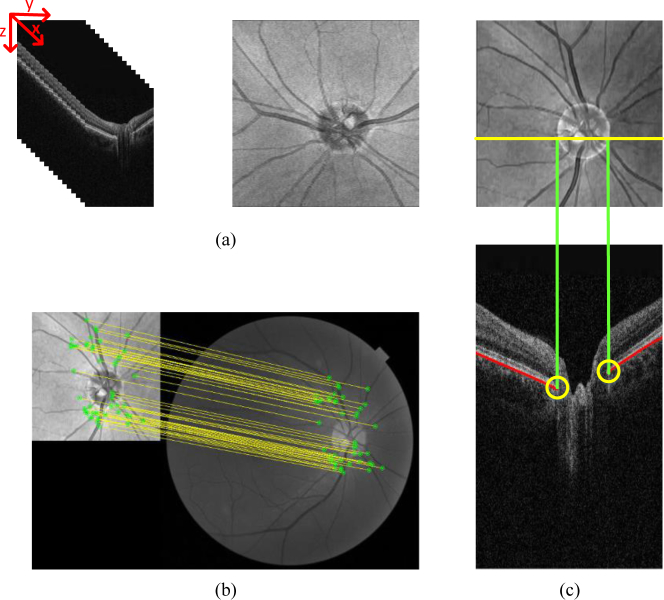
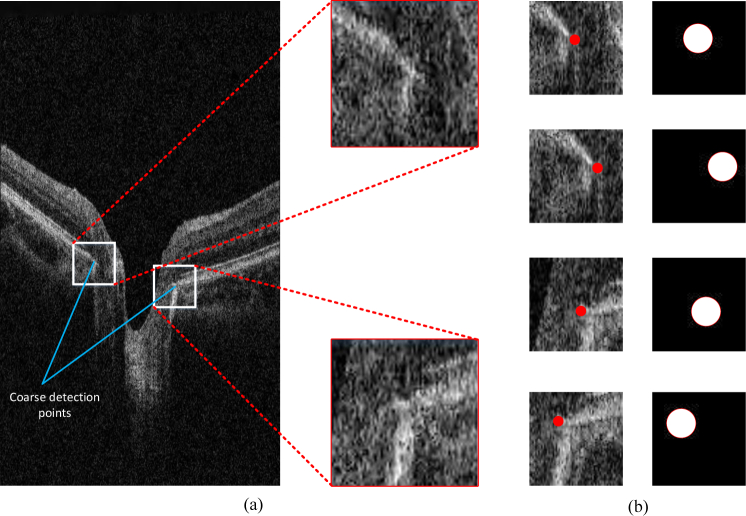
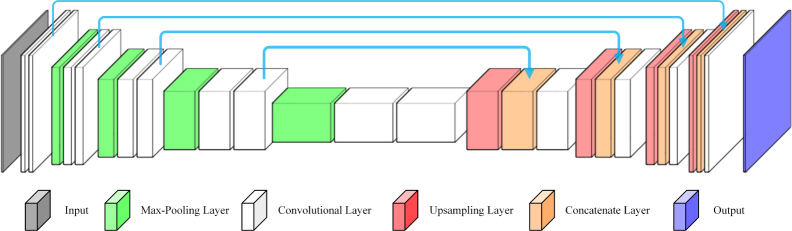
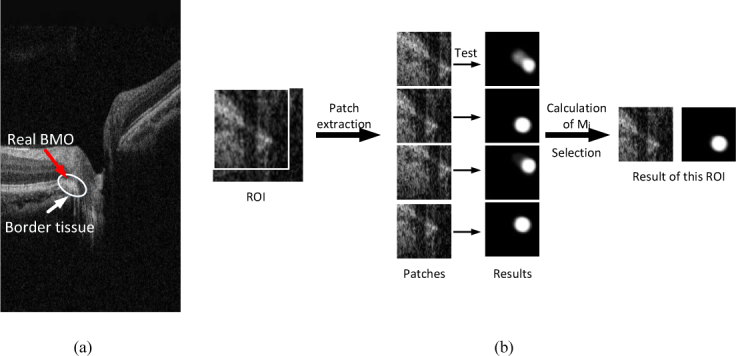
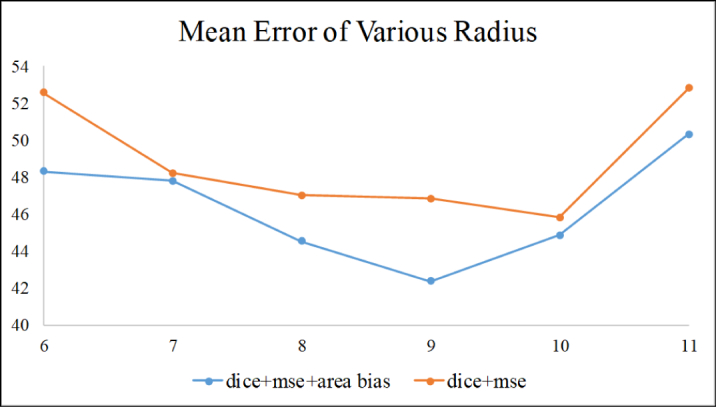
Bruch's membrane opening (BMO) is an important biomarker in the progression of glaucoma. Bruch's membrane opening minimum rim width (BMO-MRW), cup-to-disc ratio in spectral domain optical coherence tomography (SD-OCT) and lamina cribrosa depth based on BMO are important measurable parameters for glaucoma diagnosis. The accuracy of measuring these parameters is significantly affected by BMO detection. In this paper, we propose a method for automatically detecting BMO in SD-OCT volumes accurately to reduce the impact of the border tissue and vessel shadows. The method includes three stages: a coarse detection stage composed by retinal pigment epithelium layer segmentation, optic disc segmentation, and multi-modal registration; a fixed detection stage based on the U-net in which BMO detection is transformed into a region segmentation problem and an area bias component is proposed in the loss function; and a post-processing stage based on the consistency of results to remove outliers. Experimental results show that the proposed method outperforms previous methods and achieves a mean error of 42.38 μm.
Conflict of interest statement
The authors declare that there are no conflicts of interest related to this article.
Figures
Similar articles
-
Novel Bruch's Membrane Opening Minimum Rim Area Equalizes Disc Size Dependency and Offers High Diagnostic Power for Glaucoma.Invest Ophthalmol Vis Sci. 2016 Dec 1;57(15):6596-6603. doi: 10.1167/iovs.16-20561. Invest Ophthalmol Vis Sci. 2016. PMID: 27951592
-
A machine-learning graph-based approach for 3D segmentation of Bruch's membrane opening from glaucomatous SD-OCT volumes.Med Image Anal. 2017 Jul;39:206-217. doi: 10.1016/j.media.2017.04.007. Epub 2017 May 6. Med Image Anal. 2017. PMID: 28528295 Free PMC article.
-
Bruch's Membrane Opening Minimum Rim Width Measurement with SD-OCT: A Method to Correct for the Opening Size of Bruch's Membrane.J Ophthalmol. 2017;2017:8963267. doi: 10.1155/2017/8963267. Epub 2017 Oct 2. J Ophthalmol. 2017. PMID: 29119022 Free PMC article.
-
Parameters of ocular fundus on spectral-domain optical coherence tomography for glaucoma diagnosis.Int J Ophthalmol. 2017 Jun 18;10(6):982-991. doi: 10.18240/ijo.2017.06.23. eCollection 2017. Int J Ophthalmol. 2017. PMID: 28730092 Free PMC article. Review.
-
Strategies to improve early diagnosis in glaucoma.Prog Brain Res. 2015;221:103-33. doi: 10.1016/bs.pbr.2015.03.001. Epub 2015 Jul 7. Prog Brain Res. 2015. PMID: 26518075 Review.
Cited by
-
Automatic Quantification of Anterior Lamina Cribrosa Structures in Optical Coherence Tomography Using a Two-Stage CNN Framework.Sensors (Basel). 2021 Aug 9;21(16):5383. doi: 10.3390/s21165383. Sensors (Basel). 2021. PMID: 34450823 Free PMC article.
-
[Retinal OCT biomarkers and neurodegenerative diseases of the central nervous system beyond Alzheimer's disease].Ophthalmologie. 2024 Feb;121(2):93-104. doi: 10.1007/s00347-023-01974-7. Epub 2024 Jan 23. Ophthalmologie. 2024. PMID: 38263475 Review. German.
References
-
- Yousefi S., Goldbaum M. H., Balasubramanian M., Jung T., Weinreb R. N., Medeiros F. A., Zangwill L. M., Liebmann J. M., Girkin C. A., Bowd C., “Glaucoma progression detection using structural retinal nerve fiber layer measurements and functional visual field points,” IEEE Transactions on Biomed. Eng. 61, 1143–1154 (2014).10.1109/TBME.2013.2295605 - DOI - PMC - PubMed
-
- Mwanza J.-C., Chang R. T., Budenz D. L., Durbin M. K., Gendy M. G., Shi W., Feuer W. J., “Reproducibility of peripapillary retinal nerve fiber layer thickness and optic nerve head parameters measured with cirrus hd-oct in glaucomatous eyes,” Investig. Ophthalmol. & Vis. Sci. 51, 5724 (2010).10.1167/iovs.10-5222 - DOI - PMC - PubMed
-
- Belghith A., Bowd C., Medeiros F. A., Hammel N., Yang Z., Weinreb R. N., Zangwill L. M., “Does the location of bruch’s membrane opening change over time? longitudinal analysis using san diego automated layer segmentation algorithm (salsa),” Investig. Ophthalmol. & Vis. Sci. 57, 675 (2016).10.1167/iovs.15-17671 - DOI - PMC - PubMed
LinkOut - more resources
Full Text Sources