. 2019 Jan 22;10(2):694-706.
doi: 10.1364/BOE.10.000694. eCollection 2019 Feb 1.

Simultaneous dual-band line-field confocal optical coherence tomography: application to skin imaging

Affiliations

Simultaneous dual-band line-field confocal optical coherence tomography: application to skin imaging

Arthur Davis et al. Biomed Opt Express. .

Abstract

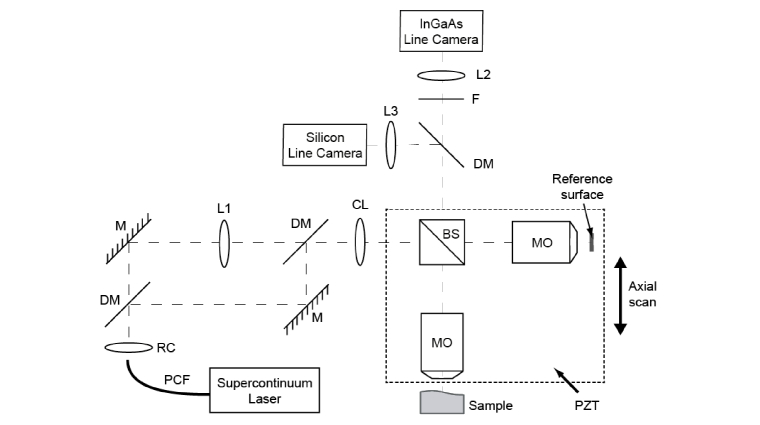
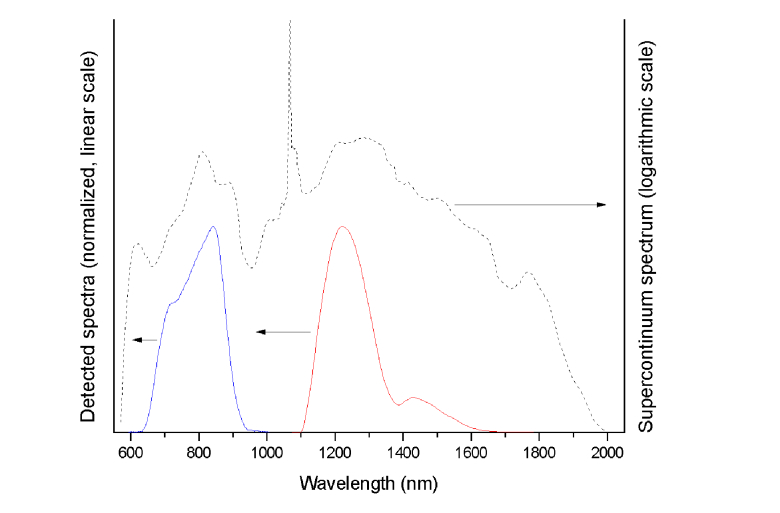
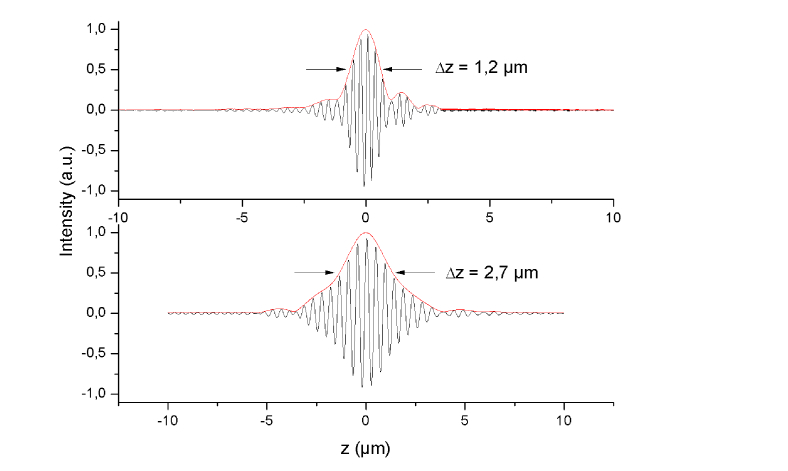
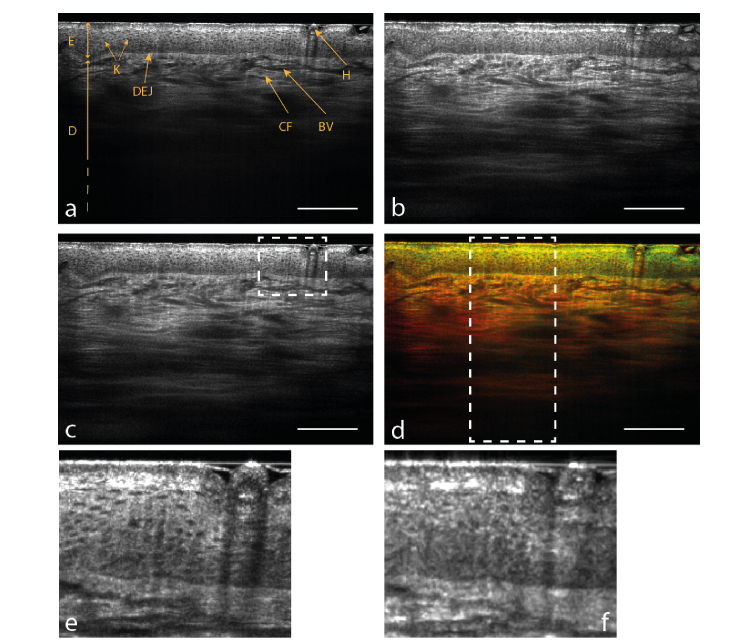
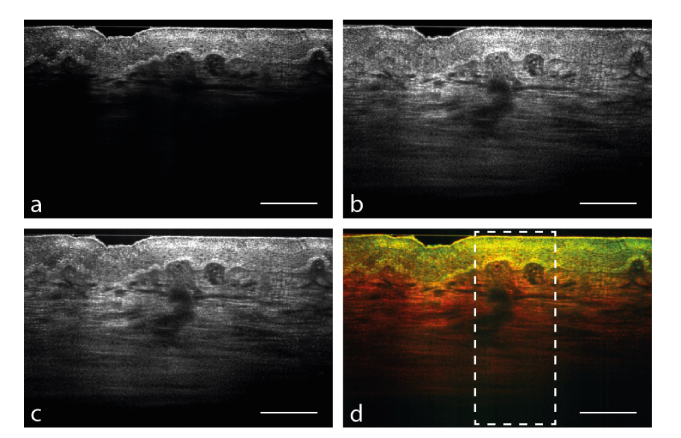
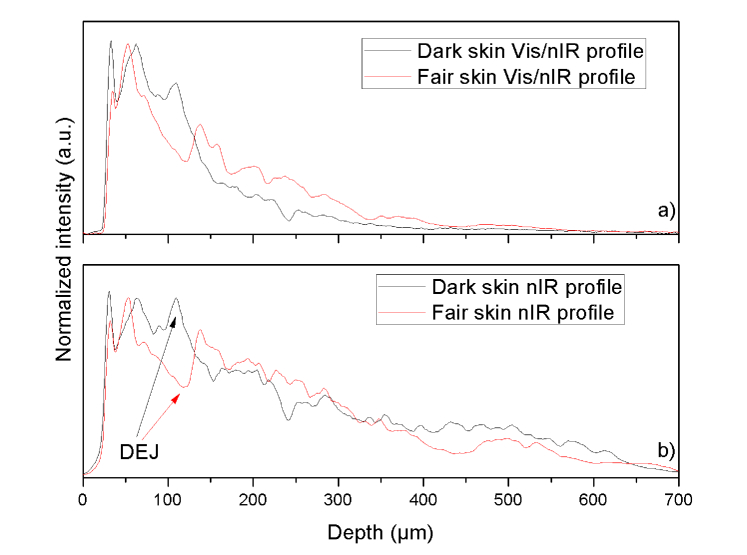
Line-field confocal optical coherence tomography (LC-OCT) operating in two distinct spectral bands centered at 770 nm and 1250 nm is reported, using a single supercontinuum light source and two different line-scan cameras. B-scans are acquired simultaneously in the two bands at 4 frames per second. Greyscale representation and color fusion of the images are performed to either produce a single image with both high resolution (1.3 µm × 1.2 µm, lateral × axial, measured at the surface) in the superficial part of the image and deep penetration, or to highlight the spectroscopic properties of the sample. In vivo images of fair and dark skin are presented with a penetration depth of ∼700 µm.


Conflict of interest statement

The authors declare that there are no conflicts of interest related to this article.

Figures

Fig. 1
Fig. 1
Schematic of the dual-band LC-OCT device. PCF: Photonic-crystal fiber; RC: reflective collimator; DM: long-pass (950 nm) dichroic mirror; F: long-pass filter; M: mirror; L1: adjustable focal length optical system; CL: cylindrical lens; BS: cube beam splitter; MO: microscope objective; PZT: piezo-electric linear stage; L2, L3: tube lenses.
Fig. 2
Fig. 2
Measured spectra of the Vis/nIR (solid blue line) and nIR bands (solid red line), derived by Fourier transform of the interference patterns shown in Fig. 3. The emission spectrum of the supercontinuum laser source (dashed black line) presents a high peak at 1064 nm.
Fig. 3
Fig. 3
Interference patterns measured from a glass/air interface in the VIS/nIR band (a) and the nIR band (b).
Fig. 4
Fig. 4
Simultaneous in vivo B-scans of skin on the back of the hand in the Vis/nIR band centered at 770 nm (a) and in the nIR band centered at 1250 nm (b). (c) is the compounded image from (a) and (b). (d) is the color image where (a) is assigned to the green channel and (b) to the red channel. (e) and (f) are magnified images from (a) and (b) respectively, corresponding to the region in the dashed frame drawn in (c). Scale bar: 200 µm.
Fig. 5
Fig. 5
Images of dark skin (phototype VI). The Vis/nIR band (a) is strongly absorbed by the melanin whereas the IR band (b) penetrates into the dermis. The compounded image (c) can display a high resolution in the epidermis and penetration in the dermis at the same time. The color image (d) clearly differentiates the epidermis from the dermis. Scale bar: 200 µm.
Fig. 6
Fig. 6
Intensity depth profiles from images presented in Fig. 4 and Fig. 5(a,b) compare the depth penetrations in dark skin and fair skin for the Vis/nIR band and the nIR band respectively. The position of the DEJ (dermal-epidermal junction) is easily detectable because of the peaks due to the presence of melanin in dark skin (black arrow) and the hollows in fair skin (red arrow) occurring at a depth of approximately 100 µm. The profile for dark skin in (a) drops sharply after the DEJ reducing effectively the depth penetration compared to fair skin. In (b), if a drop is noticeable after the DEJ, the depth penetration is similar to fair skin nonetheless. The scale for the intensity is the same as the one used to display the images.

References

    1. Huang D., Swanson E. A., Lin C. P., Schuman J. S., Stinson W. G., Chang W., Hee M. R., Flotte T., Gregory K., Puliafito C. A., Fujimoto J. G., “Optical coherence tomography,” Science 254(5035), 1178–1181 (1991).10.1126/science.1957169 - DOI - PMC - PubMed
    1. Zysk A. M., Nguyen F. T., Oldenburg A. L., Marks D. L., Boppart S. A., “Optical coherence tomography: a review of clinical development from bench to bedside,” J. Biomed. Opt. 12(5), 051403 (2007).10.1117/1.2793736 - DOI - PubMed
    1. Schuman J. S., Puliafito C. A., Fujimoto J. G., Duker J. S., Optical Coherence Tomography of Ocular Diseases, 3rd ed. (Slack Inc., 2013).
    1. Bezerra H. G., Costa M. A., Guagliumi G., Rollins A. M., Simon D. I., “Intracoronary optical coherence tomography: A Comprehensive Review clinical and research applications,” JACC Cardiovasc. Interv. 2(11), 1035–1046 (2009).10.1016/j.jcin.2009.06.019 - DOI - PMC - PubMed
    1. Adler D. C., Chen Y., Huber R., Schmitt J., Connolly J., Fujimoto J. G., “Three-dimensional endomicroscopy using optical coherence tomography,” Nat. Photonics 1(12), 709–716 (2007).10.1038/nphoton.2007.228 - DOI

LinkOut - more resources