

Tissue effects of intra-tissue refractive index shaping (IRIS): insights from two-photon autofluorescence and second harmonic generation microscopy
- PMID: 30800519
- PMCID: PMC6377903
- DOI: 10.1364/BOE.10.000855
Tissue effects of intra-tissue refractive index shaping (IRIS): insights from two-photon autofluorescence and second harmonic generation microscopy
Abstract
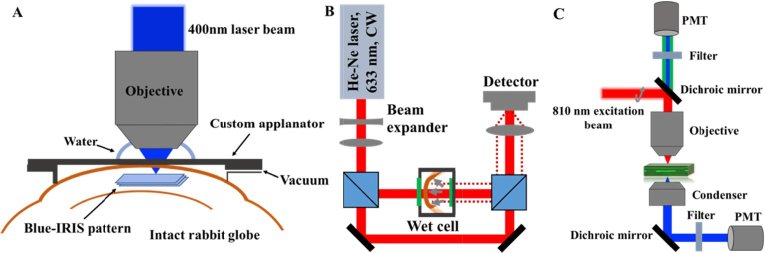
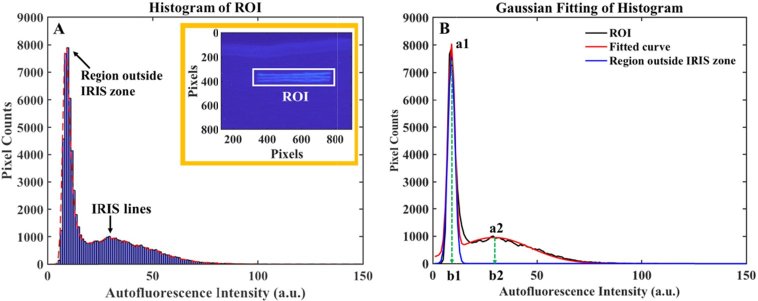
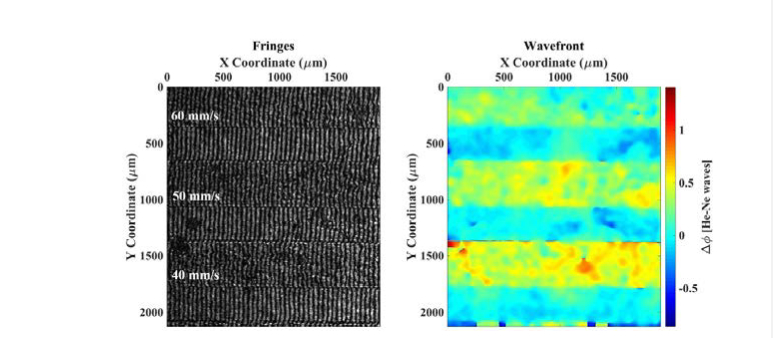
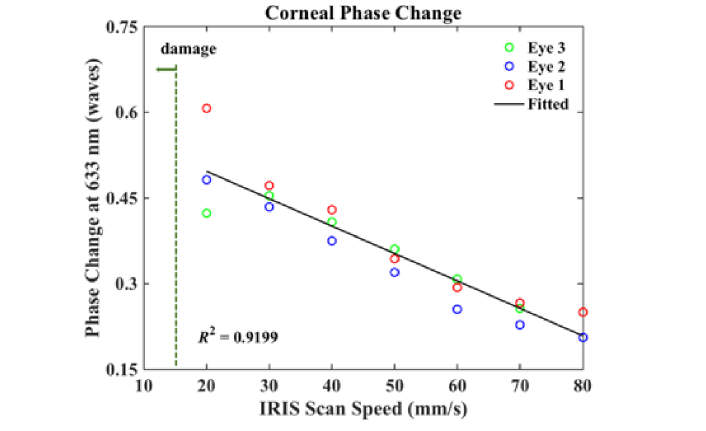
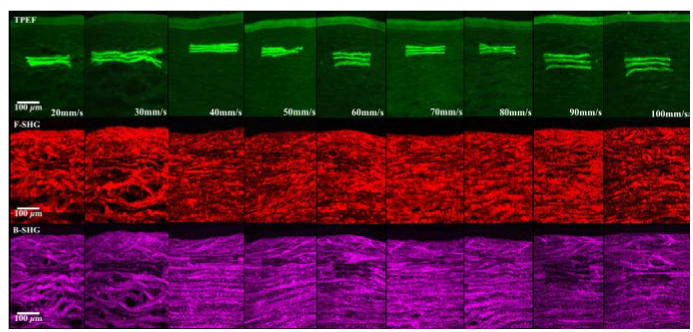
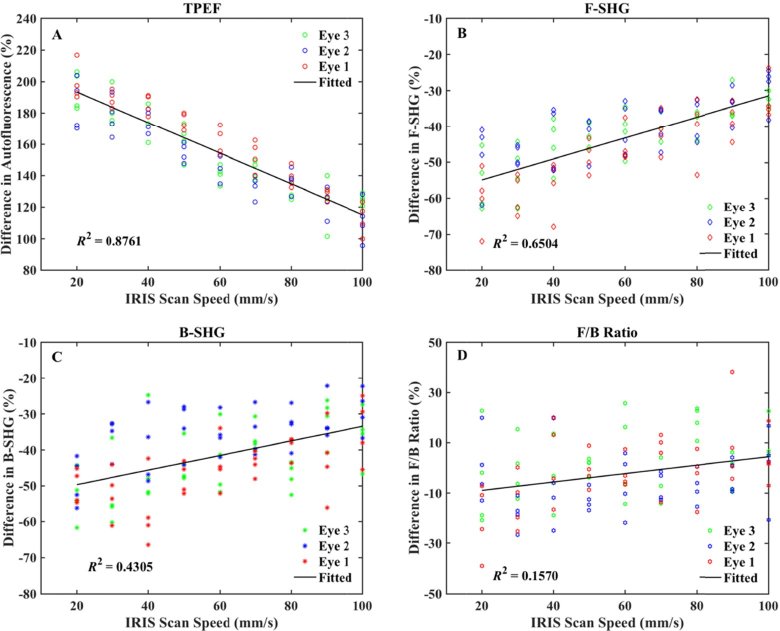
Intra-tissue refractive index shaping (IRIS) is a novel, non-ablative form of vision correction by which femtosecond laser pulses are tightly focused into ocular tissues to induce localized refractive index (RI) change via nonlinear absorption. Here, we examined the effects of Blue-IRIS on corneal microstructure to gain insights into underlying mechanisms. Three-layer grating patterns were inscribed with IRIS ~180 µm below the epithelial surface of ex vivo rabbit globes using a 400 nm femtosecond laser. Keeping laser power constant at 82 mW in the focal volume, multiple patterns were written at different scan speeds. The largest RI change induced in this study was + 0.011 at 20 mm/s. After measuring the phase change profile of each inscribed pattern, two-photon excited autofluorescence (TPEF) and second harmonic generation (SHG) microscopy were used to quantify changes in stromal structure. While TPEF increased significantly with induced RI change, there was a noticeable suppression of SHG signal in IRIS treated regions. We posit that enhancement of TPEF was due to the formation of new fluorophores, while decreases in SHG were most likely due to degradation of collagen triple helices. All in all, the changes observed suggest that IRIS works by inducing a localized, photochemical change in collagen structure.
Conflict of interest statement
Wayne H. Knox: Clerio Vision, Inc. (F, I, C, P, R), Krystel R. Huxlin: Clerio Vision, Inc. (F, I, P).
Figures
Similar articles
-
Noninvasive intratissue refractive index shaping (IRIS) of the cornea with blue femtosecond laser light.Invest Ophthalmol Vis Sci. 2011 Oct 17;52(11):8148-55. doi: 10.1167/iovs.11-7323. Invest Ophthalmol Vis Sci. 2011. PMID: 21931133 Free PMC article.
-
Contrasting cellular damage after Blue-IRIS and Femto-LASIK in cat cornea.Exp Eye Res. 2017 Dec;165:20-28. doi: 10.1016/j.exer.2017.08.018. Epub 2017 Aug 31. Exp Eye Res. 2017. PMID: 28866013 Free PMC article.
-
Spectral characteristics of autofluorescence and second harmonic generation from ex vivo human skin induced by femtosecond laser and visible lasers.Scanning. 2006 Nov-Dec;28(6):319-26. doi: 10.1002/sca.4950280604. Scanning. 2006. PMID: 17181133
-
Examination of Collagen Structure and State by the Second Harmonic Generation Microscopy.Biochemistry (Mosc). 2019 Jan;84(Suppl 1):S89-S107. doi: 10.1134/S0006297919140062. Biochemistry (Mosc). 2019. PMID: 31213197 Review.
-
[Second- and third-harmonic generation microscopies for the structural imaging of intact tissues].Med Sci (Paris). 2006 Oct;22(10):845-50. doi: 10.1051/medsci/20062210845. Med Sci (Paris). 2006. PMID: 17026938 Review. French.
Cited by
-
Dissection of DNA damage and repair pathways in live cells by femtosecond laser microirradiation and free-electron modeling.Proc Natl Acad Sci U S A. 2023 Jun 20;120(25):e2220132120. doi: 10.1073/pnas.2220132120. Epub 2023 Jun 12. Proc Natl Acad Sci U S A. 2023. PMID: 37307476 Free PMC article.
-
Blue-LIRIC in the rabbit cornea: efficacy, tissue effects, and repetition rate scaling.Biomed Opt Express. 2022 Mar 22;13(4):2346-2363. doi: 10.1364/BOE.448286. eCollection 2022 Apr 1. Biomed Opt Express. 2022. PMID: 35519279 Free PMC article.
-
Multiphoton scaling of femtosecond laser-induced refractive index change (LIRIC) in hydrogels and rabbit cornea.Biomed Opt Express. 2024 Oct 8;15(11):6242-6258. doi: 10.1364/BOE.537705. eCollection 2024 Nov 1. Biomed Opt Express. 2024. PMID: 39553877 Free PMC article.
-
Nonlinear optical crosslinking (NLO CXL) for correcting refractive errors.Exp Eye Res. 2020 Oct;199:108199. doi: 10.1016/j.exer.2020.108199. Epub 2020 Aug 23. Exp Eye Res. 2020. PMID: 32846150 Free PMC article. Review.
-
Temporal evolution of the biological response to laser-induced refractive index change (LIRIC) in rabbit corneas.Exp Eye Res. 2021 Jun;207:108579. doi: 10.1016/j.exer.2021.108579. Epub 2021 Apr 20. Exp Eye Res. 2021. PMID: 33864783 Free PMC article.
References
-
- Ding L., Cancado L. G., Novotny L., Knox W. H., Anderson N., Jani D., Linhardt J., Blackwell R. I., Kiinzler J. E., “Micro-Raman spectroscopy of refractive index microstructures in silicone-based hydrogel polymers created by high-repetition-rate femtosecond laser micromachining,” J. Opt. Soc. Am. B 26(4), 595–602 (2009).10.1364/JOSAB.26.000595 - DOI
Grants and funding
LinkOut - more resources
Full Text Sources