

Plasma Profiles of Inflammatory Markers Associated With Active Tuberculosis in Antiretroviral Therapy-Naive Human Immunodeficiency Virus-Positive Individuals
- PMID: 30800697
- PMCID: PMC6379652
- DOI: 10.1093/ofid/ofz015
Plasma Profiles of Inflammatory Markers Associated With Active Tuberculosis in Antiretroviral Therapy-Naive Human Immunodeficiency Virus-Positive Individuals
Abstract
Background: Diagnosis of tuberculosis (TB) in human immunodeficiency virus (HIV)-coinfected individuals is challenging. We hypothesized that combinations of inflammatory markers could facilitate identification of active TB in HIV-positive individuals.
Methods: Participants were HIV-positive, treatment-naive adults systematically investigated for TB at Ethiopian health centers. Plasma samples from 130 subjects with TB (HIV+/TB+) and 130 subjects without TB (HIV+/TB-) were tested for concentration of the following markers: CCL5, C-reactive protein (CRP), interleukin (IL)-6, IL12-p70, IL-18, IL-27, interferon-γ-induced protein-10 (IP-10), procalcitonin (PCT), and soluble urokinase-type plasminogen activator receptor (suPAR). Analyzed markers were then assessed, either individually or in combination, with regard to infection status, CD4 cell count, and HIV ribonucleic acid (RNA) levels.
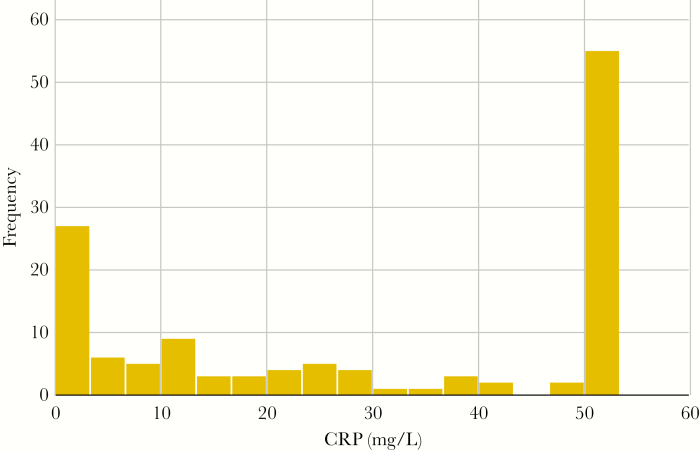
Results: The HIV+/TB+ subjects had higher levels of all markers, except IL12p70, compared with HIV+/TB- subjects. The CRP showed the best performance for TB identification (median 27.9 vs 1.8 mg/L for HIV+/TB+ and HIV+/TB-, respectively; area under the curve [AUC]: 0.80). Performance was increased when CRP was combined with suPAR analysis (AUC, 0.83 [0.93 for subjects with CD4 cell count <200 cells/mm3]). Irrespective of TB status, IP-10 concentrations correlated with HIV RNA levels, and both IP-10 and IL-18 were inversely correlated to CD4 cell counts.
Conclusions: Although CRP showed the best single marker discriminatory potential, combining CRP and suPAR analyses increased performance for TB identification.
Keywords: CRP; HIV; Mycobacterium tuberculosis; biomarker; sub-Saharan Africa.
Figures


References
-
- World Heath Organization. Global tuberculosis report 2018. Available at: https://www.who.int/tb/publications/global_report/en/ Accessed 31 January 2019.
-
- UNAIDS. Global HIV & AIDS statistics — 2018 fact sheet. Available at: http://www.unaids.org/en/resources/fact-sheet Accessed 31 January 2019.
-
- Cox JA, Lukande RL, Lucas S, et al. . Autopsy causes of death in HIV-positive individuals in sub-Saharan Africa and correlation with clinical diagnoses. AIDS Rev 2010; 12:183–94. - PubMed
LinkOut - more resources
Full Text Sources
Research Materials
Miscellaneous
