. 2019 Feb 20;5(2):eaav2437.
doi: 10.1126/sciadv.aav2437. eCollection 2019 Feb.

Targeting DDR2 enhances tumor response to anti-PD-1 immunotherapy

Affiliations

Targeting DDR2 enhances tumor response to anti-PD-1 immunotherapy

Megan M Tu et al. Sci Adv. .

Abstract

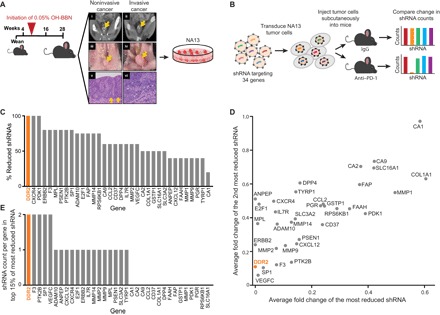
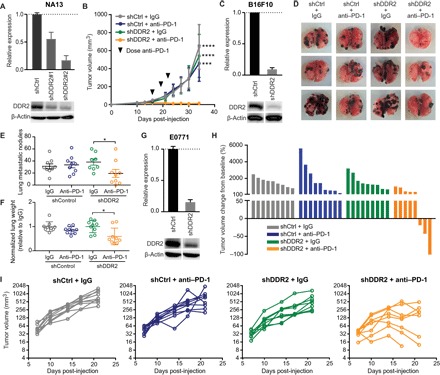
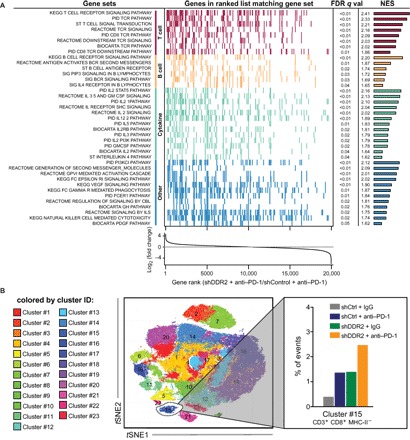
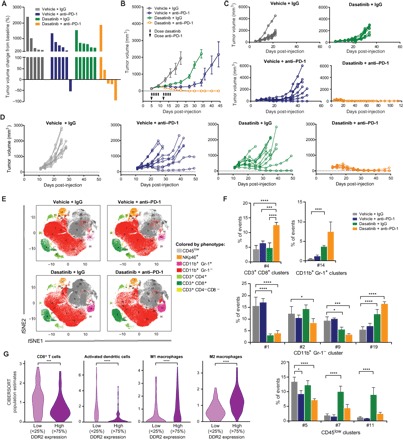
While a fraction of cancer patients treated with anti-PD-1 show durable therapeutic responses, most remain unresponsive, highlighting the need to better understand and improve these therapies. Using an in vivo screening approach with a customized shRNA pooled library, we identified DDR2 as a leading target for the enhancement of response to anti-PD-1 immunotherapy. Using isogenic in vivo murine models across five different tumor histologies-bladder, breast, colon, sarcoma, and melanoma-we show that DDR2 depletion increases sensitivity to anti-PD-1 treatment compared to monotherapy. Combination treatment of tumor-bearing mice with anti-PD-1 and dasatinib, a tyrosine kinase inhibitor of DDR2, led to tumor load reduction. RNA-seq and CyTOF analysis revealed higher CD8+ T cell populations in tumors with DDR2 depletion and those treated with dasatinib when either was combined with anti-PD-1 treatment. Our work provides strong scientific rationale for targeting DDR2 in combination with PD-1 inhibitors.


Figures

Fig. 1
Fig. 1. Identification of genes whose depletion enhances anti–PD-1 efficacy.
(A) Schematic of how the NA13 cell line was derived. C57BL/6 mice were started on BBN approximately 5 weeks after weaning. Corresponding contrast-enhanced microcomputed tomography scans, necropsy images, and histological preparations collected at 28 weeks. Arrows represent bladder wall in (i) to (iv) and basement membrane in (v). L, lumen of bladder. Images (i), (iii), and (v) are of a non–muscle-invasive bladder tumor, while (ii), (iv), and (vi) are of a muscle-invasive tumor. Tumors were excised and adapted to in vitro cell culture. The NA13 cell line was derived from an invasive tumor and used in our experimental studies. (B) Use of lentiviral pool containing the 34-gene druggable shRNA library to identify genes that, when knocked down, confer enhanced response with anti–PD-1 immunotherapy. (C) Ranking of genes based on the proportion of their reduction in cognate shRNAs relative to the total shRNAs per gene. (D) Normalized fold change of the most reduced shRNA versus the second most reduced shRNA (8). (E) Number of shRNAs targeting each gene that are found in the top 15% of the most reduced shRNAs overall (8).
Fig. 2
Fig. 2. In vivo evaluation of the therapeutic efficacy of targeting DDR2 combined with anti–PD-1 immunotherapy.
(A) Immunoblot of NA13 cells transduced with two different DDR2 shRNAs, with graph showing densitometric analysis of DDR2 protein levels. (B) Subcutaneous tumor growth in syngeneic mice receiving NA13 shDDR2 #1 cells stably expressing shControl (shCtrl) or shDDR2 (n = 4 to 5 mice per group). Mean ± SEM. ***P < 0.001, ****P < 0.0001. (C) Immunoblot of B16F10 cells with shControl or shDDR2 construct. (D) Representative images of murine pulmonary lung metastases at 22 days following intravenous (tail vein) inoculation of B16F10 cells. (E) Quantification of the number of metastatic B16F10 lung nodules (n = 9 mice per group). Mean ± SEM. *P < 0.05. (F) Lung weight of mice bearing B16F10 lung metastases (n = 9 mice per group). Mean ± SEM. *P < 0.05. (G) Immunoblot of E0771 cells with shControl or shDDR2 construct. (H) Waterfall plot showing change in E0771 mammary fat pad tumor volume compared to baseline before treatment. (I) E0771 mammary tumor volume as a function of time for each mouse. n = 8 to 9 mice per group.
Fig. 3
Fig. 3. Transcriptomic and CyTOF analysis of tumors.
(A) RNA-seq analysis was performed comparing shControl and shDDR2 NA13 tumors grown in syngeneic mice treated with anti–PD-1. Summarized GSEA results for significantly [false discovery rate (FDR) < 0.01] up-regulated, immune-related gene sets from the canonical pathways v6.1 gene set collection (21). Gene sets are grouped and colored according to primary function. The colored tick marks represent a gene for a given gene set. Genes are ranked according to differential expression of the RNA-seq data. FDR-corrected q values and normalized enrichment scores (NES) are reported for gene set. (B) PhenoGraph-defined cellular distribution and clustering, as defined by tSNE1 (t-distributed stochastic neighbor embedding 1) and tSNE2, colored by cluster ID for all treatment conditions. The frequency of cluster #15 (defined as CD3+ CD8+ MHCII) for each experimental condition is shown. Data show all normalized viable single cells, subjected to the PhenoGraph algorithm.
Fig. 4
Fig. 4. Therapeutic efficacy of combined pharmacologic inhibition of DDR2 and anti–PD-1 immunotherapy.
(A) Waterfall plot of NA13 tumor volume in response to dasatinib and anti–PD-1 treatment relative to pretreatment baseline (before anti–PD-1 treatment). n = 5 to 6 mice per group. (B) Average MC38 tumor volume in response to dasatinib and anti–PD-1. (C) Individual tumor volumes of mice in (B). n = 8 mice per group. (D) Individual tumor volumes of mice injected with the 1956 sarcoma cell line in response to dasatinib and anti–PD-1 treatment. Each line represents a single mouse. n = 10 mice per group. (E) PhenoGraph-defined cellular distribution and clustering, as defined by tSNE1 and tSNE2, colored by cellular phenotype for all treatment conditions of MC38 tumors. Data show all normalized viable single cells, subjected to the PhenoGraph algorithm. (F) Frequency of all statistically significant PhenoGraph-identified clusters compared to vehicle + IgG–treated organized according to cluster phenotypic designation. Mean ± SEM. *P < 0.05, ***P < 0.001, ****P < 0.0001. (G) Relative abundance of tumor-infiltrating immune cell populations determined by the CIBERSORT methodology (24) in bladder cancer patients from RNA-seq data in TCGA (n = 433) as a function of DDR2 expression. ***P < 0.001, ****P < 0.0001.

References

    1. Chen L., Han X., Anti–PD-1/PD-L1 therapy of human cancer: Past, present, and future. J. Clin. Invest. 125, 3384–3391 (2015). - PMC - PubMed
    1. Buchbinder E. I., Desai A., CTLA-4 and PD-1 pathways: Similarities, differences, and implications of their inhibition. Am. J. Clin. Oncol. 39, 98–106 (2016). - PMC - PubMed
    1. Rotte A., Jin J. Y., Lemaire V., Mechanistic overview of immune checkpoints to support the rational design of their combinations in cancer immunotherapy. Ann. Oncol. 29, 71–83 (2018). - PubMed
    1. Chen D. S., Mellman I., Elements of cancer immunity and the cancer–immune set point. Nature 541, 321–330 (2017). - PubMed
    1. Schmidt C., The benefits of immunotherapy combinations. Nature 552, S67–S69 (2017). - PubMed

Publication types

MeSH terms