. 2018 Dec 26;4(1):e703.
doi: 10.1097/PR9.0000000000000703. eCollection 2019 Jan-Feb.

Transmembrane protein 100 is expressed in neurons and glia of dorsal root ganglia and is reduced after painful nerve injury

Affiliations

Transmembrane protein 100 is expressed in neurons and glia of dorsal root ganglia and is reduced after painful nerve injury

Hongwei Yu et al. Pain Rep. .

Abstract

Introduction: Tmem100 modulates interactions between TRPA1 and TRPV1. The cell specificity of Tmem100 expression in dorsal root ganglia (DRGs) is not well defined, nor is the effect of peripheral nerve injury on Tmem100 expression.

Objective: This study was designed to determine the cell specificity of Tmem100 expression in DRG and its subcellular localization, and to examine how Tmem100 expression may be altered in painful conditions.

Methods: Dorsal root ganglion Tmem100 expression was determined by immunohistochemistry, immunoblot, and quantitative real-time PCR, and compared between various experimental rat pain models and controls.

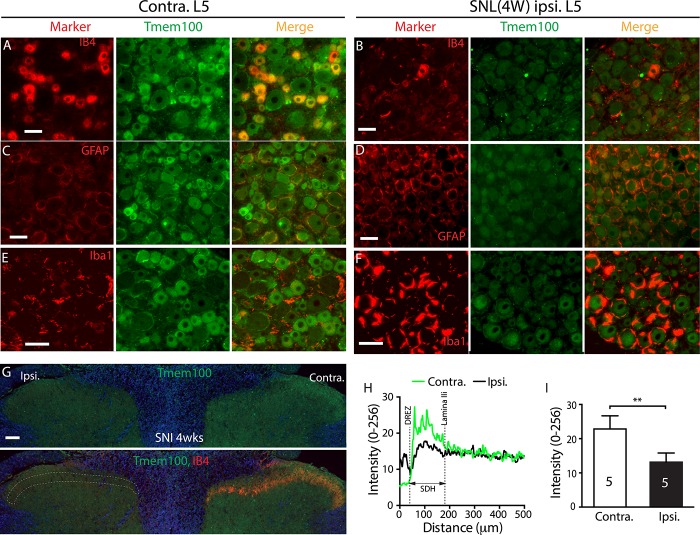
Results: Tmem100 is expressed in both neurons and perineuronal glial cells in the rat DRG. The plasma membrane and intracellular localization of Tmem100 are identified in 83% ± 6% of IB4-positive and 48% ± 6% of calcitonin gene-related peptide-positive neurons, as well as in medium- and large-sized neurons, with its immunopositivity colocalized to TRPV1 (94% ± 5%) and TRPA1 (96% ± 3%). Tmem100 is also detected in the perineuronal satellite glial cells and in some microglia. Tmem100 protein is significantly increased in the lumbar DRGs in the complete Freund adjuvant inflammatory pain. By contrast, peripheral nerve injury by spinal nerve ligation diminishes Tmem100 expression in the injured DRG, with immunoblot and immunohistochemistry experiments showing reduced Tmem100 protein levels in both neurons and satellite glial cells of DRGs proximal to injury, whereas Tmem100 is unchanged in adjacent DRGs. The spared nerve injury model also reduces Tmem100 protein in the injured DRGs.

Conclusion: Our data demonstrate a pain pathology-dependent alteration of DRG Tmem100 protein expression, upregulated during CFA inflammatory pain but downregulated during neuropathic pain.

Keywords: Dorsal root ganglia; Inflammatory pain; Microglia; Neuropathic pain; Primary sensory neurons; Satellite glial cells; Transmembrane protein 100.


Conflict of interest statement

Sponsorships or competing interests that may be relevant to content are disclosed at the end of this article.

Figures

Figure 1.
Figure 1.
Tmem100 IHC profile and antibody preabsorption testing. Immunostained Tmem100 expression profile (A) with amplified images (B, B1) show the Tmem100 localization in intracellular (asterisks) and PM-like patterns (arrowheads) in DRG section from naive adult rat, using a goat anti-Tmem100 antibody, which detects a ∼17 KDa band on the lysates from DRGs (C, lanes 3 and 4) and pCMV-Tmem100 transfected 293T cells (C, lane 5) but not in the lysate from sham-transfected 293T cells (C, lane 2). Preincubation with antigenic peptide eliminates the band in immunoblot, suggesting specificity of detection (D). GAPDH immunoblotting (bottom panels in panels C and D) was used as the loading control. IHC using this antibody detected Tmem100 in SDH (E), Tmem100-IR signals symmetrical in the region from DREZ to PKCγ-labeled laminae II inner ventral edge (IIiv) (E and F) and concentrated on the CGRP-positive laminae I afferents (G) and IB4-positive laminae II fibers (H). Scale bar: 100 μm for all. CGRP, calcitonin gene-related peptide; DREZ, dorsal root entry zone; DRG, dorsal root ganglion; IHC, immunohistochemistry; PM, plasma membrane; SDH, superficial dorsal horn.
Figure 2.
Figure 2.
Double immunostaining of Tmem100 with a selection of nociceptive markers. Representative images show immunostaining of Tmem100 with IB4 (A), CGRP (B), TRPV1 (C), and TRPA1 (D) on DRG sections from naive rats. Bar charts of A1 to D1 in the right of panels of A to D show percentage of Tmem100 overlaid with each marker, respectively. The numbers in each bar is the numbers of total neurons analyzed from at least 4 animals per group. ***P < 0.001 for comparison between the percentage of Tmem100 overlaid with IB4 or CGRP. Some small neurons in sections show a characteristic punctate Tmem100 immunopositivity (E and F). Representative montage images (G) show about 30% to 40% (G1) double positivity of both IB4 (red) and CGRP (green) in DRG section from naive rats. The numbers in each bar is the numbers of neurons analyzed. Scale bars: 100 μm for all. CGRP, calcitonin gene-related peptide; DRG, dorsal root ganglion.
Figure 3.
Figure 3.
IHC delineation of Tmem100 localization to the PM in primary sensory neurons. Representative montage images show immunostaining of Tmem100 (green) with a canonical neuronal PM marker NKA1α (red) showing colabeling (yellow) in the merged image (A–A2, B–B3). Pixel intensity line-plot profiles of crossed sections clearly indicate neuronal PM localization of Tmem100 in the larger neurons (B, B1, C). ICA colocalization: Scatter plots for the region demarcated by the white dashed line in (B3) panel show strong right skewing for NKA1α (D) and Tmem100 (E). In (D, E), “A” is the intensity of Tmem100 while “a” is the average of these values, and “B” is the intensity of NKA1α while “b” is the average of these values. For this region, the intensity correlation quotient (ICQ) value is 0.248 (Psign test < 0.001), indicating immunocolocalization. Scale bars: 100 μm for all. ICA, intensity correlation analysis; IHC, immunohistochemistry; PM, plasma membrane.
Figure 4.
Figure 4.
IHC analysis of Tmem100 immunocolocalization with glial cell markers. Representative montage images show immunocolocalization of Tmem100 with SGC marker GFAP (A and C) and GS (B and D). The ICA plots for the region demarcated by the white dashed line of Tmem100 and GFAP (E) or GS (F) were strongly skewed toward positive values with the calculated ICQ values were 0.249 (Psign test < 0.001) for GFAP and 0.216 (Psign test < 0.001) for GS both consistent with immunocolocalization. The scattered overlay was also found in the double labeling images of Tmem100 and Iba1 in naive DRG sections (G, H, I, arrowheads). The ICA plots for the region demarcated by the white dashed line of Tmem100 and Iba1 in ROIs in the panels (H and I) were strongly skewed toward positive values, consistent with immunocolocalization, 2 ROIs for Iba1 are 0.306 and 0.288 (Psign test < 0.001 for both) (H1, I1). Scale bar: 100 μm for (A–G) and 20 μm for (H, I). DRG, dorsal root ganglion; GFAP, glial fibrillary acidic protein; GS, glutamine synthetase; ICA, intensity correlation analysis; ICQ, intensity correlation quotient; IHC, immunohistochemistry; ROIs, region of interests; SGC, satellite glial cell.
Figure 5.
Figure 5.
Behavior and Tmem100 expression in CFA inflammatory pain. Rats with CFA injection developed mechanical allodynia (von Frey, A) and Heat (B). ***P < 0.001for comparison to baseline (BL) and ###P < 0.001 for comparison between groups at the 10 days after injection. Representative montage IHC images shows the profiles of double immunolabeling of Tmem100 with IB4 (C) and CGRP (D) on the contralateral (contra.) L5 DRG of CFA and ipsilateral (ipsi.) L5 DRG at the 10 days after CFA. Scale bars: 100 μm for all. The NKA1α-eliminated cytosol and NKA1α-enriched PM protein fractions were extracted from the DRG tissues 10 days after CFA and control samples (E), and subjected to immunoblotting as shown in the representative immunoblots of Tmem100, Iba1, NKA1α, and Tubb3 of cytosolic fractions (left) and PM fractions (right), respectively. Bar charts are the results of densitometry analysis of immunoblots (F) and qPCR of Tmem100 transcript in DRG (G), **P < 0.01 and ***P < 0.001. The number in each bar is the number of analyzed DRGs per group. CFA, complete Freund adjuvant; GRP, calcitonin gene-related peptide; DRG, dorsal root ganglion; IHC, immunohistochemistry; PM, plasma membrane.
Figure 6.
Figure 6.
Behavior and immunoblot analysis of Tmem100 expression in DRGs after SNL. Rats with L5-SNL developed mechanical allodynia (von Frey, A), hyperalgesia (Pin, A1), Heat (A2), and Cold (A3) hypersensitivity. *P < 0.05, **P < 0.01, and ***P < 0.001 for comparison to baseline (BL) and #P < 0.05, ##P < 0.01, and ###P < 0.001 for comparison between groups at 2 and 4 weeks after SNL, respectively. The NKA1α-eliminated cytosol and NKA1α-enriched PM protein fractions were extracted from the DRG tissues at 28 days after L5-SNL and control samples, and subjected to immunoblotting as shown in the representative immunoblots of Tmem100, Iba1, GFAP, NKA1α, and Tubb3 of cytosol (B) and PM fractions (B1), respectively. Bar charts in the panels (C, C1) are the results of densitometry analysis of immunoblots (***P < 0.001). The number in each bar is the number of analyzed DRGs per group. Bar chart in the panel (D) is the result of qPCR quantification of Tmem100 mRNA in the L5 DRGs from ipsilateral (i) and contralateral (c) to SNL at 28 days after injury (n = 4 per groups). DRG, dorsal root ganglion; GFAP, glial fibrillary acidic protein; PM, plasma membrane; SNL, spinal nerve ligation.
Figure 7.
Figure 7.
IHC analysis of Tmem100 expression following SNL nerve injury. Representative montage IHC images shows normal profiles of double immunolabeling of Tmem100 with IB4 (A), GFAP (C), and Iba1 (E) on the contralateral (contra.) L5 DRG of SNL rat, while the ipsilateral (ipsi.) L5 DRG at the 4 weeks after SNL show apparently decreased Tmem100 profile in the neuronal and perineuronal glial cells with diminished IB4 binding (B) and increased GFAP (D) and Iba1 (F) staining. The panel (G) shows Tmem100-IR is also decreased in the ipsi. SDH compared with the contra. side; parallel with decreased ipsi. IB4 staining. Scale bars: 100 μm for all. Quantification of Tmem100 immunofluorescence was performed along lines on the contra. and ipsi. sides from the DREZ to central canal, producing traces of intensity (H). The average fluorescence intensity of Tmem100 staining in the SDH, defined a region from DREZ to IB4-labeled laminae II inner edge (IIi) is decreased (**P < 0.01), compared to the contra. side (I). The number in each bar is the number of analyzed animals (3 sections per rat). DREZ, dorsal root entry zone; DRG, dorsal root ganglion; GFAP, glial fibrillary acidic protein; IHC, immunohistochemistry; SDH, superficial dorsal horn; SNL, spinal nerve ligation.
Figure 8.
Figure 8.
Behavior and immunoblot analysis of Tmem100 expression in DRGs following SNI. Rats with SNI developed mechanical allodynia (von Frey, A) and heat hypersensitivity (A1); ***P < 0.001 for comparison to baseline (BL) and ###P < 0.001 for comparison between groups at 2 and 4 weeks after SNI, respectively. The NKA1α-eliminated cytosol and NKA1α-enriched PM protein fractions were extracted from the contra. and ipsi. L4/L5 DRG tissues at 28 days after SNI, and subjected to immunoblotting. Representative immunoblots of Tmem100, Iba1, NKA1α, and Tubb3 in cytosol (B) and PM fractions (B1) are shown, respectively. Bar charts in the panel (C) are the results of densitometry analysis of immunoblots, as indicated. ***P < 0.0001 for comparison between groups. Representative montage IHC images shows normal profiles of double immunolabeling of Tmem100 with CGRP (D), Iba1 (F), and GFAP (H) on the contralateral (contra.) L5 DRG of SNI rat, while the ipsilateral (ipsi.) L5 DRG at the 4-week after SNI shows apparently decreased Tmem100 profile in the neuronal and perineuronal glial cells with decreased CGRP (E) and increased Iba1 (G) and GFAP (I) staining. Scale bars: 100 μm for all. CGRP, calcitonin gene-related peptide; DRG, dorsal root ganglion; GFAP, glial fibrillary acidic protein; IHC, immunohistochemistry; PM, plasma membrane; SNI, spared nerve injury.
Figure 9.
Figure 9.
Effect of overexpression of Tmem100 on astrocyte, microglia, and SGC proliferation. EGFP or EGFP2ATmem100 (green) expression with ICC detected Tmem100 (red) and merged images as indicated in C6 astrocytes 4 days after transduction by LV-EGFP, MOI = 5 (top panels) and LV-Tmem100, MOI = 5 (bottom panels) (A, scale bar: 25 μm for all). Western blots show expression of EGFP (top), 2A (middle), and Tmem100 in C6 astrocytes transduced by LV-Tmem100 (B). Overexpression of Tmem100 significantly inhibits cell proliferation of C6 astrocytes, compared with the cells transduced by LV-EGFP control vector (C). EGFP or GFP2ATmem100 (green) expression with ICC detected Tmem100 (red) and merged images in BV2 microglia 4 days after transduction by LV-EGFP, MOI = 5 (top panels) and LV-Tmem100, MOI = 5 (bottom panels) (D, scale bar: 25 μm for all). Western blots show expression of EGFP (top), 2A (middle), and Tmem100 in BV2 microglia transduced by LV-Tmem100 (E). Overexpression of Tmem100 significantly inhibits cell proliferation of BV2 microglia, compared with the cells transduced by LV-EGFP control vector (F). Montage images (G) show EGFP or EGFP2ATmem100 (green), SGC morphology (phase), and merged images, as well as Tmem100 ICC (H) in the primary SGCs after transduction by LV-EGFP, MOI = 5 (top panels) and LV-Tmem100, MOI = 5 (bottom panels). Cell proliferation analyzed by CCK8 assay is significantly slower in the LV-Tmem100–transduced SGCs, compared with LV-EGFP–infected cells (I). *P < 0.05, **P < 0.01, and ***P < 0.001. The numbers in each bar in panels (C, F, I) indicate the repeats of CCK8 assay. ICC, immunocytochemistry; MOI, multiplicity of infection; SGC, satellite glial cell.

Similar articles

Cited by

References

    1. Aoki Y, Ohtori S, Takahashi K, Ino H, Takahashi Y, Chiba T, Moriya H. Innervation of the lumbar intervertebral disc by nerve growth factor-dependent neurons related to inflammatory pain. Spine (Phila Pa 1976) 2004;29:1077–81. - PubMed
    1. Avenali L, Narayanan P, Rouwette T, Cervellini I, Sereda M, Gomez-Varela D, Schmidt M. Annexin A2 regulates TRPA1-dependent nociception. J Neurosci 2014;34:14506–16. - PMC - PubMed
    1. Bailey AL, Ribeiro-da-Silva A. Transient loss of terminals from non-peptidergic nociceptive fibers in the substantia gelatinosa of spinal cord following chronic constriction injury of the sciatic nerve. Neuroscience 2006;138:675–90. - PubMed
    1. Bangaru ML, Park F, Hudmon A, McCallum JB, Hogan QH. Quantification of gene expression after painful nerve injury: validation of optimal reference genes. J Mol Neurosci 2012;46:497–504. - PMC - PubMed
    1. Barabas ME, Kossyreva EA, Stucky CL. TRPA1 is functionally expressed primarily by IB4-binding, non-peptidergic mouse and rat sensory neurons. PLoS One 2012;7:e47988. - PMC - PubMed

LinkOut - more resources