. 2019:2019:PO.18.00134.
doi: 10.1200/PO.18.00134. Epub 2019 Jan 14.

epiCaPture: A Urine DNA Methylation Test for Early Detection of Aggressive Prostate Cancer

Affiliations

epiCaPture: A Urine DNA Methylation Test for Early Detection of Aggressive Prostate Cancer

Eve O'Reilly et al. JCO Precis Oncol. 2019.

Abstract

Purpose: Liquid biopsies that noninvasively detect molecular correlates of aggressive prostate cancer (PCa) could be used to triage patients, reducing the burdens of unnecessary invasive prostate biopsy and enabling early detection of high-risk disease. DNA hypermethylation is among the earliest and most frequent aberrations in PCa. We investigated the accuracy of a six-gene DNA methylation panel (Epigenetic Cancer of the Prostate Test in Urine [epiCaPture]) at detecting PCa, high-grade (Gleason score greater than or equal to 8) and high-risk (D'Amico and Cancer of the Prostate Risk Assessment] PCa from urine.

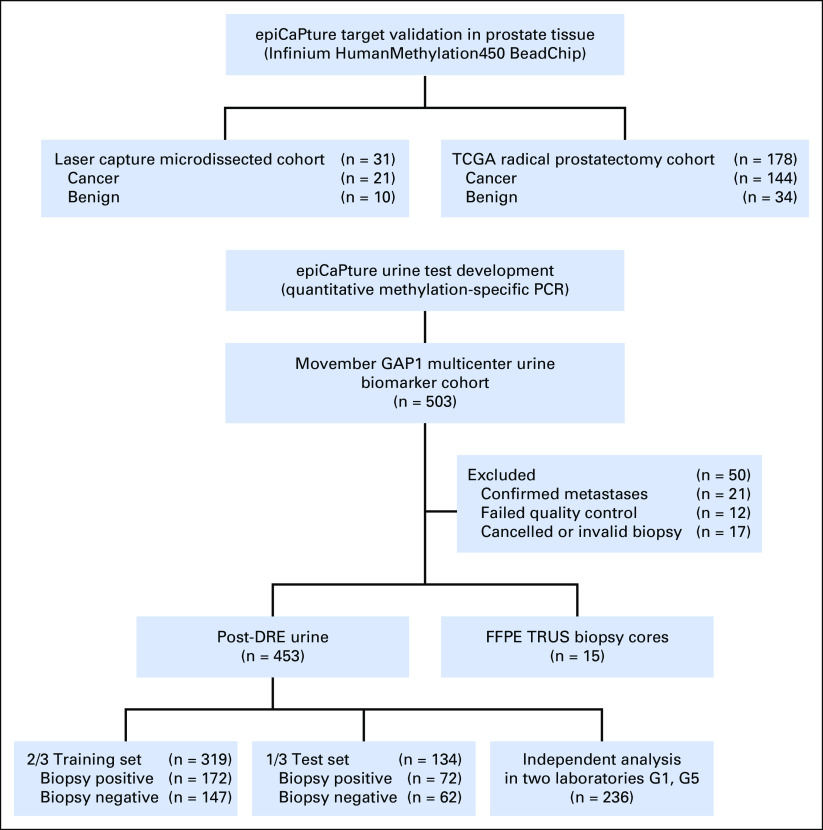
Patients and methods: Prognostic utility of epiCaPture genes was first validated in two independent prostate tissue cohorts. epiCaPture was assessed in a multicenter prospective study of 463 men undergoing prostate biopsy. epiCaPture was performed by quantitative methylation-specific polymerase chain reaction in DNA isolated from prebiopsy urine sediments and evaluated by receiver operating characteristic and decision curves (clinical benefit). The epiCaPture score was developed and validated on a two thirds training set to one third test set.

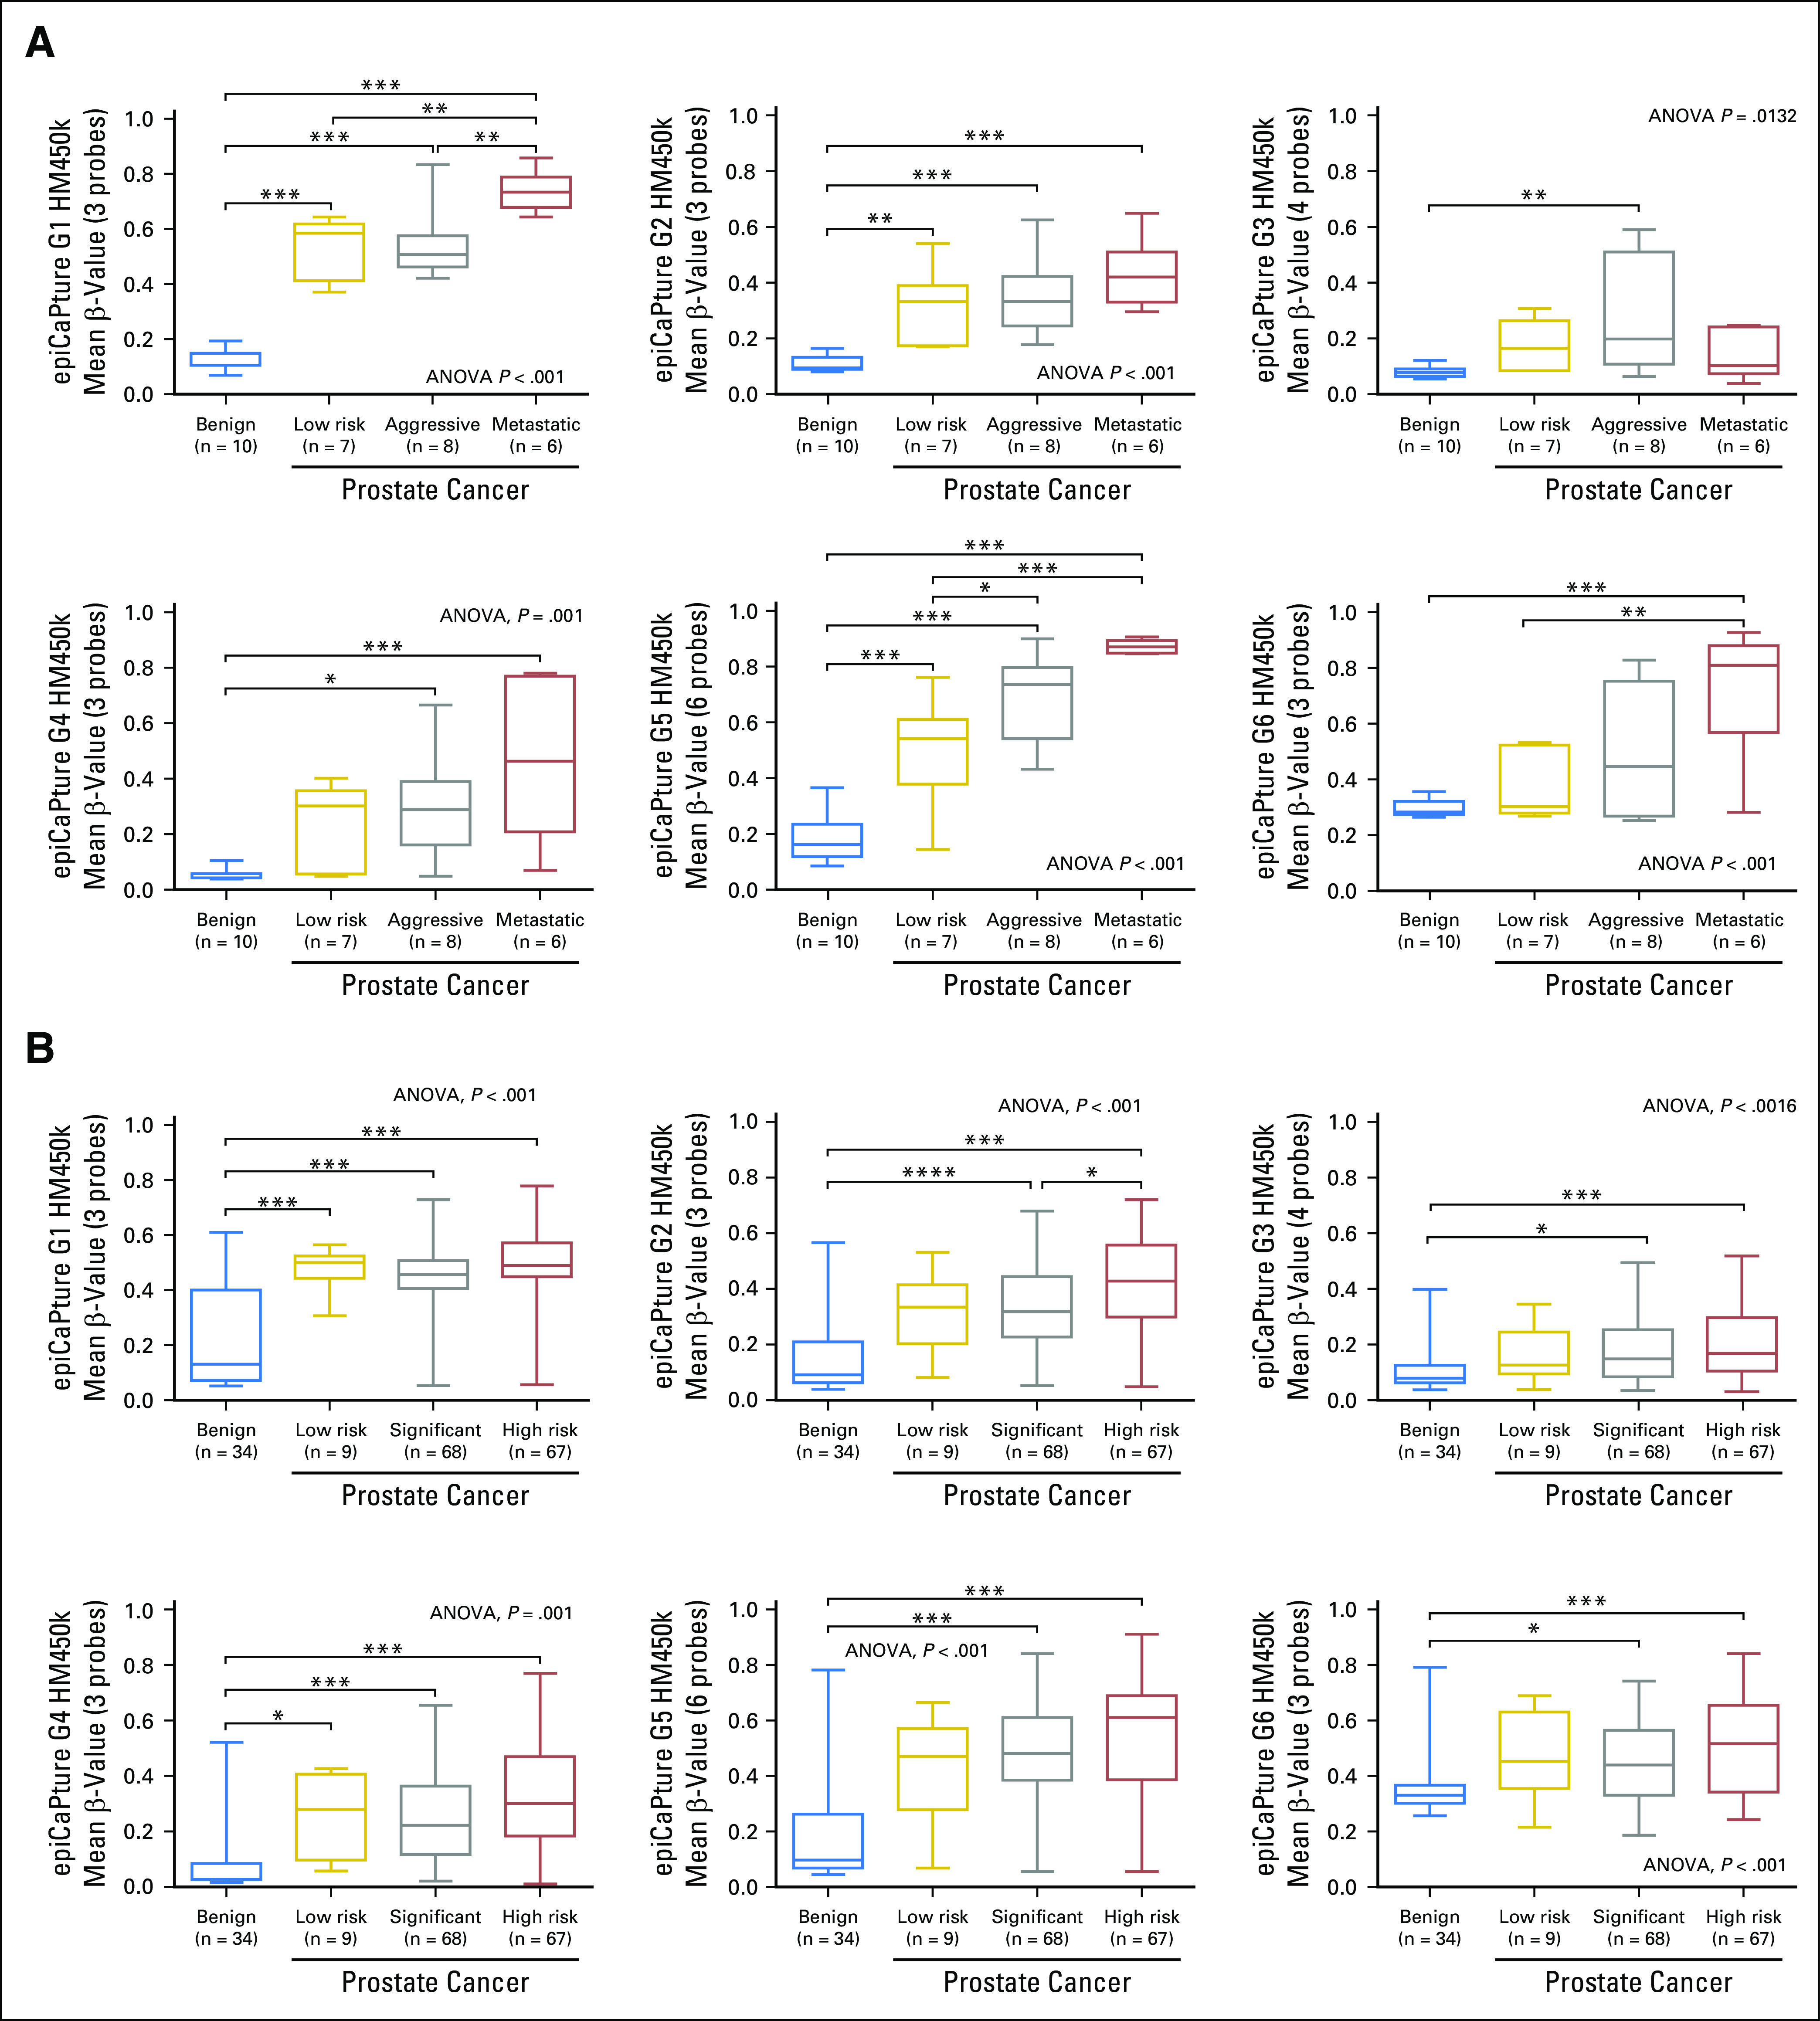
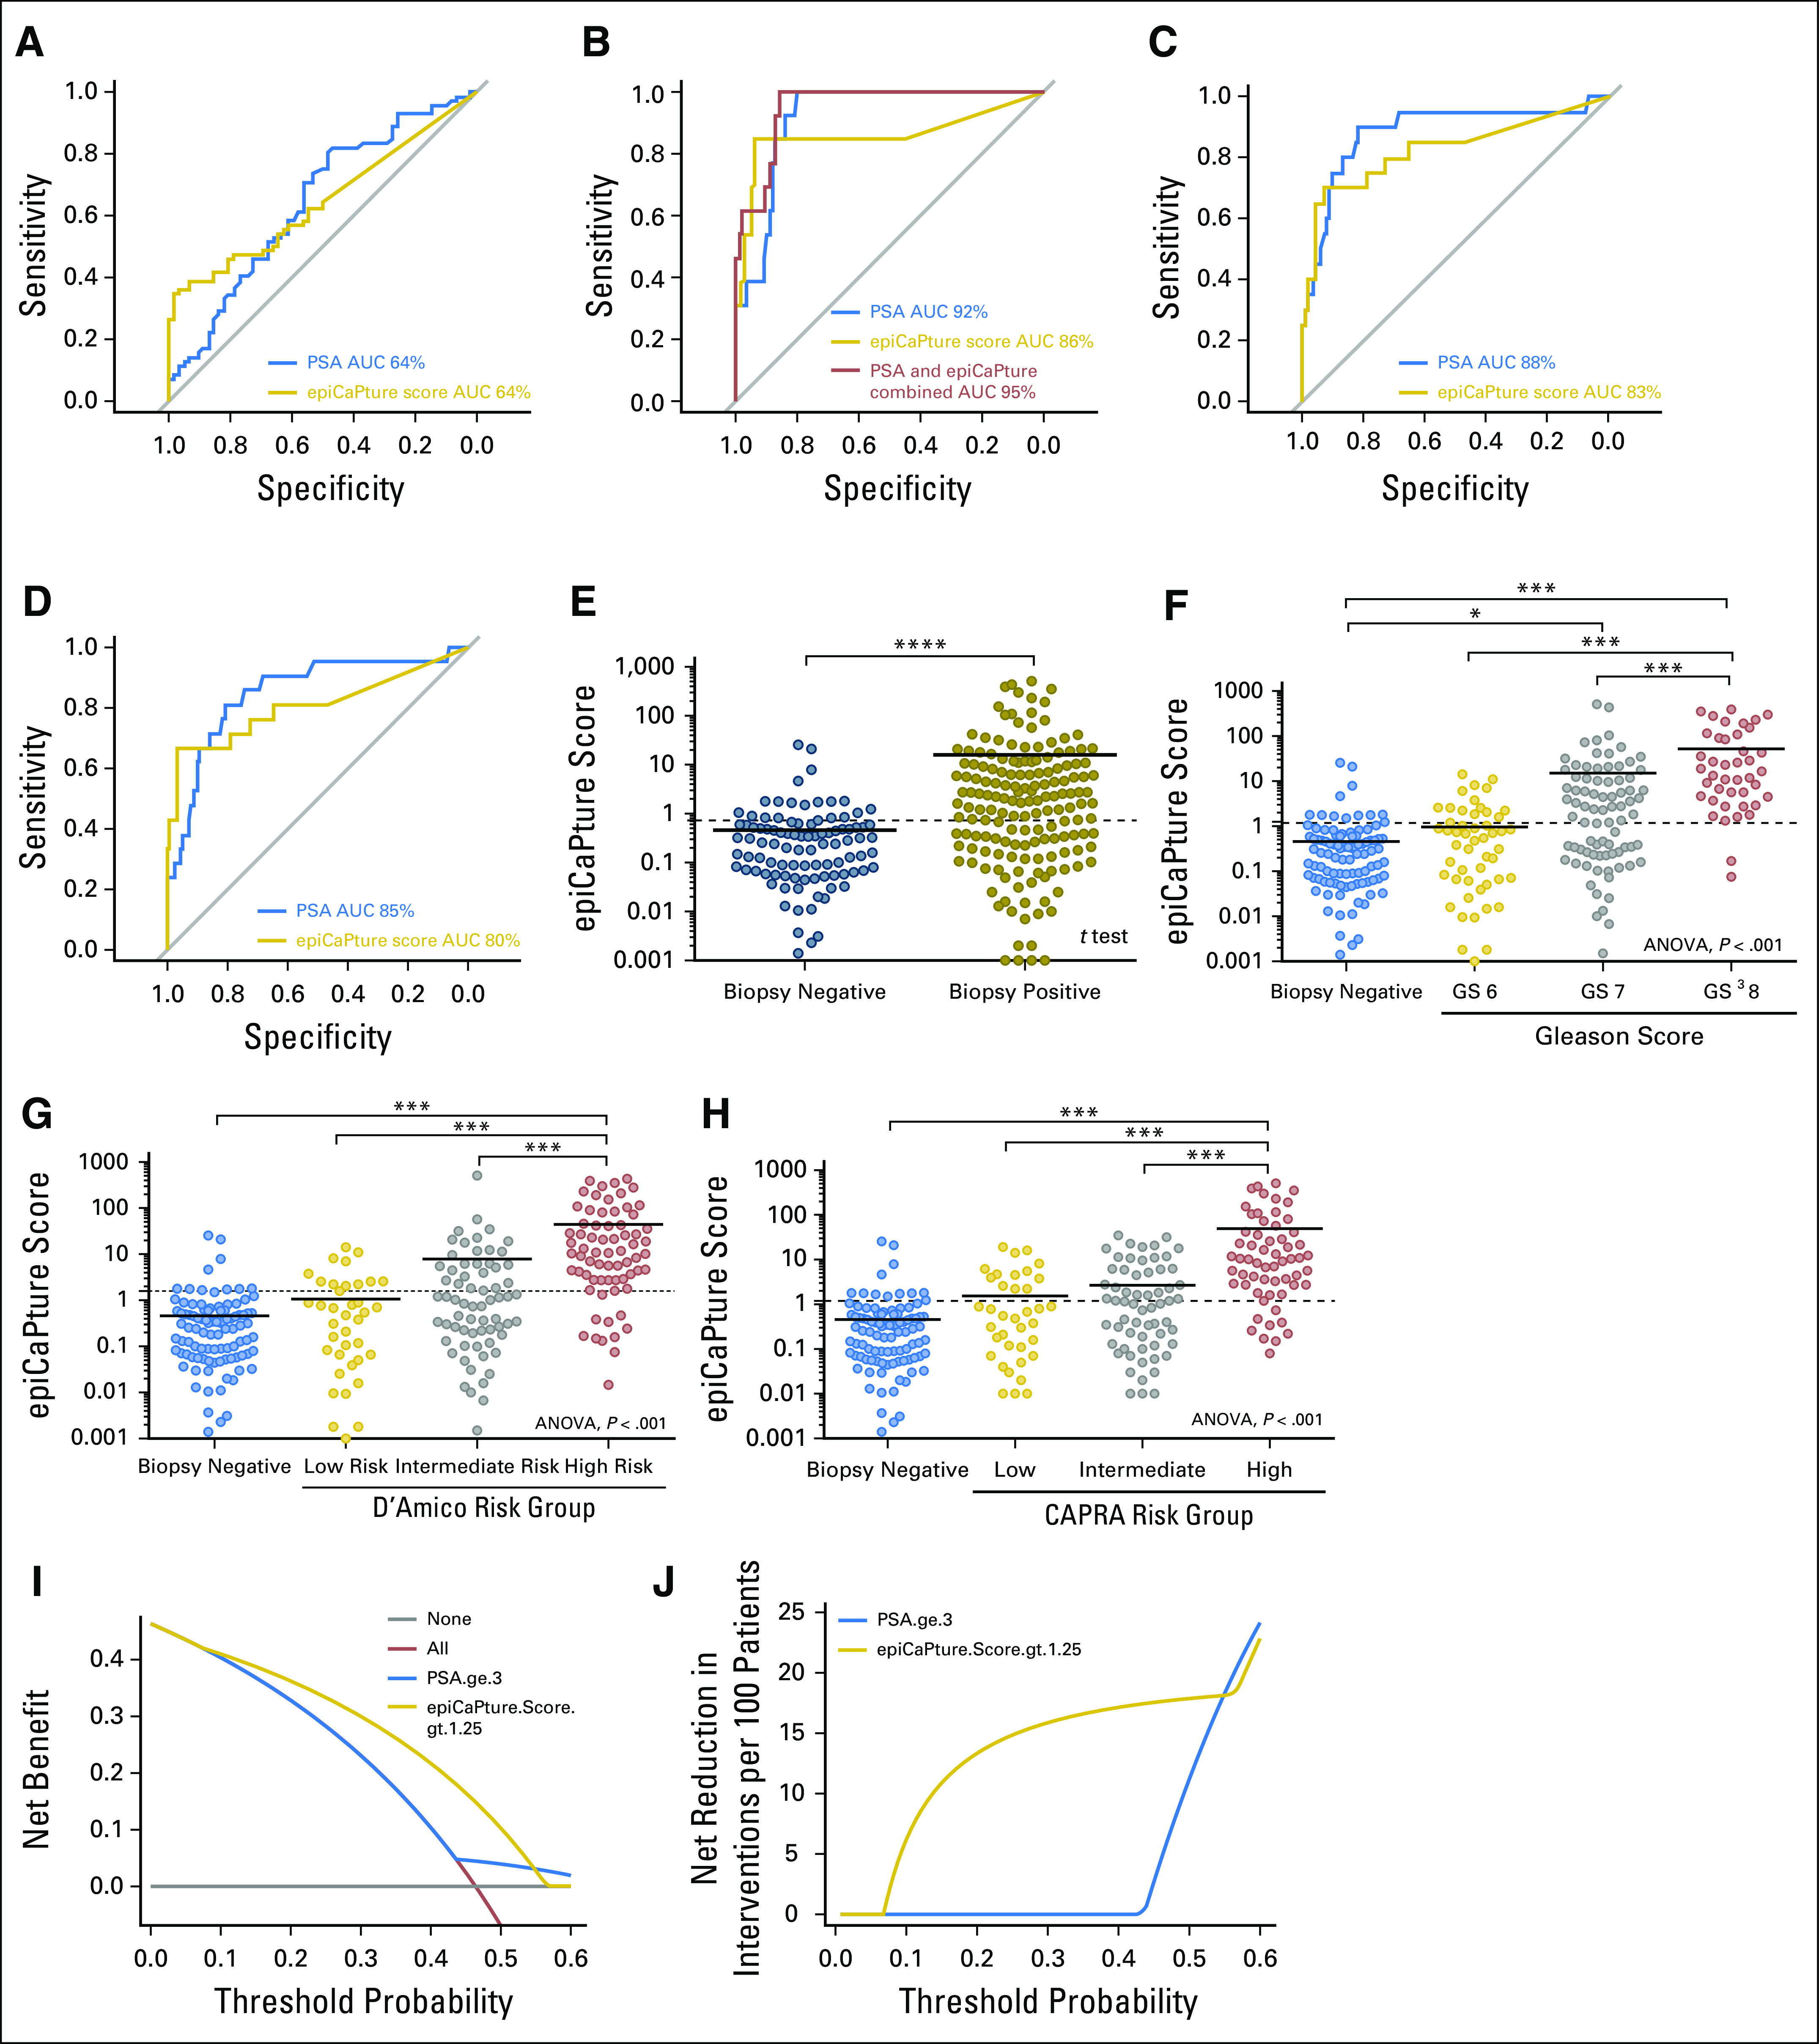
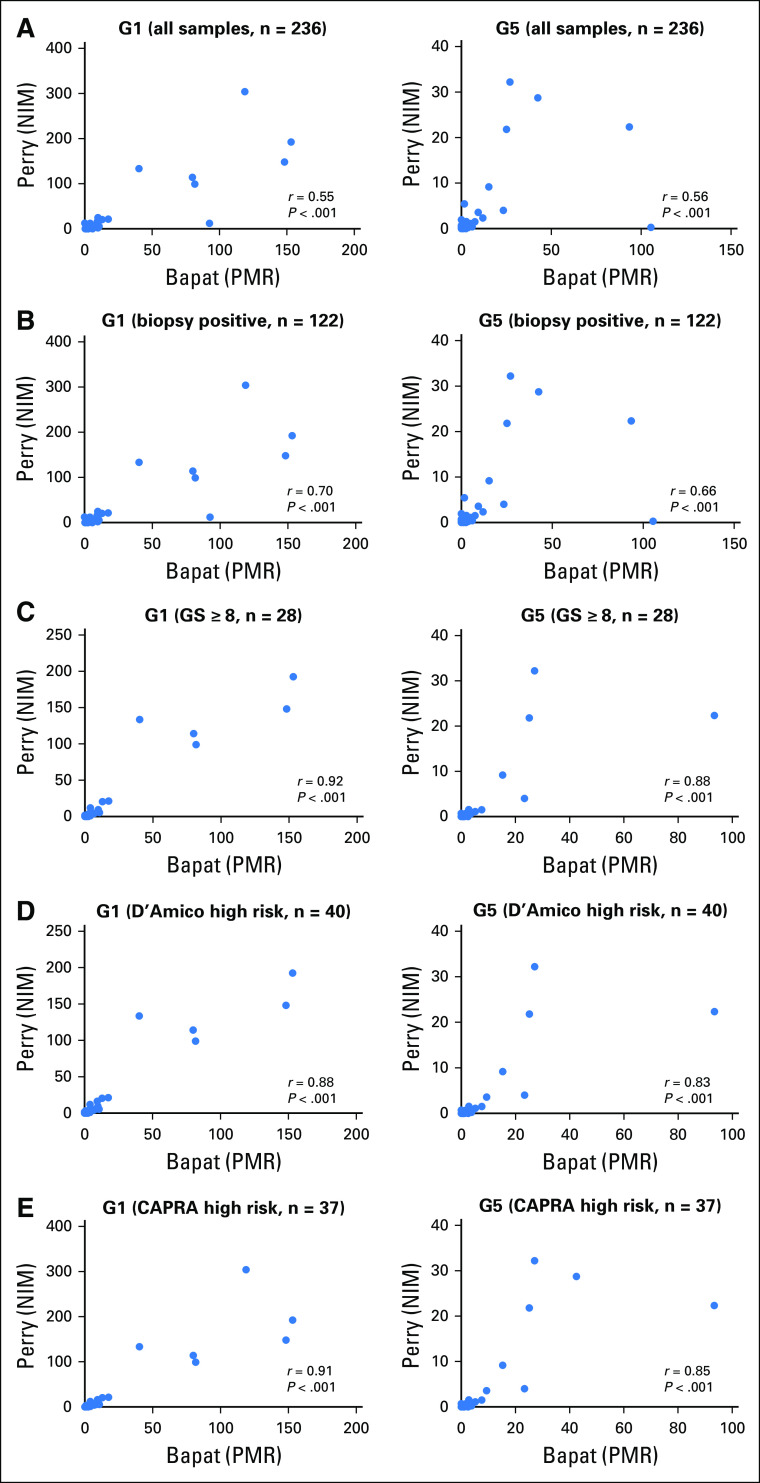
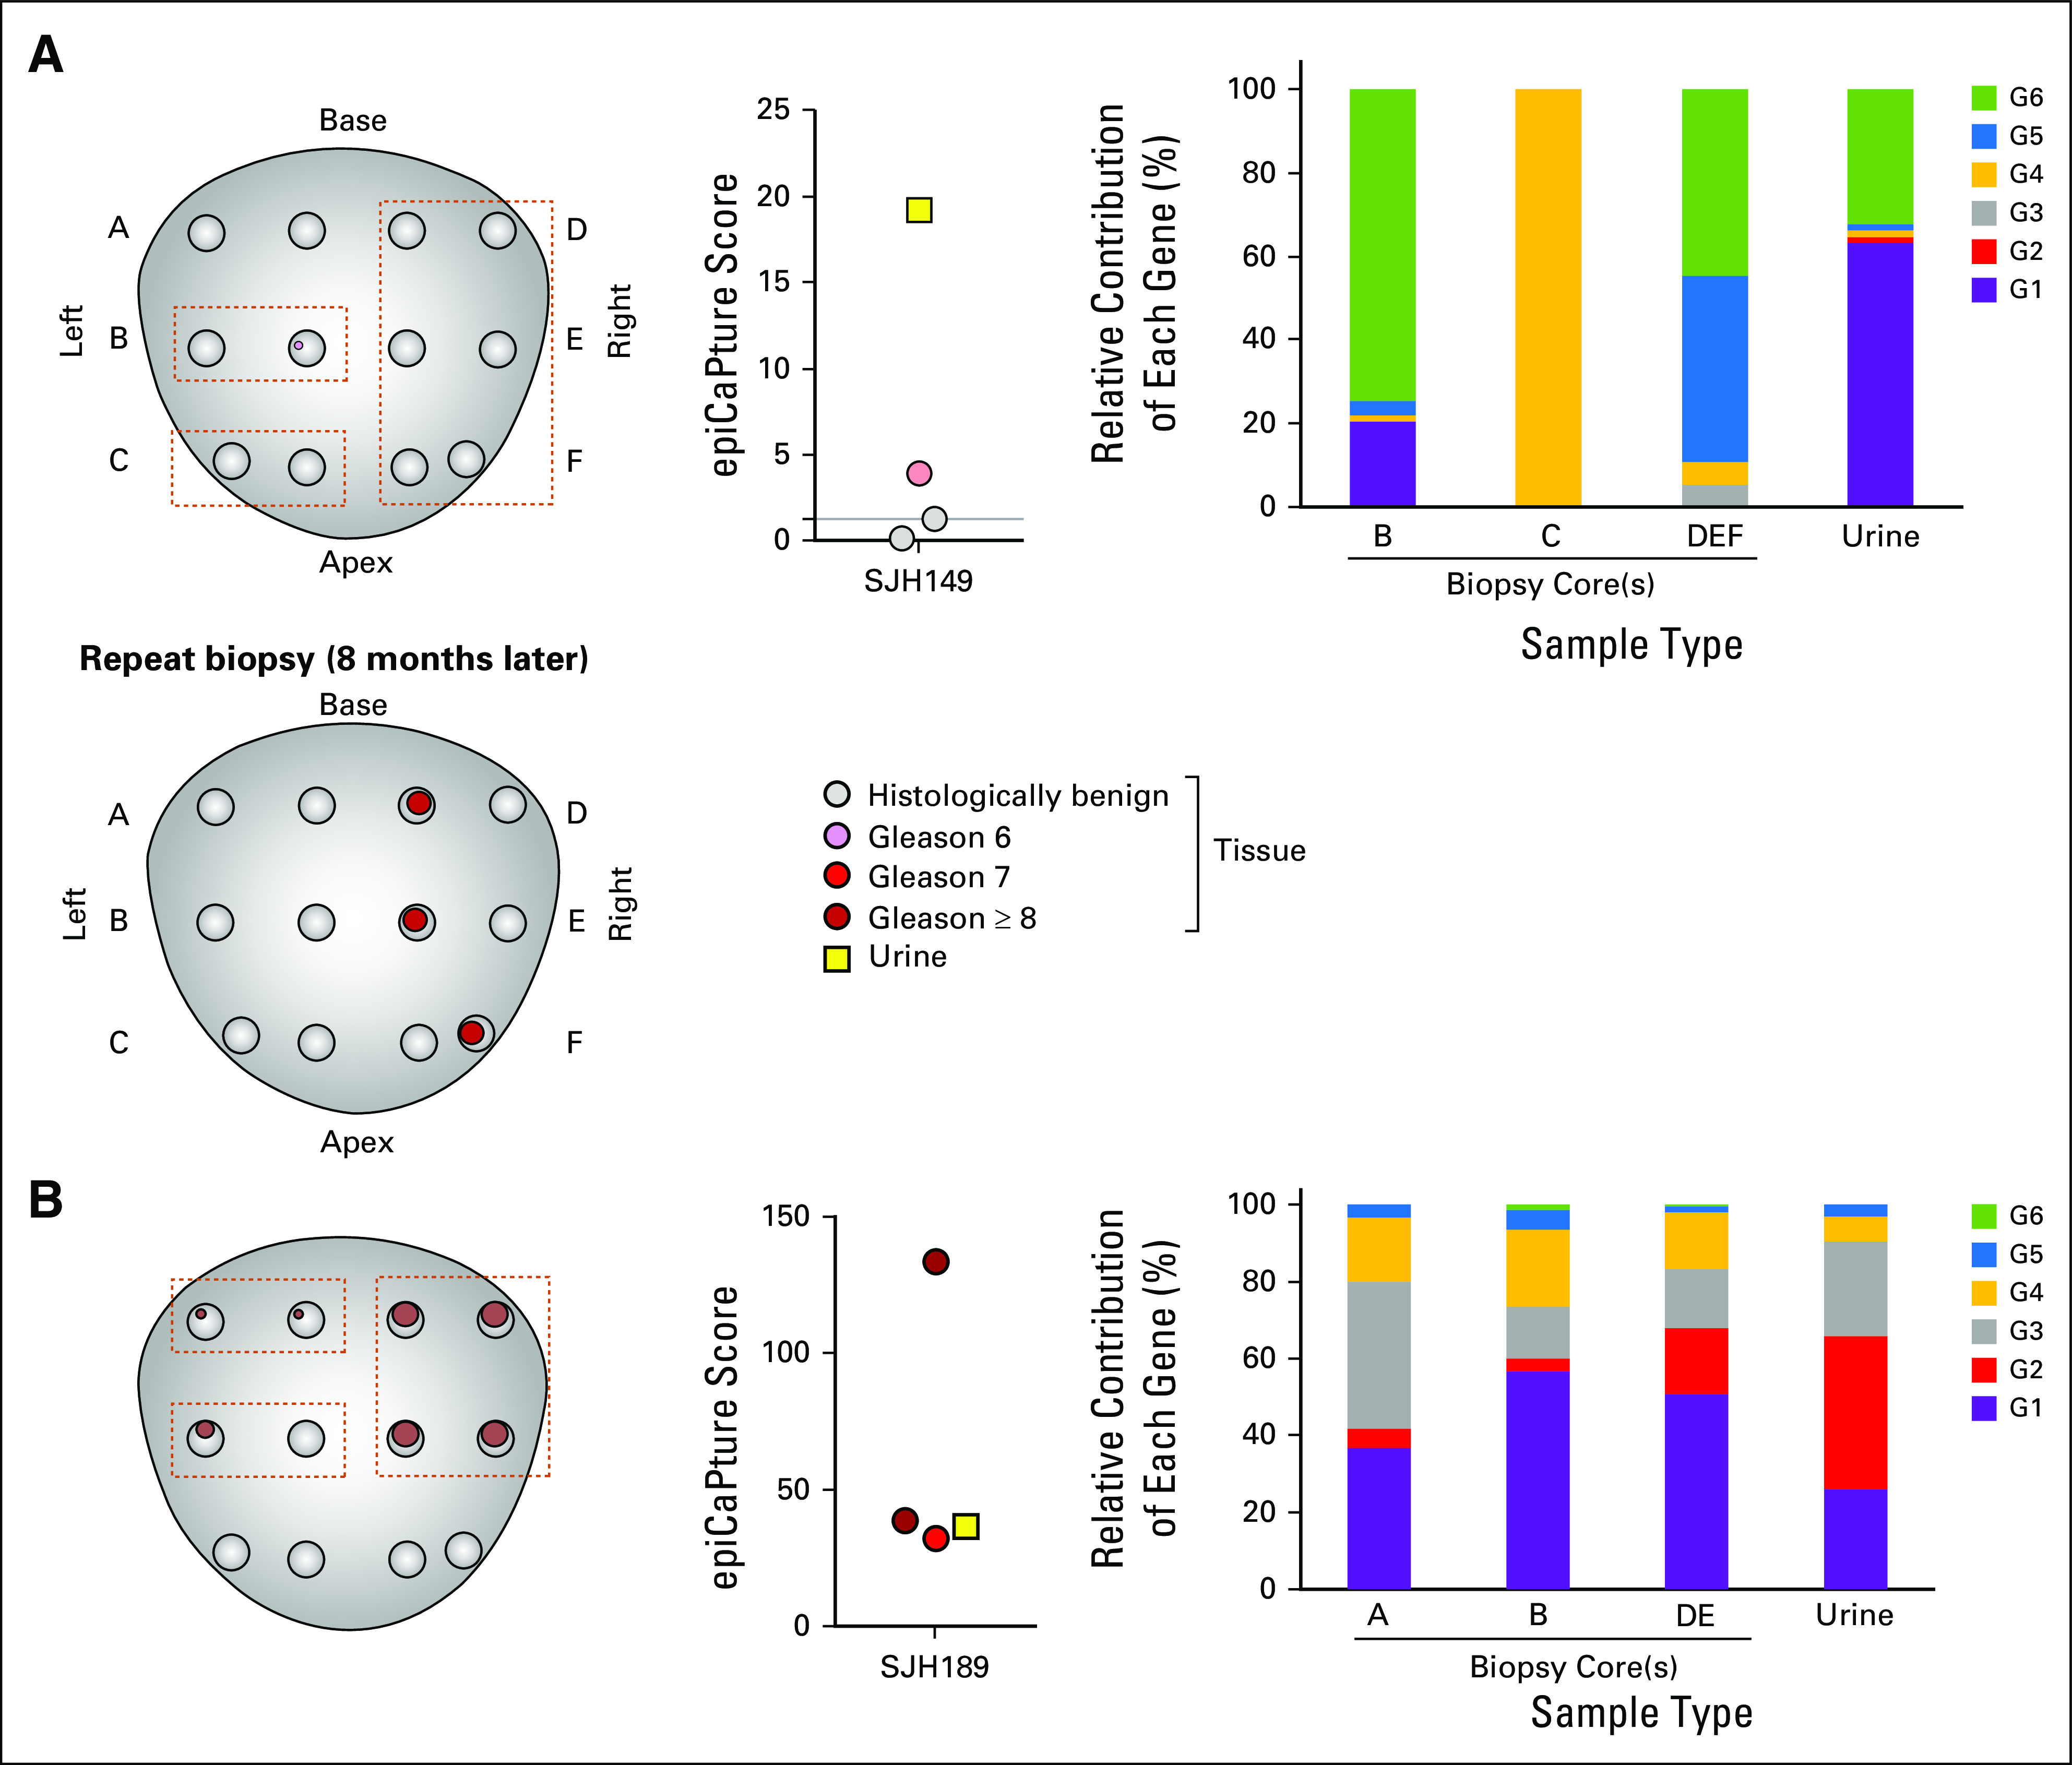
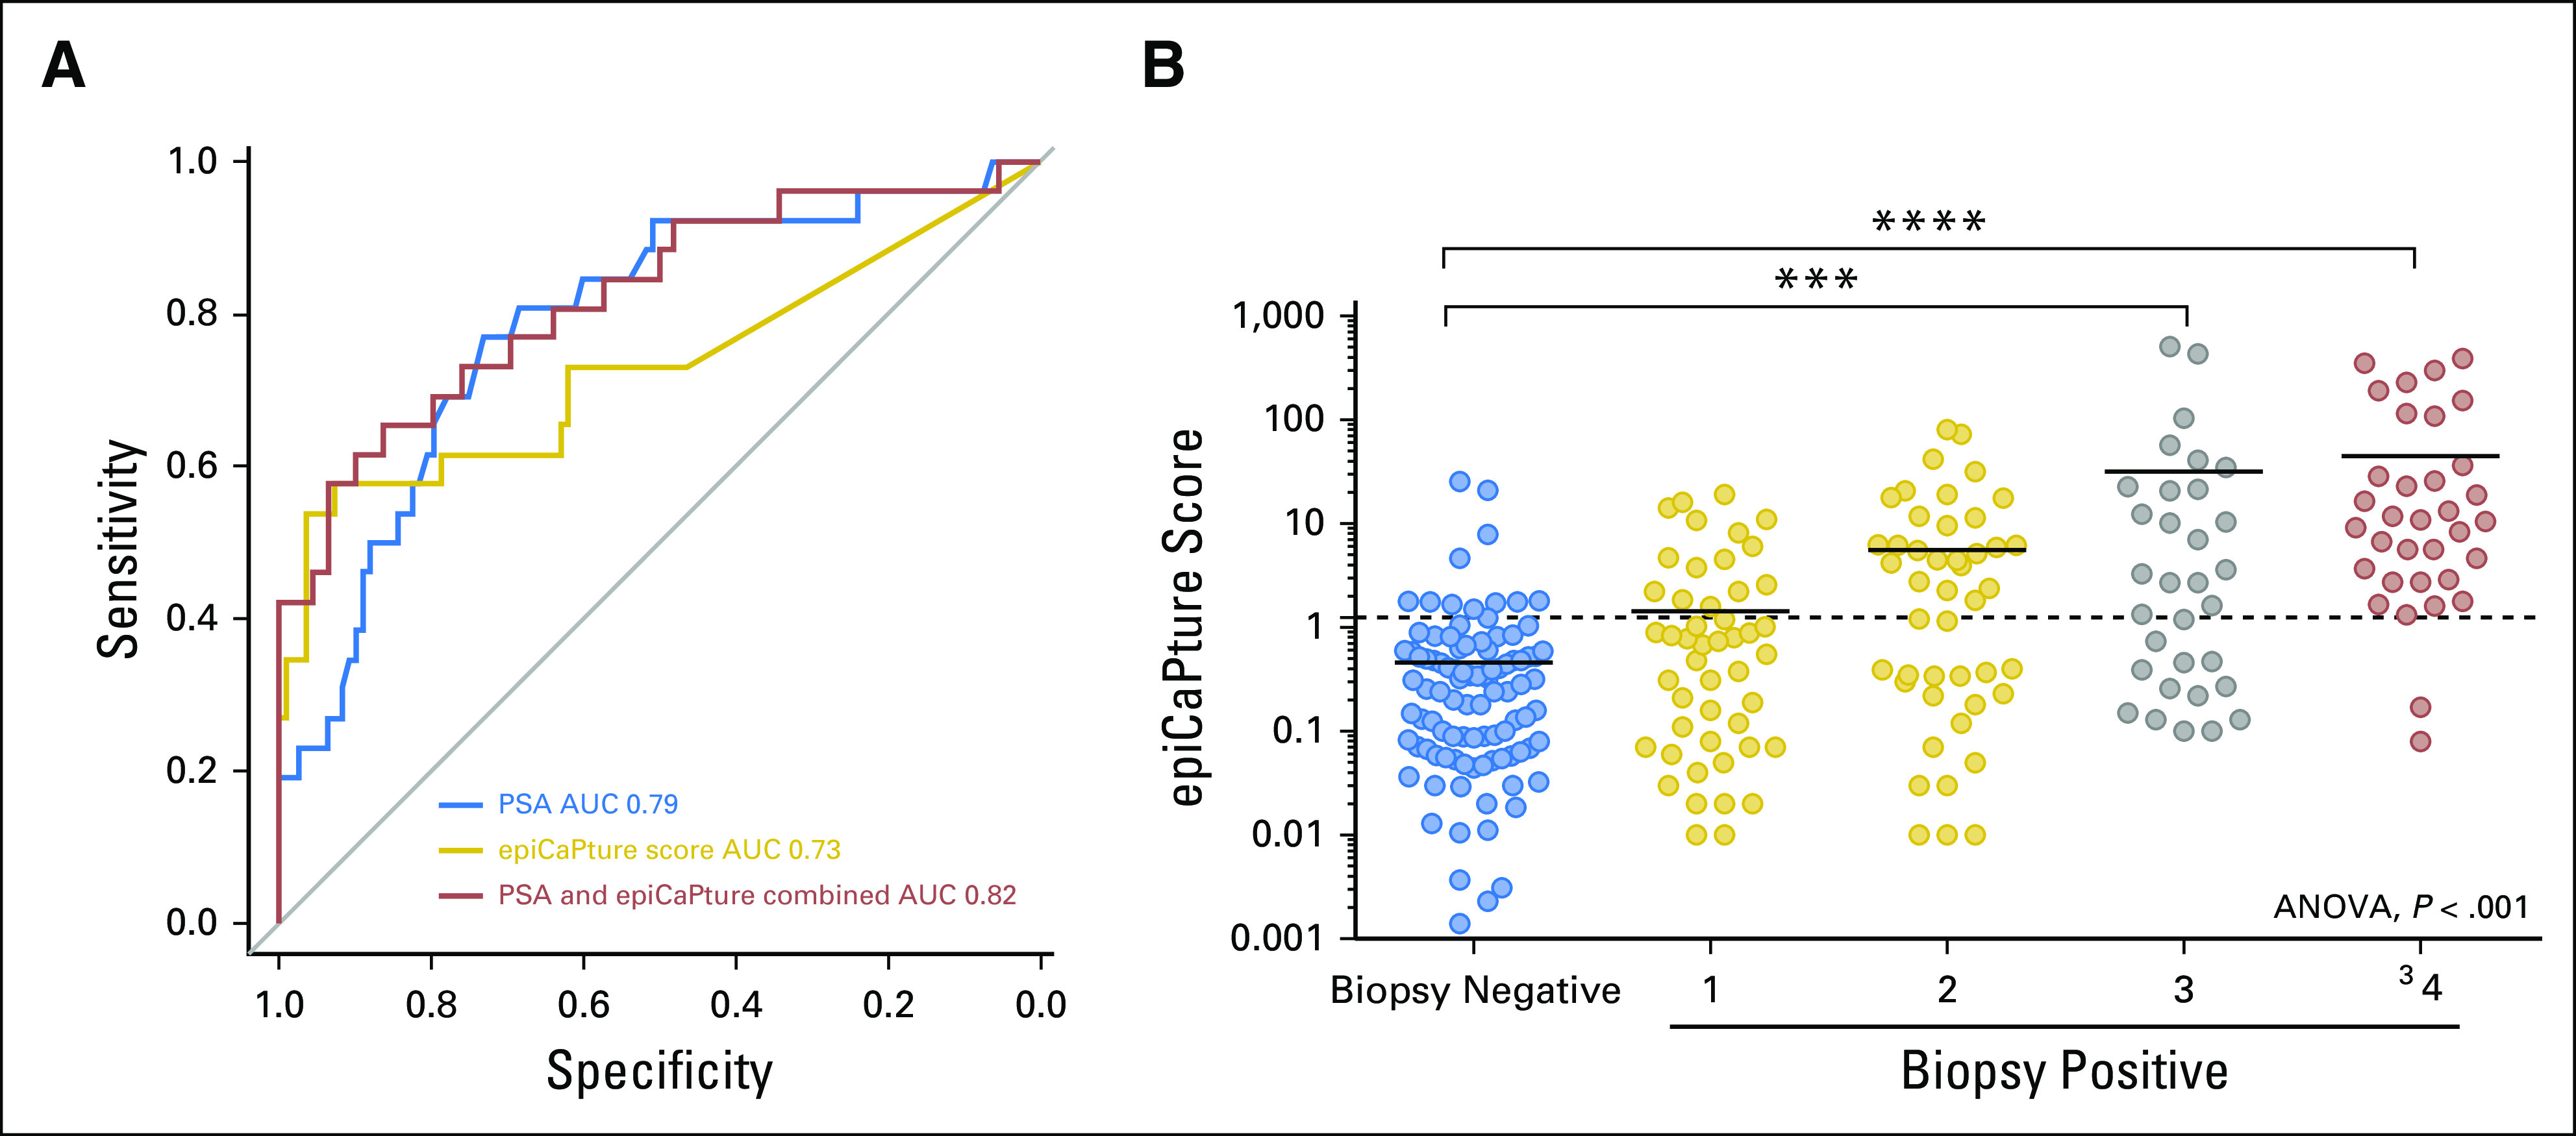
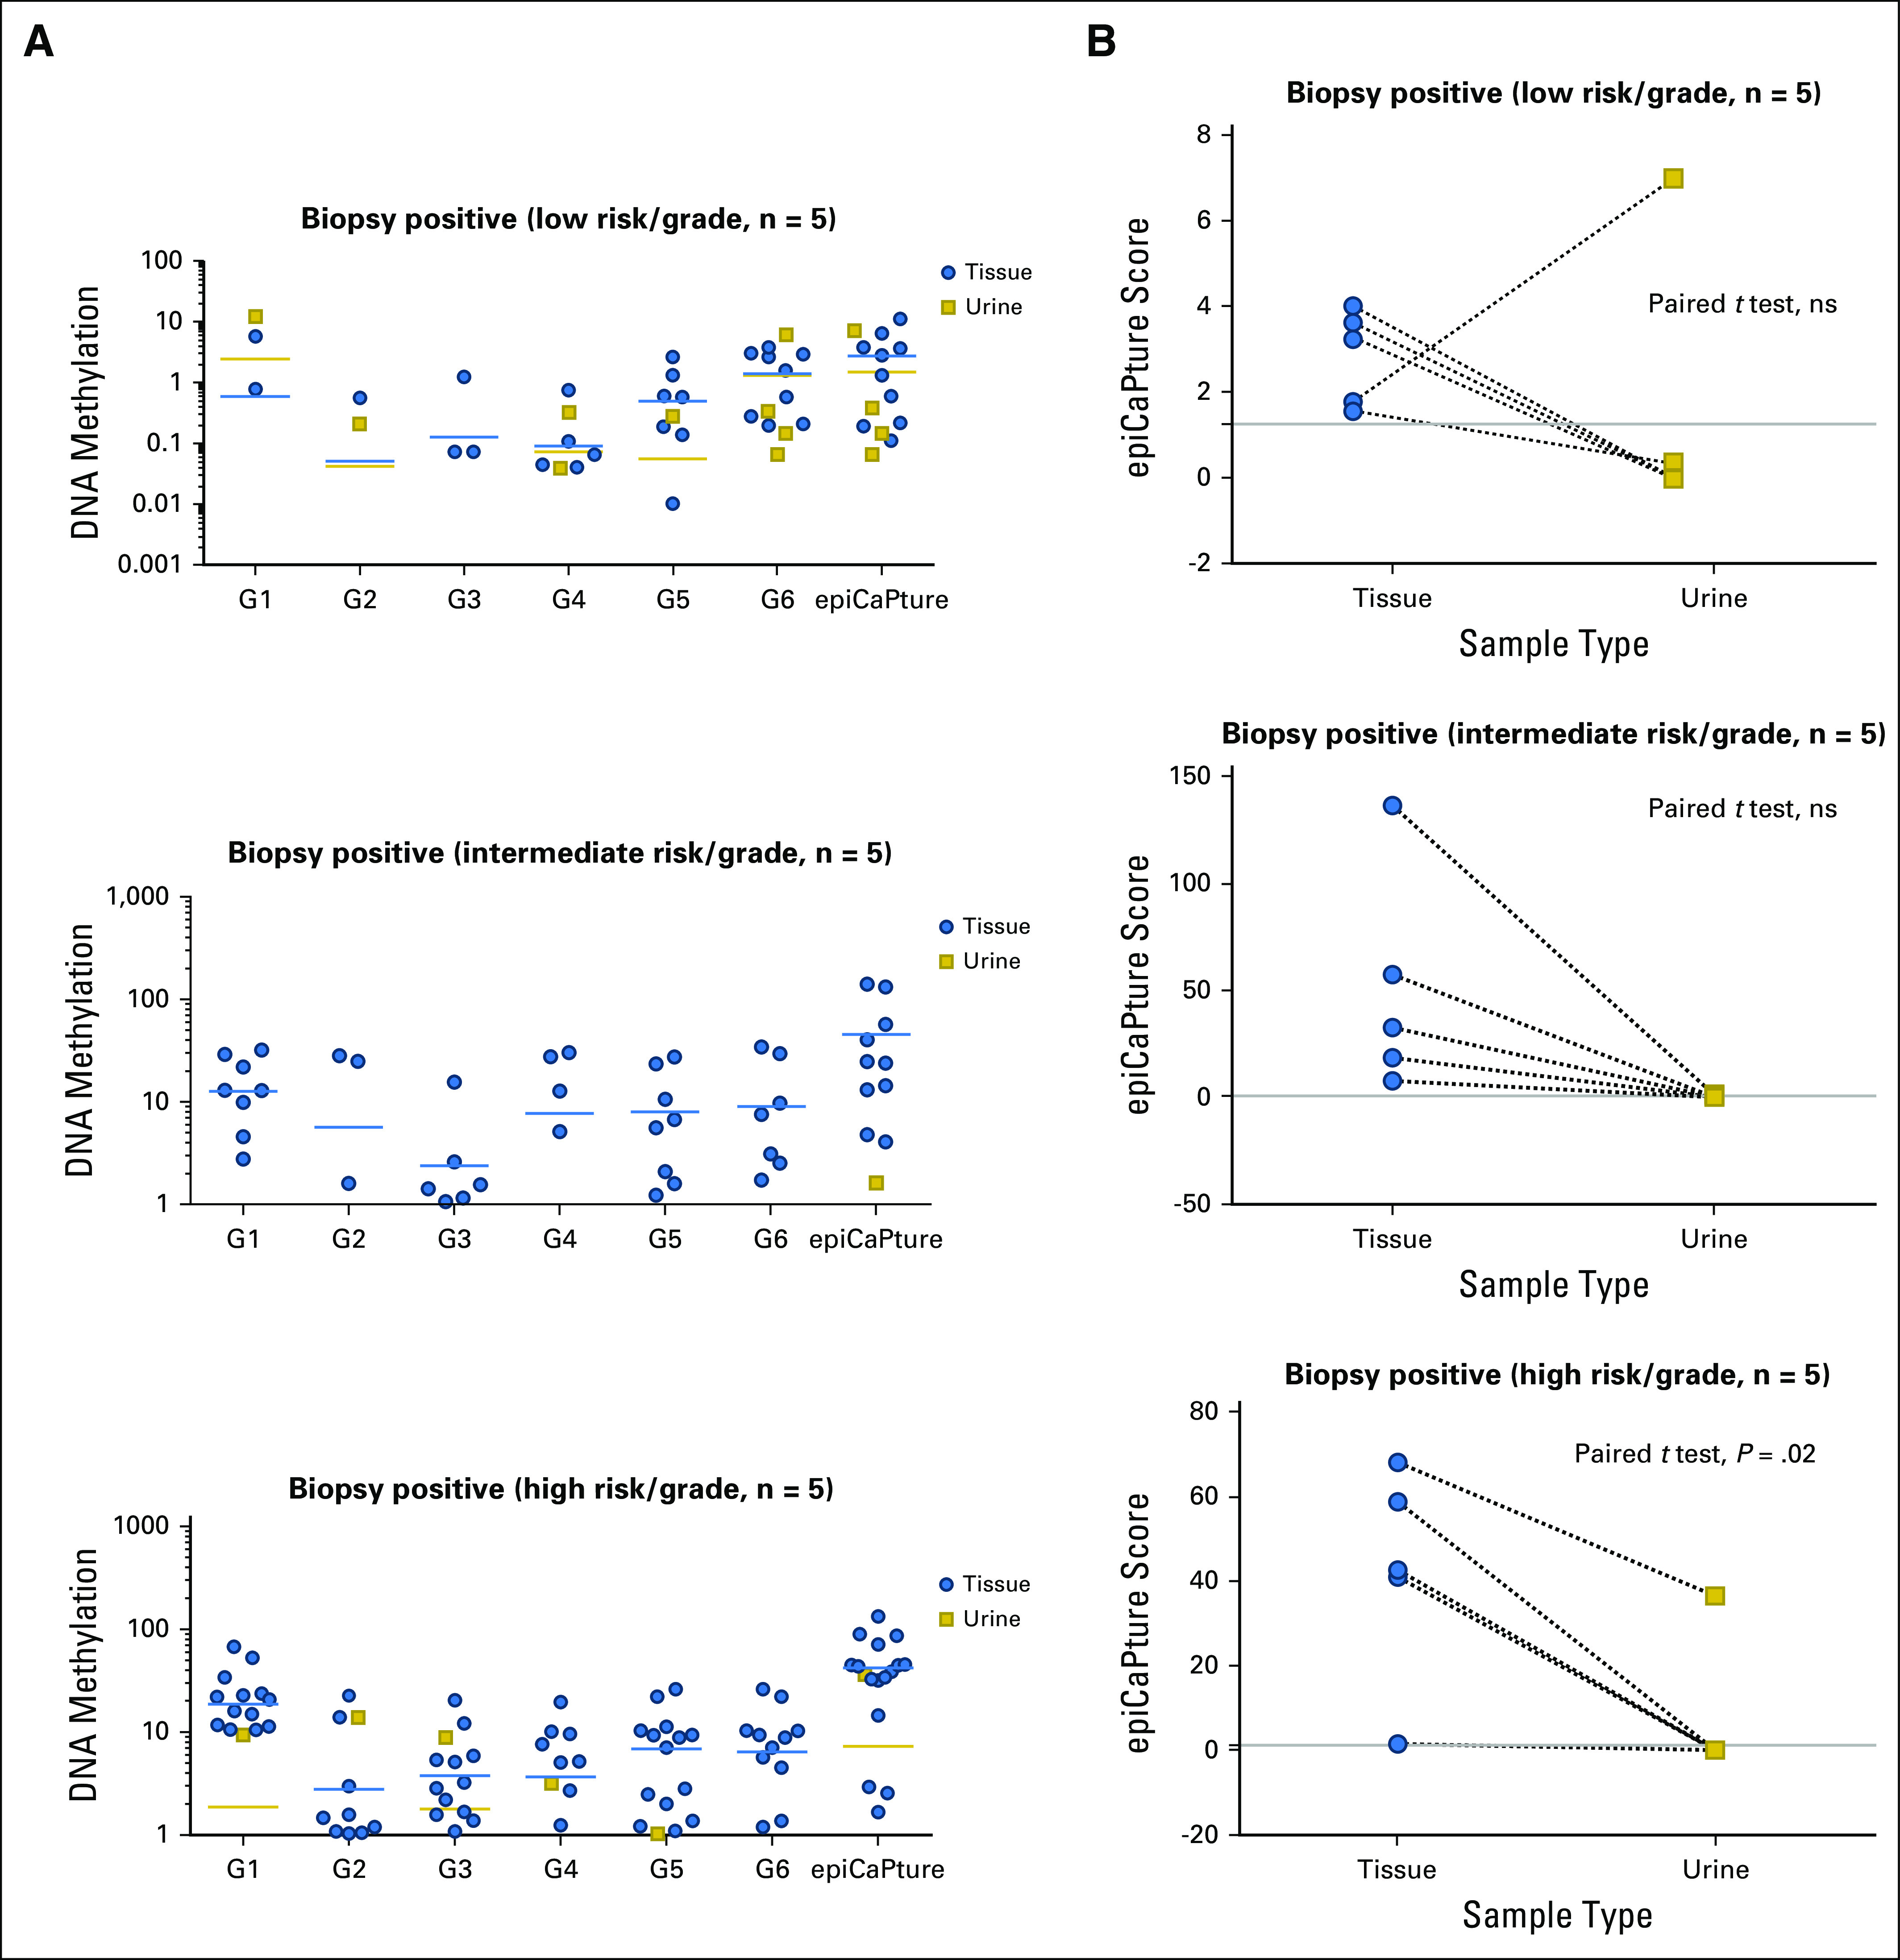
Results: Higher methylation of epiCaPture genes was significantly associated with increasing aggressiveness in PCa tissues. In urine, area under the receiver operating characteristic curve was 0.64, 0.86, and 0.83 for detecting PCa, high-grade PCa, and high-risk PCa, respectively. Decision curves revealed a net benefit across relevant threshold probabilities. Independent analysis of two epiCaPture genes in the same clinical cohort provided analytical validation. Parallel epiCaPture analysis in urine and matched biopsy cores showed added value of a liquid biopsy.

Conclusion: epiCaPture is a urine DNA methylation test for high-risk PCa. Its tumor specificity out-performs that of prostate-specific antigen (greater than 3 ng/mL). Used as an adjunct to prostate-specific antigen, epiCaPture could aid patient stratification to determine need for biopsy.


Conflict of interest statement

AUTHORS’ DISCLOSURES OF POTENTIAL CONFLICTS OF INTEREST The following represents disclosure information provided by authors of this manuscript. All relationships are considered compensated. Relationships are self-held unless noted. I = Immediate Family Member, Inst = My Institution. Relationships may not relate to the subject matter of this manuscript. For more information about ASCO’s conflict of interest policy, please refer to www.asco.org/rwc or ascopubs.org/po/author-center. Eve O’Reilly No relationship to disclose Alexandra V. Tuzova No relationship to disclose Anna L. Walsh No relationship to disclose Niamh M. Russell No relationship to disclose Odharnaith O’Brien No relationship to disclose Sarah Kelly No relationship to disclose Odharna Ni Dhomhnallain No relationship to disclose Liam DeBarra No relationship to disclose Connie M. Dale No relationship to disclose Rick Brugman No relationship to disclose Gavin Clarke No relationship to disclose Olivia Schmidt No relationship to disclose Shane O’Meachair No relationship to disclose Dattatraya Patil No relationship to disclose Kathryn L. Pellegrini No relationship to disclose Neil Fleshner Honoraria: Amgen, Janssen Oncology, Bayer, Sanofi, AbbVie, Ferring Pharmaceuticals, Astellas Medivation Consulting or Advisory Role: Hybridyne Health Research Funding: Ferring (Inst), Astellas Pharma (Inst), Janssen Oncology (Inst), Amgen (Inst), Nucleix (Inst), Progenix (Inst), Spectracure AB (Inst) Julia Garcia No relationship to disclose Fang Zhao No relationship to disclose Stephen Finn Honoraria: Roche Research Funding: Amgen (Inst) Travel, Accommodations, Expenses: Pfizer Robert Mills No relationship to disclose Marcelino Y. Hanna No relationship to disclose Rachel Hurst No relationship to disclose Elizabeth McEvoy No relationship to disclose William M. Gallagher Employment: OncoMark Leadership: OncoMark Stock and Other Ownership Interests: OncoMark Consulting or Advisory Role: Carrick Therapeutics Research Funding: Carrick Therapeutics Patents, Royalties, Other Intellectual Property: Two patents which have been licensed to OncoMark Travel, Accommodations, Expenses: OncoMark Rustom P. Manecksha Honoraria: Janssen, Boston Scientific Travel, Accommodations, Expenses: Ferring Pharmaceuticals, Astellas Pharma Colin S. Cooper Patents, Royalties, Other Intellectual Property: I have two patents for tests for aggressive prostate cancer filed in the past 2 years. These patents are not related to the current work. (Inst) Daniel S. Brewer Patents, Royalties, Other Intellectual Property: Patents held in drug discovery with Novartis (I), patents pending concerning cancer subtype detection and biomarkers with University of East Anglia Bharati Bapat No relationship to disclose Martin G. Sanda No relationship to disclose Jeremy Clark No relationship to disclose Antoinette S. Perry Patents, Royalties, Other Intellectual Property: University College Dublin holds a patent that relates to this work

Figures

Fig 1.
Fig 1.
Flow diagram of specimens used in the study. DRE, digital rectal examination; epiCaPture, Epigenetic Cancer of the Prostate Test in Urine; FFPE, formalin-fixed paraffin-embedded; GAP, Global Action Plan; PCR, polymerase chain reaction; TCGA, The Cancer Genome Atlas; TRUS, transrectal ultrasound.
Fig 2.
Fig 2.
Epigenetic Cancer of the Prostate Test in Urine (epiCaPture) gene validation in prostate tissue specimens. DNA methylation was measured using the Infinium HumanMethylation450 BeadChip (HM450k) in two independent cohorts of patients undergoing radical prostatectomy. (A) Laser capture microdissected enriched prostate epithelial cells from benign prostate tissue (procured from men undergoing radical cystoprostatectomy for bladder cancer, with no clinical or histologic evidence of prostate cancer [PCa]) and low-risk, aggressive, and metastatic PCa. (B) Data extracted from the TCGA repository for matched-benign prostate tissue and low-risk, significant, and high-risk PCa, all procured from men undergoing radical prostatectomy. A full description of the two cohorts is provided in the Data Supplement. Each data set was analyzed by one-way analysis of variance (ANOVA), followed by post hoc analyses using the Tukey-Kramer multiple comparisons test. Boxes indicate the 25th and 75th percentiles, the line represents the median, and the whiskers show the minimum and maximum value in each cohort of samples. Significance is indicated by *P < .05, **P < .01, and *** P < .001, and **** P < .0001
Fig 3.
Fig 3.
Epigenetic Cancer of the Prostate Test in Urine (epiCaPture) performance at noninvasive detection of prostate cancer in urine. The performance of epiCaPture compared with/in conjunction with prostate-specific antigen (PSA; treated as a continuous variable) in the test set (n = 134) for predicting each end point was assessed by receiver operating characteristic curves: (A) cancer (v no cancer detected on transrectal ultrasound biopsy), (B) high-grade cancer (Gleason score greater than or equal to 8 v all else), (C) D’Amico high-risk cancer (v all else), and (D) CAPRA (Cancer of the Prostate Risk Assesment) high-risk cancer (v all else). The distribution of epiCaPture scores in the whole study population (n = 453), viewed by (E) biopsy outcome, (F) Gleason grade, (G) risk categorization by D’Amico risk-classification systems, and (H) risk categorization by CAPRA risk-classification system. The epiCaPture score was calculated for each sample by summing the normalized index of methylation (Data Supplement) for G1 to G6. epiCaPture score distributions were analyzed by t test or one-way analysis of variance (ANOVA), followed by post hoc analyses using the Tukey-Kramer multiple comparisons test. For ease of interpretation, epiCaPture scores are plotted on a logarithmic axis, and samples that were negative (epiCaPture score = 0) are not shown. Solid black line represents the mean of each group. Dashed lines indicate the epiCaPture score thresholds derived in the training set to maximize both sensitivity and specificity. Significance is indicated by *P < .05, **P < .01, ***P < .001, and ****P < .0001. (I) Decision curve analysis demonstrated net clinical benefit of performing biopsy on patients in the test set on the basis of an epiCaPture score greater than 1.25 versus PSA greater than or equal to 3 ng/mL across a range of clinically relevant threshold probabilities (the risk of cancer, such that a patient would choose to undergo biopsy by weighing the relative harms of false-positive and false-negative predictions). The horizontal gray line represents the decision curve for the performing biopsy on no patients and the red line represents the decision curve for performing biopsy on all patients. (J) This translates to a net reduction in biopsies of approximately 15%, as compared with PSA, across a range of threshold probabilities. AUC, area under the receiver operating characteristic curve.
Fig 4.
Fig 4.
Robustness of Epigenetic Cancer of the Prostate Test in Urine (epiCaPture) assays by independent verification. (A) Two of the six epiCaPture assays (G1: GSTP1 and G5: APC) were analyzed independently in laboratories in Ireland (Perry) and Canada (Bapat) by quantitative methylation specific PCR in urine sediments from 236 of 453 men in the study. Relevant subsets were then considered by applying the study end points: (B) men with biopsy-positive disease, (C) men with high-grade (Gleason score greater than or equal to 8) prostate cancer, and men with high-risk prostate cancer defined by (D) D’Amico, and (E) CAPRA (Cancer of the Prostate Risk Assessment) classification. Data from the two laboratories are differentiated by the labels Perry and Bapat to indicate the principle investigator at each site. In each data set, the normalized index of methylation (NIM) and percent methylated ratio (PMR) represent the normalized data value for each sample. Correlation was calculated using Spearman rank correlation.
Fig 5.
Fig 5.
Parallel Epigenetic Cancer of the Prostate Test in Urine (epiCaPture) analysis in liquid and tissue biopsies. Prostate maps are for indicative purposes only and are not drawn to scale. A standard 12-core biopsy is illustrated. In some cases, more than 12 cores were taken. Tumor presence is denoted by pink (Gleason score 6), red (Gleason score 7), or brown (Gleason score greater than or equal to 8) circles, with size indicative of percentage tumor in each core. Dashed brown lines indicate cores that were used/combined for DNA extraction. epiCaPture analysis was performed in parallel on matched biopsy cores (circles) and prebiopsy urine (yellow square). The threshold for positivity (epiCaPture score greater than 1.25) is indicated on the graph. epiCaPture fingerprints indicate the relative contribution of each of the six genes to the epiCaPture score calculated for matched tissue cores and urine. (A) Low-risk prostate cancer SJH149 (62 years of age; prostate-specific antigen, 3.08 ng/mL) demonstrated that urine as a liquid biopsy is a viable alternative to sampling bias inherent to tissue needle biopsies. Original biopsy: tumor occupying less than 1% total volume in one of two cores on the left-hand side. DNA was extracted from cores B, C, and D + E + F. Repeat biopsy: tumor was present in the medial, anterior, and posterior of the right-hand side of the gland. (B) High-risk prostate cancer SJH189 (80 years of age; prostate-specific antigen, 6.63 ng/mL) demonstrated similar epiCaPture fingerprint across different tumor areas sampled on biopsy and in urine.
Fig A1.
Fig A1.
(A) The performance of epiCaPture compared to and in conjunction with prostate-specific antigen (PSA; treated as a continuous variable) in the test set (n = 134) for predicting ISUP group 3, 4 and 5 PCa on biopsy was assessed by receiver operator characteristic curves. (B) The distribution of epiCaPture scores in biopsy-negative (no cancer detected) v biopsy-positive patients, categorized by ISUP group, shows increasing methylation by group. Significance is indicated by ***P < .001 and ****P < .0001. ANOVA, analysis of variance; AUC, area under the receiver operating curve.
Fig A2.
Fig A2.
Parallel epiCaPture analysis in urine and matched biopsy cores. epiCaPture was performed in urine and matched formalin-fixed paraffin embedded biopsy cores from randomly selected biopsy-positive (n = 15: low-risk [CAPRA and D’Amico, Gleason score 6; intermediate risk, Gleason score 7; and high risk, Gleason score ≥ 8]) patients. (A) Parallel analysis of epiCaPture genes (G1-G6) in biopsy tissue cores and urine. DNA methylation of each gene is indicated by the NIM (normalised index of methylation), and for the collective panel, by the epiCaPture score (NIM sum G1-G6). Each point represents a single sample (biopsy core or urine), with the mean for each group indicated by a horizontal line (yellow, urine; blue, tissue). For ease of interpretation, DNA methylation is plotted on a logarithmic axis, and samples with no methylation are not shown. (B) Paired T tests on matched biopsy cores and urine reveal higher epiCaPture scores in tissues than in urine. For each patient, a single tissue epiCaPture score was calculated using the average across all cores studied (1-5). The epiCaPture threshold for urine positivity (1.25) is indicated by a gray line. ns, not significant.

References

    1. Ferlay J, Soerjomataram I, Ervik M, et al. GLOBOCAN 2012 v1.0, Cancer Incidence and Mortality Worldwide: IARC CancerBase No. 11. Lyon, France: International Agency for Research on Cancer; http://globocan.iarc.fr
    1. Siegel R, DeSantis C, Virgo K, et al. Cancer treatment and survivorship statistics, 2012. CA Cancer J Clin. 2012;62:220–241. - PubMed
    1. Wilt TJ, Jones KM, Barry MJ, et al. Follow-up of prostatectomy versus observation for early prostate cancer. N Engl J Med. 2017;377:132–142. - PubMed
    1. Nordström T, Vickers A, Assel M, et al. Comparison between the four-kallikrein panel and prostate health index for predicting prostate cancer. Eur Urol. 2015;68:139–146. - PMC - PubMed
    1. Roobol MJ, Vedder MM, Nieboer D, et al. Comparison of two prostate cancer risk calculators that include the prostate health index. Eur Urol Focus. 2015;1:185–190. - PubMed