

Geographic Disparity in Deceased Donor Liver Transplant Rates Following Share 35
- PMID: 30801545
- PMCID: PMC6699938
- DOI: 10.1097/TP.0000000000002643
Geographic Disparity in Deceased Donor Liver Transplant Rates Following Share 35
Abstract
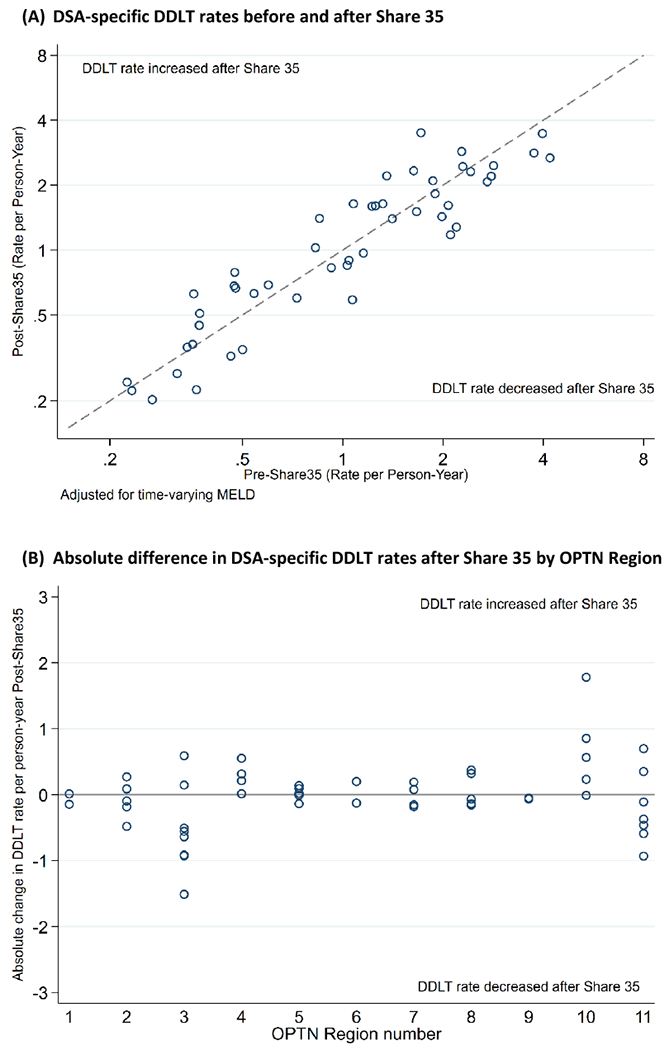
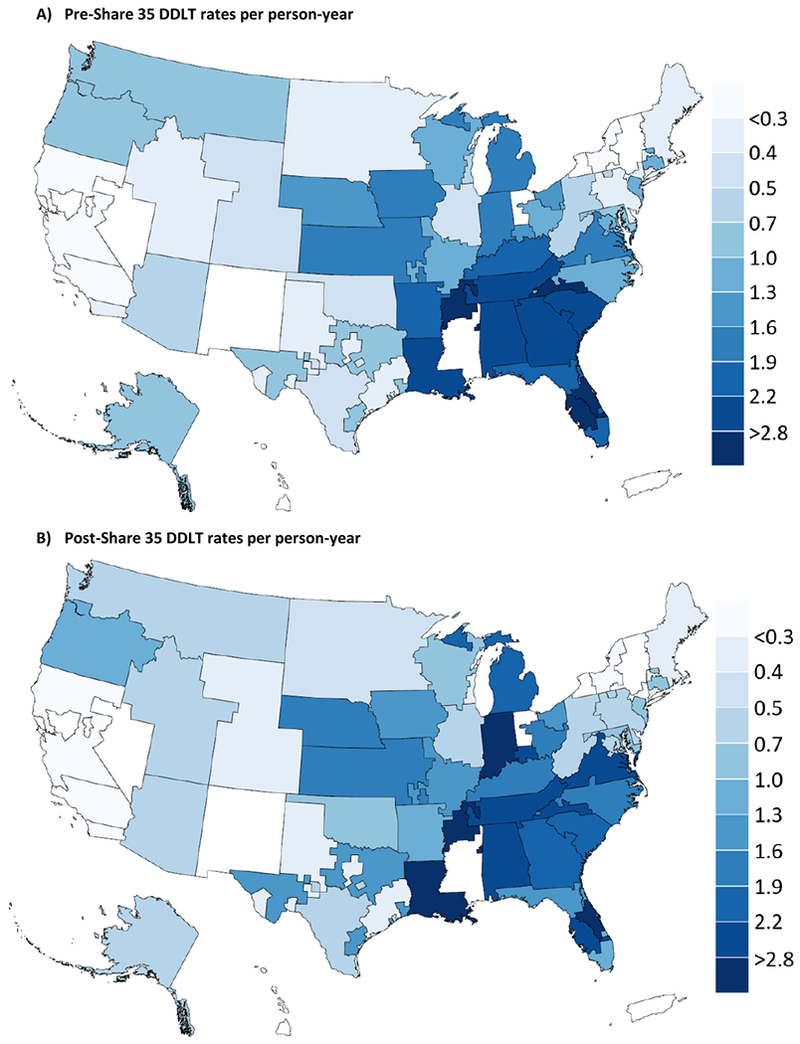
Background: The Organ Procurement and Transplantation Network implemented Share 35 on June 18, 2013, to broaden deceased donor liver sharing within regional boundaries. We investigated whether increased sharing under Share 35 impacted geographic disparity in deceased donor liver transplantation (DDLT) across donation service areas (DSAs).
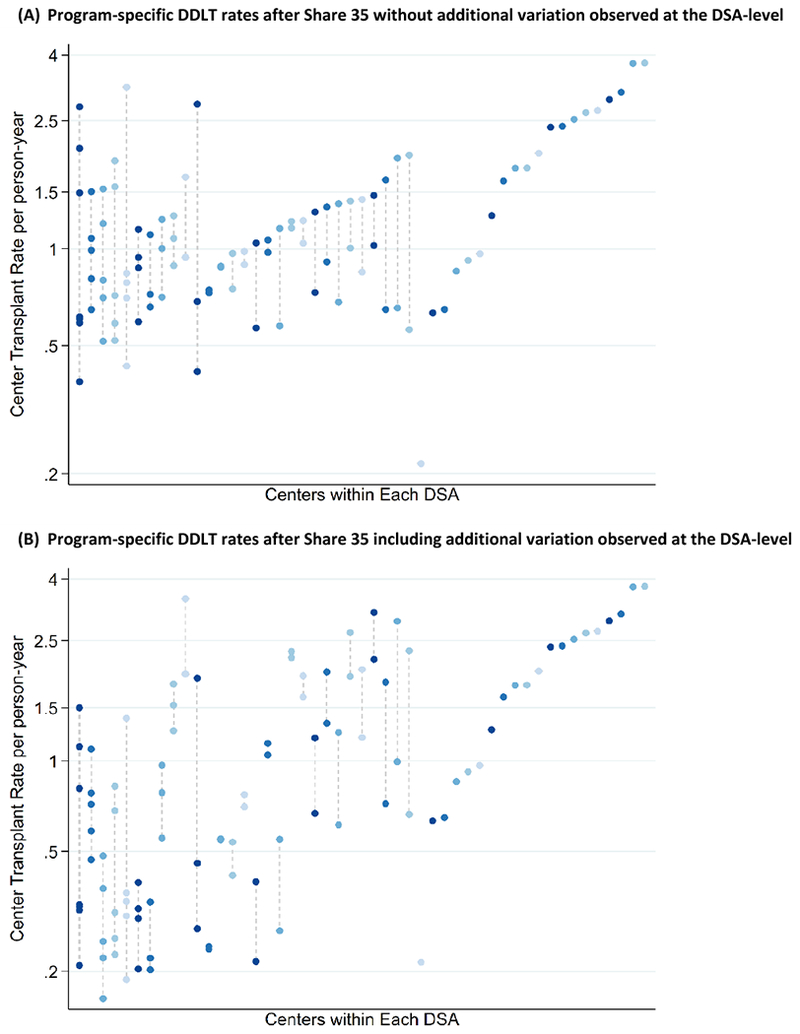
Methods: Using Scientific Registry of Transplant Recipients June 2009 to June 2017, we identified 86 083 adult liver transplant candidates and retrospectively estimated Model for End-Stage Liver Disease (MELD)-adjusted DDLT rates using nested multilevel Poisson regression with random intercepts for DSA and transplant program. From the variance in DDLT rates across 49 DSAs and 102 programs, we derived the DSA-level median incidence rate ratio (MIRR) of DDLT rates. MIRR is a robust metric of heterogeneity across each hierarchical level; larger MIRR indicates greater disparity.
Results: MIRR was 2.18 pre-Share 35 and 2.16 post-Share 35. Thus, 2 candidates with the same MELD in 2 different DSAs were expected to have a 2.2-fold difference in DDLT rate driven by geography alone. After accounting for program-level heterogeneity, MIRR was attenuated to 2.10 pre-Share 35 and 1.96 post-Share 35. For candidates with MELD 15-34, MIRR decreased from 2.51 pre- to 2.27 post-Share 35, and for candidates with MELD 35-40, MIRR increased from 1.46 pre- to 1.51 post-Share 35, independent of program-level heterogeneity in DDLT. DSA-level heterogeneity in DDLT rates was greater than program-level heterogeneity pre- and post-Share 35.
Conclusions: Geographic disparity substantially impacted DDLT rates before and after Share 35, independent of program-level heterogeneity and particularly for candidates with MELD 35-40. Despite broader sharing, geography remains a major determinant of access to DDLT.
Conflict of interest statement
DISCLOSURE
The authors declare no conflicts of interest. The data reported here have been supplied by the Minneapolis Medical Research Foundation (MMRF) as the contractor for the Scientific Registry of Transplant Recipients (SRTR). The interpretation and reporting of these data are the responsibility of the authors and in no way should be seen as an official policy of or interpretation by the SRTR, UNOS/OPTN, or the US Government.
Figures
Comment in
-
We (Now) Know What We Are, But Not What We May Be.Transplantation. 2019 Oct;103(10):1978-1979. doi: 10.1097/TP.0000000000002644. Transplantation. 2019. PMID: 31568230 No abstract available.
References
-
- Edwards EB, Harper AM, Hirose R, Mulligan DC. The impact of broader regional sharing of livers: 2-year results of “Share 35”. Liver Transpl. 2016;22(4):399–409. - PubMed
-
- Stine JG, Northup PG, Stukenborg GJ, et al. Geographic variation in liver transplantation persists despite implementation of Share35. Hepatol Res. 2018;48(4):225–232. - PubMed
Publication types
MeSH terms
Grants and funding
LinkOut - more resources
Full Text Sources
Medical
