. 2019 Jun;67(6):1076-1093.
doi: 10.1002/glia.23589. Epub 2019 Feb 23.

Gi/o protein-coupled receptors inhibit neurons but activate astrocytes and stimulate gliotransmission

Affiliations

Gi/o protein-coupled receptors inhibit neurons but activate astrocytes and stimulate gliotransmission

Caitlin A Durkee et al. Glia. 2019 Jun.

Abstract

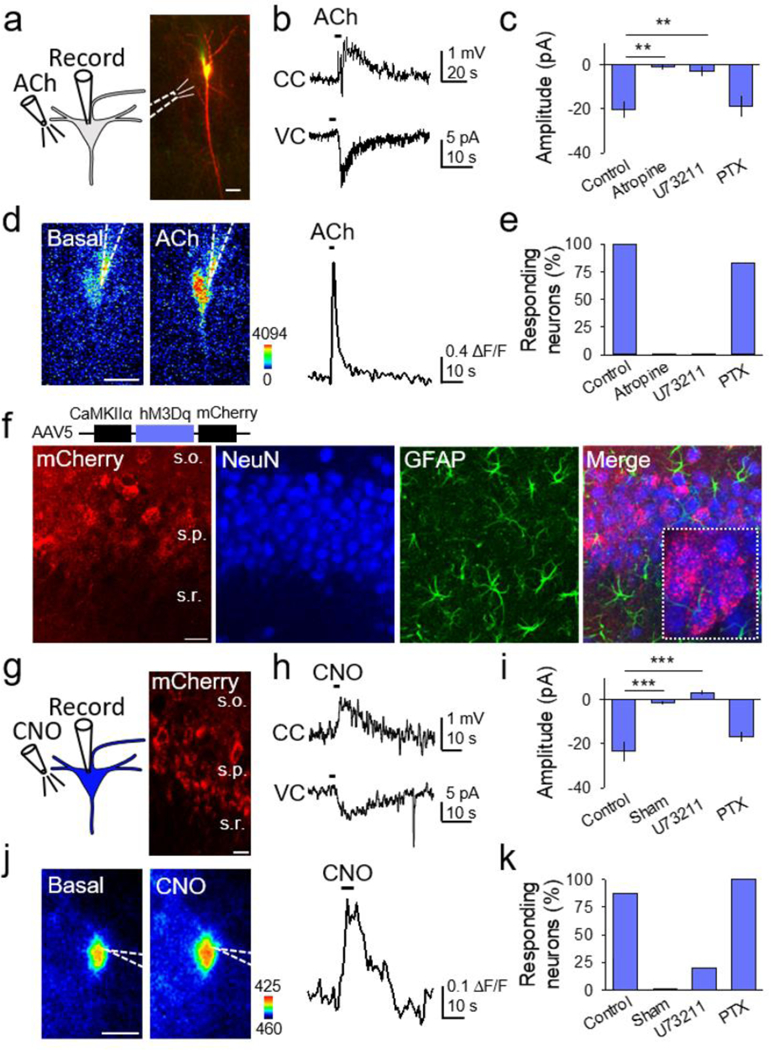
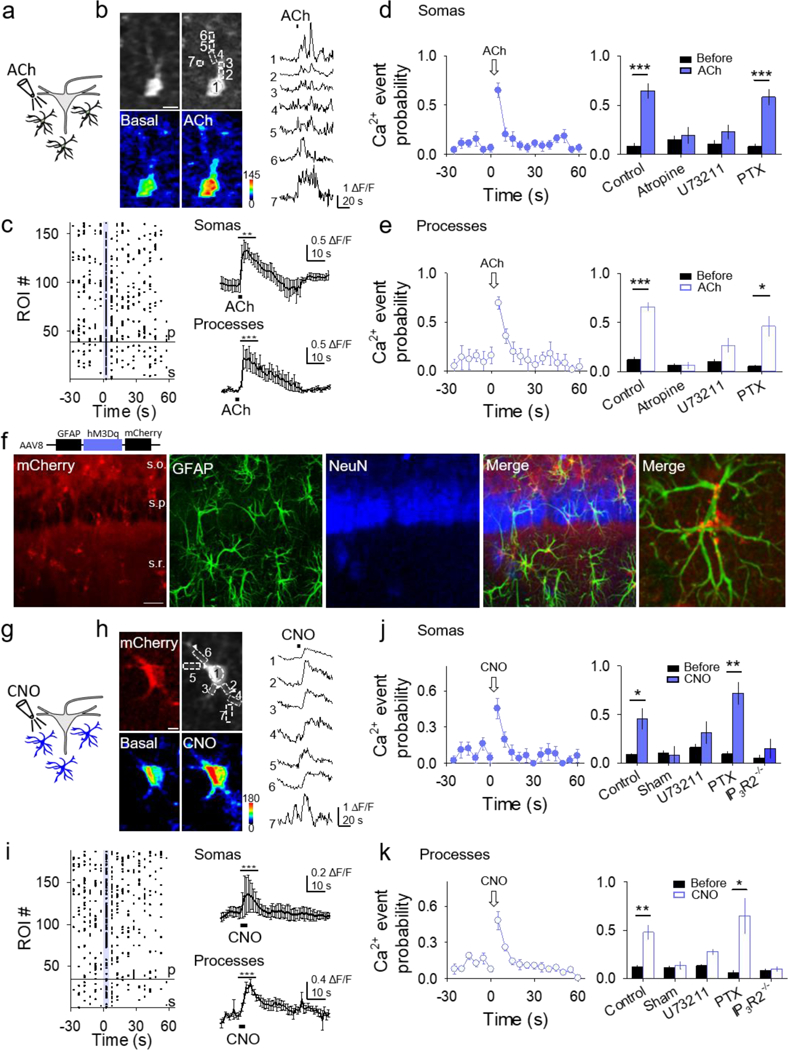
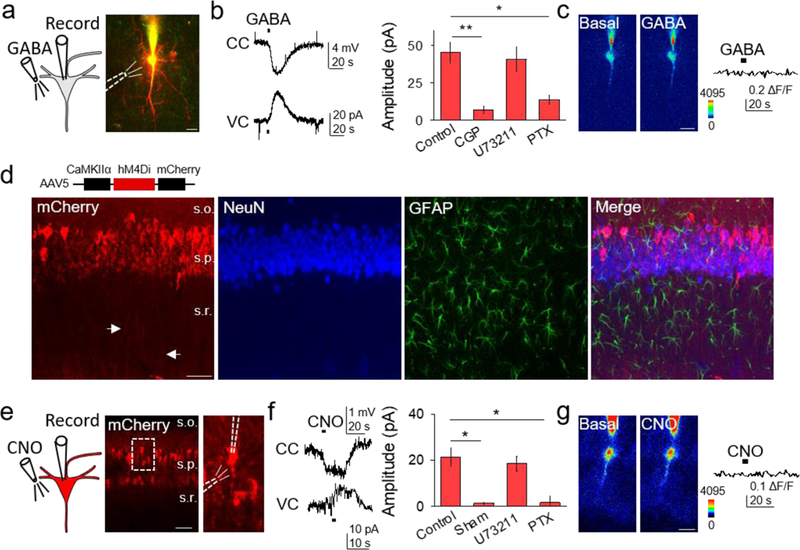
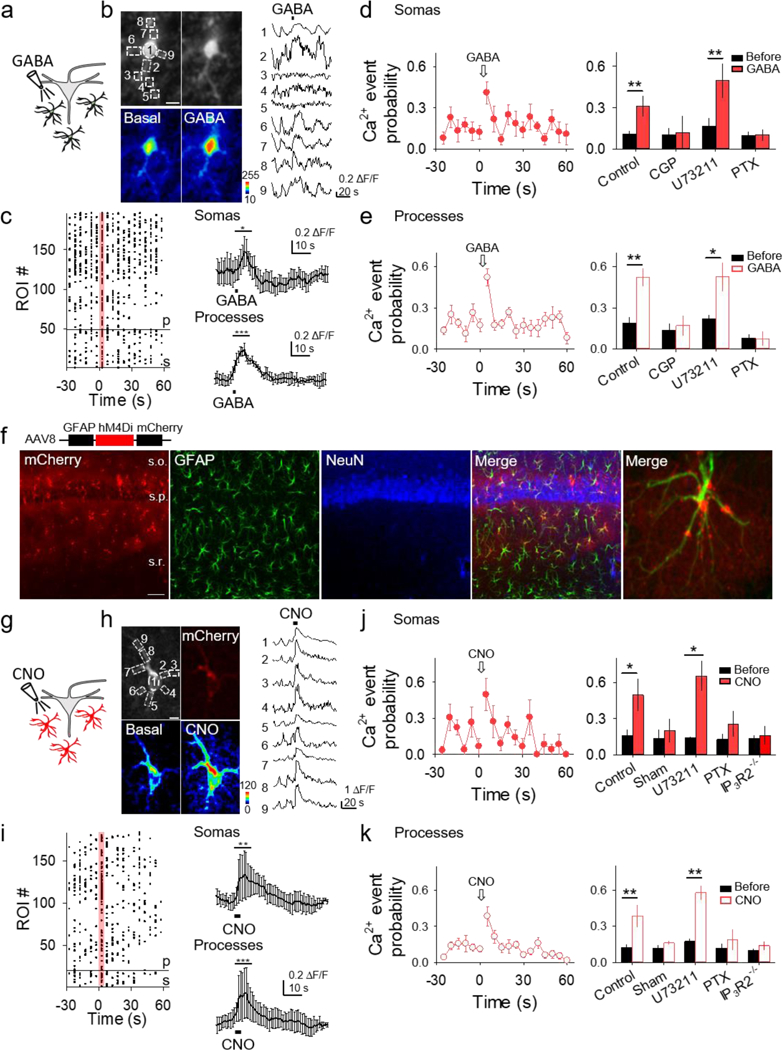
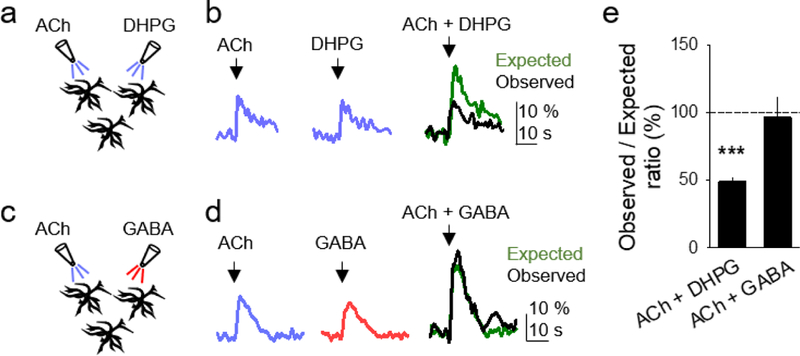
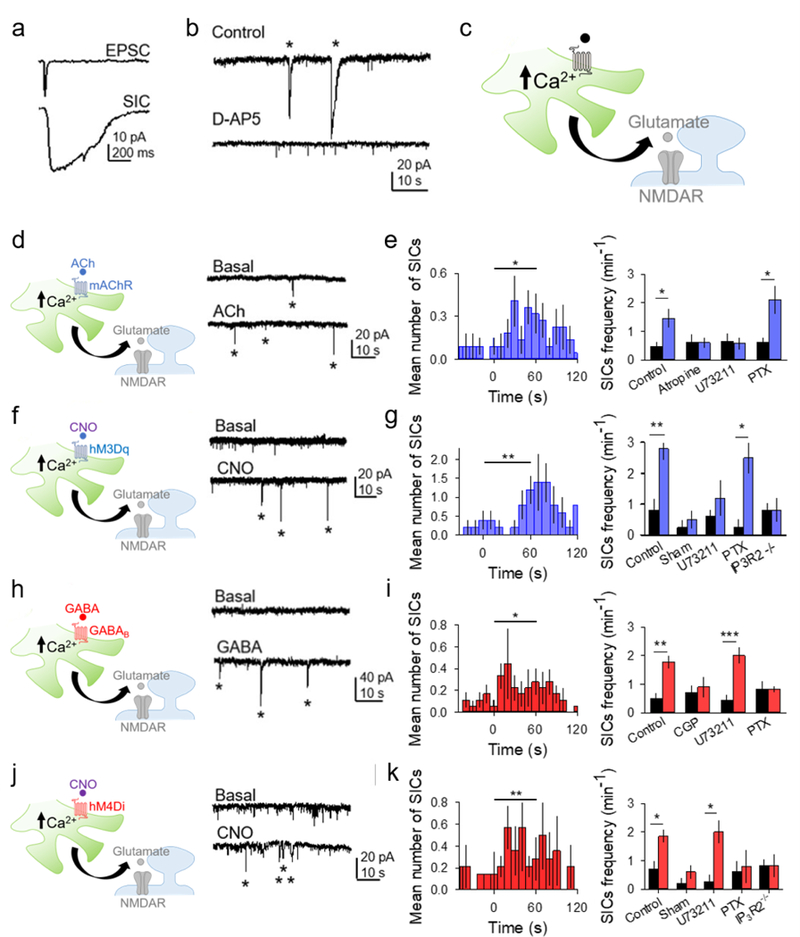
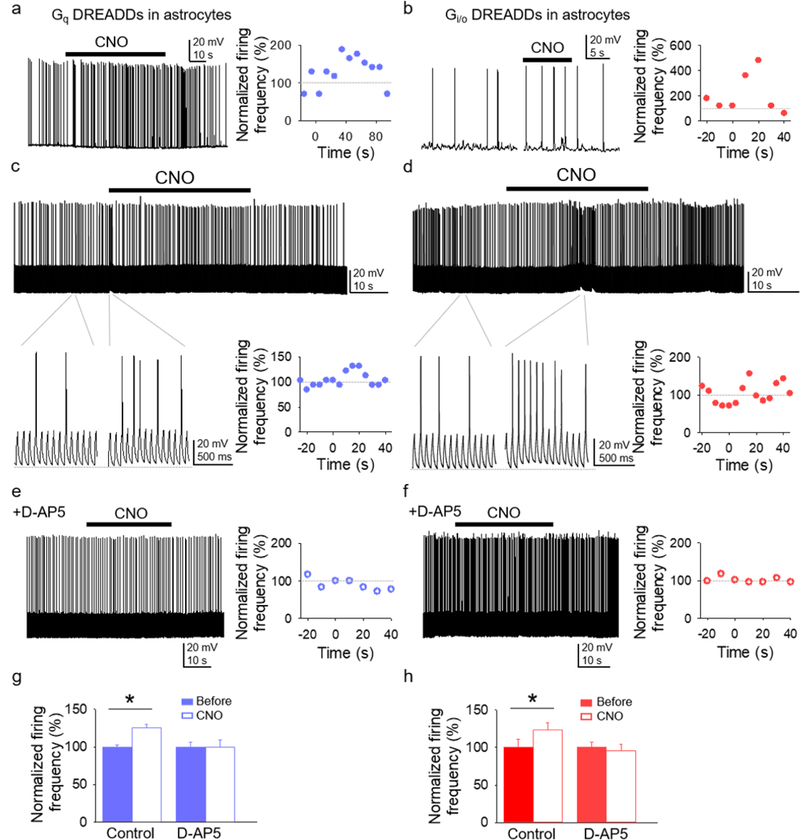
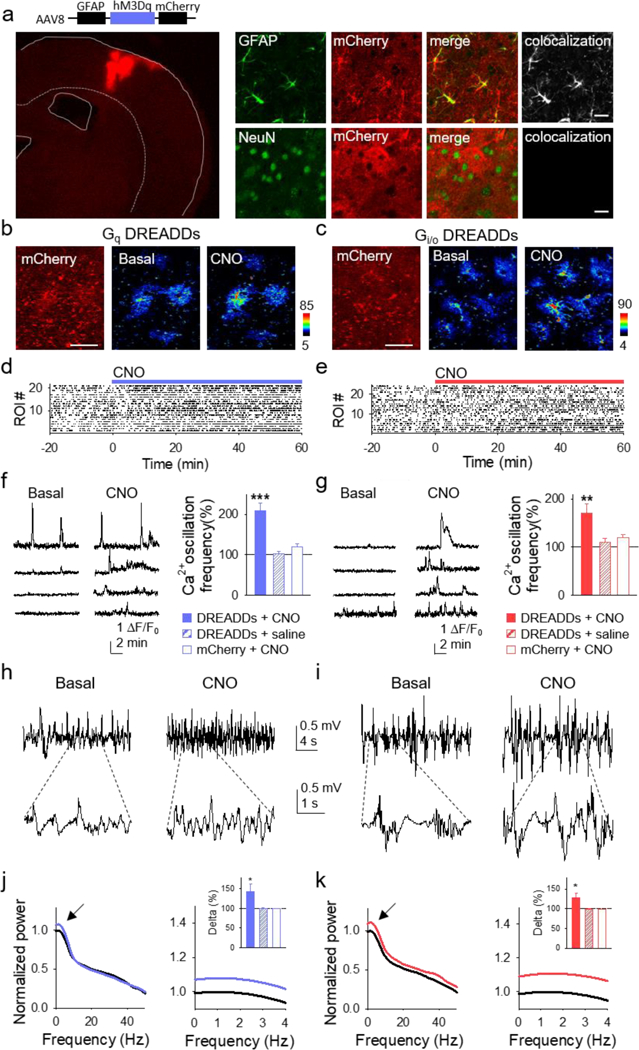
G protein-coupled receptors (GPCRs) play key roles in intercellular signaling in the brain. Their effects on cellular function have been largely studied in neurons, but their functional consequences on astrocytes are less known. Using both endogenous and chemogenetic approaches with DREADDs, we have investigated the effects of Gq and Gi/o GPCR activation on astroglial Ca2+ -based activity, gliotransmitter release, and the functional consequences on neuronal electrical activity. We found that while Gq GPCR activation led to cellular activation in both neurons and astrocytes, Gi/o GPCR activation led to cellular inhibition in neurons and cellular activation in astrocytes. Astroglial activation by either Gq or Gi/o protein-mediated signaling stimulated gliotransmitter release, which increased neuronal excitability. Additionally, activation of Gq and Gi/o DREADDs in vivo increased astrocyte Ca2+ activity and modified neuronal network electrical activity. Present results reveal additional complexity of the signaling consequences of excitatory and inhibitory neurotransmitters in astroglia-neuron network operation and brain function.

Keywords: DREADDs; G protein-coupled receptors; astrocyte Ca2+; astrocytes; gliotransmission.


Conflict of interest statement

DECLARATION OF INTERESTS

The authors declare no competing interests.

Figures

Figure 1.
Figure 1.. Gq signaling induces neuronal activation.
(A) Scheme of neuronal Gq GPCR activation by ACh, and TexasRed and Fluo4-filled CA1 neuron (scale bar, 20µm). (B) Representative traces showing effects of local ACh application in current clamp (CC) and voltage clamp (VC). (C) ACh-induced current amplitude in different conditions (Kruskal-Wallis One-way ANOVA, p < 0.001). (D) Pseudocolor Fluo4 fluorescence images before and after ACh application in the neuron depicted in (A) (scale bar, 20µm), and corresponding fluorescent Ca2+ trace. (E) Percentage of neurons that responded with a Ca2+ increase to ACh in different conditions. (F) Immunohistochemical images of hippocampus injected with AAV5-CaMKIIα-hM3Dq-mCherry. From left to right: mCherry, NeuN, GFAP and merge (scale bar, 25 μm; s.o., stratum oriens; s.p., stratum pyramidale; s.r., stratum radiatum). (G) Scheme of neuronal chemogenetic GqDREADD activation and image showing mCherry-expressing CA1 neurons (scale bar, 15 µm). (H) Representative traces showing effects of local CNO application in CC and VC. (I) CNO-induced current amplitude in different conditions (Kruskal-Wallis One-way ANOVA, p < 0.001). (J) Pseudocolor Fluo4 fluorescence image before and after CNO application (scale bar, 10µm), and corresponding fluorescent Ca2+ trace. (K) Percentage of neurons that responded with a Ca2+ increase to CNO in different conditions. Data are represented as mean ± SEM. P < 0.01 (**), and P < 0.001 (***).
Figure 2.
Figure 2.. Gq activation in astrocytes elevates their Ca2+ levels.
(A) Scheme of Gq GPCR activation in astrocytes by ACh locally applied over stratum radiatum astrocytes. (B) Fluorescence images of an astrocyte showing selected domains in soma and processes (top), pseudocolor Ca2+ images before (basal) and after local application of ACh (bottom) (scale bar, 5 μm), and Ca2+ traces from domains shown in top right panel. (C) Left: Raster plot showing Ca2+ events for each ROI (somas (s) below reference line, processes (p) above reference line). Right: Average Ca2+ traces from responding somas (top) and processes (bottom). T-test compares 10s before and 10s after agonist. (D and E) Ca2+ event probability in somas (D) and processes (E) vs. time, and maximum values in different conditions. (F) Immunohistochemical images of AAV8-GFAP-hM3Dq-mCherry expression in the hippocampus. From left to right: Expression of mCherry, GFAP, NeuN, a merge of all three, and a higher magnification merge image showing colocalization of GFAP and mCherry (25x; scale bar, 20 μm; s.o., stratum oriens; s.p., stratum pyramidale; s.r., stratum radiatum). (G-K) as (A-E) but with local application of CNO to GqDREADD expressing astrocytes instead of ACh. Data are represented as mean ± SEM. P < 0.05 (*), P < 0.01 (**), and P < 0.001 (***).
Figure 3.
Figure 3.. Gi/o activation in neurons is inhibitory.
(A) Scheme of neuronal Gi/o activation by GABA, and TexasRed and Fluo4-filled CA1 neuron (scale bar, 20μm). (B) Representative traces showing GABA-induced responses in current clamp (CC) and voltage clamp (VC), and GABA-induced current amplitude in different conditions (Kruskal-Wallis One-way ANOVA, p < 0.01, p < 0.05). (C) Pseudocolor Fluo4 images before and after GABA application from the neuron depicted in (A) (scale bar, 20µm), and the corresponding fluorescent Ca2+ trace. (D) Immunohistochemical images of AAV5-CaMKIIα-hM4Di-mCherry expression in hippocampus. From left to right: mCherry, NeuN, GFAP and merge (scale bar, 50 μm; s.o., stratum oriens; s.p., stratum pyramidale; s.r., stratum radiatum). (E) Scheme of neuronal chemogenetic Gi/oDREADD activation and fluorescent image showing mCherry-expressing neurons (scale bar, 50µm). (F) Representative traces showing CNO-evoked responses in CC and VC, and CNO-induced current amplitude in different conditions (Kruskal-Wallis One-way ANOVA, p < 0.05). (G) Pseudocolor Fluo4 images before and after CNO application (scale bar, 20µm), and corresponding fluorescent Ca2+ trace. Data are represented as mean ± SEM. P < 0.05 (*) and P < 0.01 (**).
Figure 4.
Figure 4.. Gi/o activation in astrocytes elevates their Ca2+ levels.
(A) Scheme of endogenous astrocyte Gi/o GPCR activation by GABA. (B) Fluorescence images of an astrocyte showing selected domains in soma and processes (top row), pseudocolor Ca2+ images before and after local application of GABA (bottom row; scale bar, 5 μm), and Ca2+ traces from domains shown in top left panel (right). (C) Left: Raster plot showing Ca2+ events for each ROI (somas (s) below reference line, processes (p) above reference line). Right: Average Ca2+ trace from responding somas (top) and processes (bottom). T-test compares 10s before and 10s after agonist. (D and E) Ca2+ event probability in somas (D) and processes (E) vs. time, and maximum values in different conditions. (F) Immunohistochemical images of AAV8-GFAP-hM4Di-mCherry expression in the hippocampus. From left to right: mCherry, GFAP, NeuN, a merge of all three, and a higher magnification merge image showing colocalization of GFAP and mCherry (25x; scale bar, 40 μm; s.o., stratum oriens; s.p., stratum pyramidale; s.r., stratum radiatum). (G-K) as (A-E) but with local application of CNO to Gi/oDREADD-expressing astrocytes instead of GABA. Data are represented as mean ± SEM. P < 0.05 (*), P < 0.01 (**), and P < 0.001 (***).
Figure 5.
Figure 5.. Gi/o and Gq GPCRs stimulate different signaling pathways that do not occlude.
(A and B) Scheme of experimental set-up, and astrocyte Ca2+ responses to ACh (left), DHPG (middle), and both simultaneously (right), showing the observed (black trace) and expected (green trace) responses. Expected response corresponds to the linear summation of the responses evoked by independent application of ACh and DHPG. (C and D) as in (A and B), but with GABA instead of DHPG. (E) Histogram of the ratio of the observed and expected Ca2+ responses evoked by simultaneous application of GPCR agonists in the different pharmacological conditions. Expected responses were considered the linear summation of the responses elicited by independent stimulation of the agonists. Data are represented as mean ± SEM. P < 0.001 (***).
Figure 6.
Figure 6.. Astrocyte activation via Gq and Gi/o DREADDs induces slow inward currents in neurons.
(A) Representative excitatory postsynaptic current (EPSC) and slow inward current (SIC) recorded from a CA1 pyramidal neuron. (B) Representative traces showing SICs (asterisks) in control and in D-AP5. (C) Scheme of neuronal-astroglial synaptic elements and gliotransmission. (D) Scheme and representative traces showing SICs (asterisks) before and after ACh application. (E) Left: Mean number of SICs vs. time, binned at 10s (ACh was applied at t=0). T-test compares one minute before and one minute after agonist. Right: SIC frequency (per min) one minute before and one minute after ACh in different conditions. Statistical significance was determined by the Student’s t-test comparing mean values one minute before and after agonist application. (F-G) as in (D-E) but with CNO application to GqDREADD-expressing astrocytes. (H-I) as in (D-E) but with GABA application instead of ACh. (J-K) as in (D-E) but with CNO application to Gi/oDREADD-expressing astrocytes. Data are represented as mean ± SEM. P < 0.05 (*), P < 0.01 (**), and P < 0.001 (***).
Figure 7.
Figure 7.. Astrocytic Gq and Gi/o DREADD activation increases neuronal action potential firing.
(A and B) Representative trace of spontaneous action potential firing of CA1 pyramidal neuron before and after CNO application to GqDREADD-expressing astrocytes (A) and Gi/oDREADD-expressing astrocytes (B), and the normalized (from basal) firing frequency vs. time. CNO application was at t=0 (as in the other panels). (C and D) Representative trace (top) of action potential firing induced by short depolarizing pulses before and after CNO application to GqDREADD-expressing astrocytes (C) and Gi/oDREADD-expressing astrocytes (D), expanded traces (bottom left panels), and normalized firing frequency vs. time (bottom right panels). (E and F) Response to CNO in the presence of D-AP5. (G and H) Normalized firing frequency before and after CNO application to GqDREADD-expressing astrocytes (G) and GqDREADD-expressing astrocytes (H) in control and D-AP5. Data are represented as mean ± SEM. P < 0.05 (*).
Figure 8.
Figure 8.. In vivo activation of both Gq and Gi/o DREADDs in astrocytes elevates their Ca2+ levels and regulates neuronal electrical activity.
(A) Immunohistochemical representative image of GqDREADDs virus injected into the primary somatosensory cortex staining for neurons (NeuN; blue), astroglia (GFAP; green), the reporter mCherry (red), and colocalization of mCherry with GFAP (top) and NeuN (bottom; scale bar, 20 μm). (B and C) Left: Representative images of mCherry in astrocytes reporting expression of GqDREADDs and Gi/oDREADDs (scale bar, 50 μm). Pseudocolor Ca2+images before (middle) and after (right) intraperitoneal injection (i.p.) of CNO. (D and E) Raster plots of Ca2+ events before and after i.p. injection of CNO in mice with astrocytes expressing Gq and Gi/oDREADDs, respectively. (F and G) Representative Ca2+ traces during basal (left) and after i.p. CNO injection (right) in GqDREADD- (F) and Gi/oDREADD-injected (G) mice. Ca2+ oscillation frequency normalized to baseline for DREADDs-infected cortex with i.p. CNO injections (solid bars), for DREADDs-infected cortex with i.p. saline injections (hashed bars), and for mCherry control-infected cortex with i.p. CNO injections (unfilled bars) for GqDREADDs- (F) and Gi/oDREADDs-injected (G) mice. (H and I) Representative cortical local field potential recordings prior to CNO (left) and after (right) in GqDREADDs- (H) and Gi/oDREADDs-injected (I) mice. Lowpass filtered at 40Hz. (J and K) Normalized power spectrum of cortical local field potentials before (black) and after CNO in GqDREADDs- (J: blue) and Gi/oDREADDs-injected (K: red) mice. Normalized power spectrum of slow-wave delta (0–4 Hz) activity for DREADDs-infected cortex with i.p. CNO injections (solid bars), DREADDs-infected cortex with i.p. saline injections (hashed bars), and mCherry control-infected cortex with i.p. CNO injections for GqDREADDs- (J) and Gi/oDREADDs-injected (K) mice. Error bars are SEM. P < 0.05 (*), P < 0.01 (**), and P < 0.001 (***).

Similar articles

Cited by

References

    1. Adamsky A, Kol A, Kreisel T, Doron A, Ozeri-Engelhard N, Melcer T, . . . Goshen I (2018). Astrocytic Activation Generates De Novo Neuronal Potentiation and Memory Enhancement. Cell. doi:10.1016/j.cell.2018.05.002 - DOI - PubMed
    1. Agarwal A, Wu PH, Hughes EG, Fukaya M, Tischfield MA, Langseth AJ, . . . Bergles DE (2017). Transient Opening of the Mitochondrial Permeability Transition Pore Induces Microdomain Calcium Transients in Astrocyte Processes. Neuron, 93(3), 587-605 e587. doi:10.1016/j.neuron.2016.12.034 - DOI - PMC - PubMed
    1. Agulhon C, Boyt KM, Xie AX, Friocourt F, Roth BL, & McCarthy KD (2013). Modulation of the autonomic nervous system and behaviour by acute glial cell Gq protein-coupled receptor activation in vivo. J Physiol, 591(22), 5599–5609. doi:10.1113/jphysiol.2013.261289 - DOI - PMC - PubMed
    1. Aiken SP, Lampe BJ, Murphy PA, & Brown BS (1995). Reduction of spike frequency adaptation and blockade of M-current in rat CA1 pyramidal neurones by linopirdine (DuP 996), a neurotransmitter release enhancer. Br J Pharmacol, 115(7), 1163–1168. - PMC - PubMed
    1. Alexander GM, Rogan SC, Abbas AI, Armbruster BN, Pei Y, Allen JA, . . . Roth BL. (2009). Remote control of neuronal activity in transgenic mice expressing evolved G protein-coupled receptors. Neuron, 63(1), 27–39. doi:10.1016/j.neuron.2009.06.014 - DOI - PMC - PubMed

Publication types

MeSH terms

Substances