

Physical Activity Energy Expenditure and Total Daily Energy Expenditure in Successful Weight Loss Maintainers
- PMID: 30801984
- PMCID: PMC6392078
- DOI: 10.1002/oby.22373
Physical Activity Energy Expenditure and Total Daily Energy Expenditure in Successful Weight Loss Maintainers
Abstract
Objective: The objective of this study was to compare physical activity energy expenditure (PAEE) and total daily energy expenditure (TDEE) in successful weight loss maintainers (WLM) with normal weight controls (NC) and controls with overweight/obesity (OC).
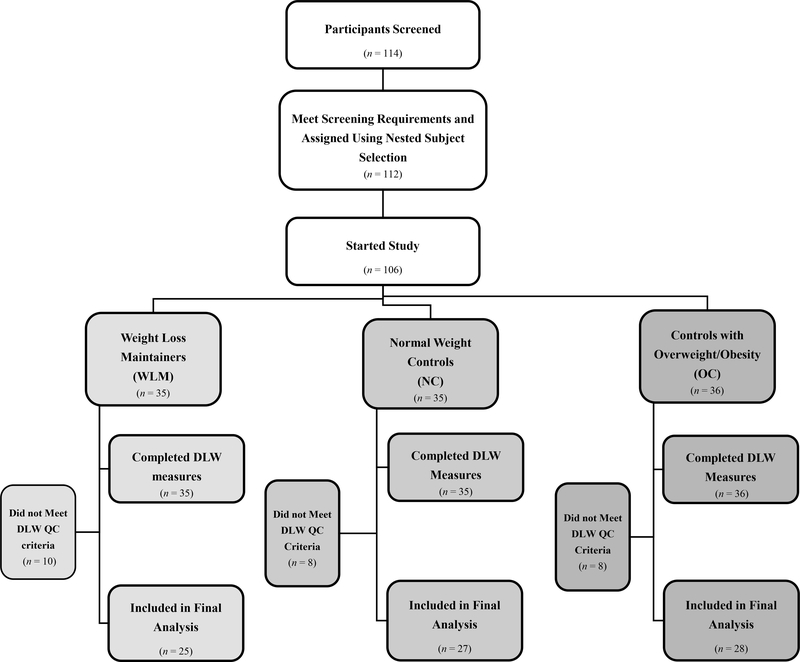
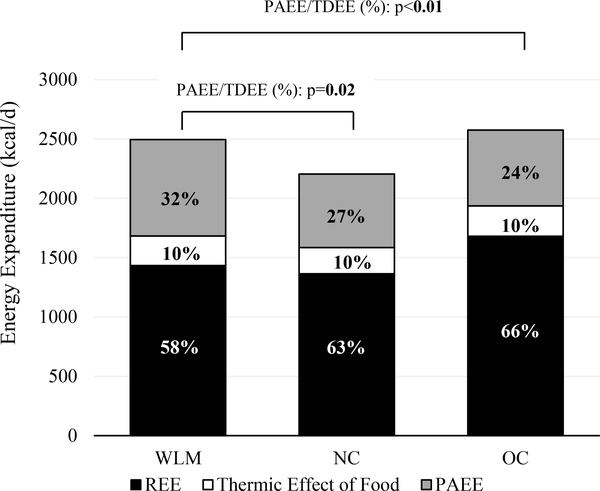
Methods: Participants were recruited in three groups: WLM (n = 25, BMI 24.1 ± 2.3 kg/m2 ; maintaining ≥ 13.6-kg weight loss for ≥ 1 year), NC (n = 27, BMI 23.0 ± 2.0 kg/m2 ; similar to current BMI of WLM), and OC (n = 28, BMI 34.3 ± 4.8 kg/m2 ; similar to pre-weight loss BMI of WLM). TDEE was measured using the doubly labeled water method. Resting energy expenditure (REE) was measured using indirect calorimetry. PAEE was calculated as (TDEE - [0.1 × TDEE] - REE).
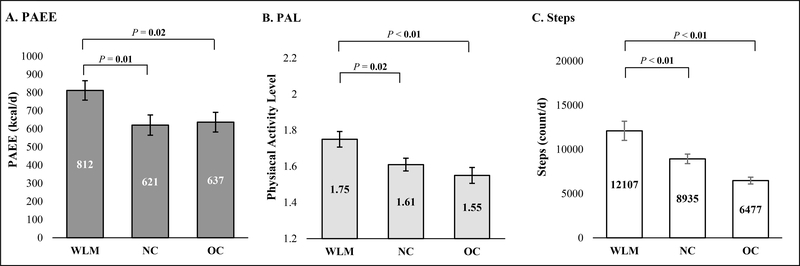
Results: PAEE in WLM (812 ± 268 kcal/d, mean ± SD) was significantly higher compared with that in both NC (621 ± 285 kcal/d, P < 0.01) and OC (637 ± 271 kcal/d, P = 0.02). As a result, TDEE in WLM (2,495 ± 366 kcal/d) was higher compared with that in NC (2,195 ± 521 kcal/d, P = 0.01) but was not significantly different from that in OC (2,573 ± 391 kcal/d).
Conclusions: The high levels of PAEE and TDEE observed in individuals maintaining a substantial weight loss (-26.2 ± 9.8 kg maintained for 9.0 ± 10.2 years) suggest that this group relies on high levels of energy expended in physical activity to remain in energy balance (and avoid weight regain) at a reduced body weight.
Trial registration: ClinicalTrials.gov NCT03422380.
© 2019 The Obesity Society.
Figures
Comment in
-
Exercise is the Key to Keeping Weight Off, but What is the Key to Consistently Exercising?Obesity (Silver Spring). 2019 Mar;27(3):361. doi: 10.1002/oby.22429. Obesity (Silver Spring). 2019. PMID: 30801986 No abstract available.
References
-
- Ballor DL, Poehlman ET. A meta-analysis of the effects of exercise and/or dietary restriction on resting metabolic rate. Eur J Appl Physiol Occup Physiol. 1995;71(6):535–542. PubMed PMID: . - PubMed
-
- Astrup A, Gotzsche PC, van de Werken K, et al. Meta-analysis of resting metabolic rate in formerly obese subjects. Am J Clin Nutr. 1999;69(6):1117–1122. PubMed PMID: . - PubMed
Publication types
MeSH terms
Associated data
Grants and funding
LinkOut - more resources
Full Text Sources
Other Literature Sources
Medical
Research Materials
