. 2019 Apr;6(2):416-427.
doi: 10.1002/ehf2.12414. Epub 2019 Feb 23.

Worsening renal failure in patients with acute heart failure: the importance of cardiac biomarkers

Affiliations

Worsening renal failure in patients with acute heart failure: the importance of cardiac biomarkers

Akihiro Shirakabe et al. ESC Heart Fail. 2019 Apr.

Abstract

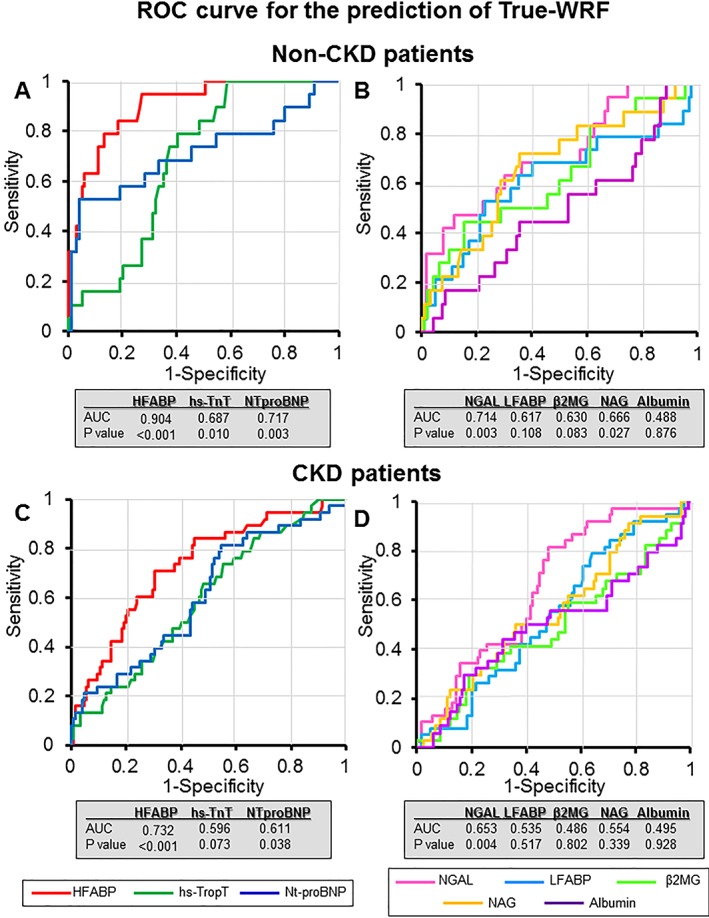
Aims: The importance of true worsening renal failure (WRF), which is associated with a poor prognosis, had been suggested in patients with acute heart failure (AHF). The aim of the present study was to establish the biomarker strategy for the prediction of true WRF in AHF.

Methods and results: Two hundred eighty-one patients with AHF were analysed. Their biomarkers were measured within 30 min of admission. Patients were assigned to the non-WRF (n = 168), pseudo-WRF (n = 56), or true-WRF (n = 57) groups using the criteria of both acute kidney injury on admission and increasing serum creatinine value during the first 7 days. A Kaplan-Meier curve showed that the survival and heart failure event rate of the true-WRF group within 1000 days was significantly lower than that of the non-WRF and pseudo-WRF groups (P ≤ 0.001). The multivariate Cox regression model also indicated that true WRF was an independent predictor of 1000 day mortality and heart failure events [hazard ratio: 4.315, 95% confidence interval (CI): 2.466-7.550, P ≤ 0.001, and hazard ratio: 2.834, 95% CI: 1.893-4.243, P ≤ 0.001, respectively]. The serum heart-type fatty acid-binding protein (s-HFABP) levels were significantly higher in the true-WRF group than in the non-WRF and pseudo-WRF groups (P ≤ 0.001). The multivariate logistic regression model indicated that the predictive biomarker for the true-WRF group was the s-HFABP level (odds ratio: 5.472, 95% CI: 2.729-10.972, P ≤ 0.001). The sensitivity and specificity for indicating the presence of true WRF were 73.7% and 76.8% (area under the curve = 0.831) for s-HFABP in whole patients, respectively, and 94.7% and 72.7% (area under the curve = 0.904) in non-chronic kidney disease (CKD) patients, respectively.

Conclusions: Cardiac biomarkers, especially the s-HFABP, might predict the development of true WRF in AHF patients. Furthermore, the predictive value was higher in AHF patients without CKD than in those with CKD.

Keywords: Acute kidney injury; Heart-type fatty acid-binding protein; Liver fatty acid-binding protein; Mortality; Neutrophil gelatinase-associated lipocalin.


Conflict of interest statement

The authors declare no conflicts of interest in association with the present study.

Figures

Figure 1
Figure 1
This study evaluated the relationship between worsening renal failure (WRF) and acute kidney injury (AKI) on admission and the biomarkers. This is a schematic illustration of the group assignment. The patients were assigned to four categories on the basis of the WRF and AKI status at admission. The patients without AKI who did not develop WRF during the first 7 days were assigned to the no‐WRF/no‐AKI (n = 117) group, and the patients without AKI who did develop WRF were assigned to the WRF/no‐AKI (n = 56) group. The AKI patients who did not develop WRF during the first 7 days were assigned to the no‐WRF/AKI (n = 51) group, and the AKI patients who did develop WRF were assigned to the WRF/AKI (n = 57) group. We defined no‐WRF as no‐WRF/no‐AKI and no‐WRF/AKI, pseudo‐WRF as WRF/no‐AKI, and true WRF as WRF/AKI. AKI was defined as an increase in the serum creatinine value of ≥0.3 mg/dL or ≥1.5‐fold on admission vs. the minimum creatinine values during hospitalization. WRF was defined as an increase in the serum creatinine value of ≥0.3 mg/dL during the first 7 days in comparison with the admission creatinine value. The patients who underwent continuous renal replacement therapy (CRRT) on the admission date were defined as having AKI at admission, and those who underwent CRRT during the first 7 days were defined as having WRF. KDIGO, Kidney Disease: Improving Global Outcomes; s‐cr, serum creatinine value.
Figure 2
Figure 2
Kaplan–Meier survival curves for each worsening renal failure (WRF) category. (A) The rate of all‐cause death in the true‐WRF group was significantly (P < 0.001) poorer than that in the pseudo‐WRF and non‐WRF groups. (B) The rate of heart failure (HF) events in the true‐WRF group was significantly (P < 0.001) poorer than that in the pseudo‐WRF and non‐WRF groups.
Figure 3
Figure 3
A receiver operating characteristic (ROC) curve analysis for the prediction of true worsening renal failure (WRF). (A) The ROC curve analysis of the cardiac biomarkers, including the serum heart‐type fatty acid‐binding protein (HFABP) (red line), N‐terminal pro‐brain‐type natriuretic peptide (NT‐proBNP) (blue line), and high‐sensitivity troponin T (hsTnT) (green line), for predicting true WRF. The sensitivity and specificity for indicating the presence of true WRF were 73.7% and 76.8% [area under the ROC curve (AUC) = 0.811, P < 0.001] for serum HFABP, 75.4% and 55.8% (AUC = 0.673, P < 0.001) for serum NT‐proBNP, and 87.7% and 37.5% (AUC = 0.637, P = 0.001) for serum hsTnT, respectively. (B) The ROC curve analysis of the renal urinary biomarkers, including the urinary neutrophil gelatinase‐associated lipocalin (NGAL) (pink line), the urinary liver fatty acid‐binding protein (LFABP) (light blue line), the urinary β2‐microglobulin (β2MG) (light green line), the urinary acetyl‐β‐d‐glucosaminidase (NAG) (orange line), and the urinary albumin (purple line), for predicting true WRF. The sensitivity and specificity for indicating the presence of true WRF was 76.9% and 55.1% (AUC = 0.677, P < 0.001) for urinary NGAL, 84.6% and 31.7% (AUC = 0.578, P = 0.082) for urinary LFABP, 42.3% and 73.7% (AUC = 0.542, P = 0.353) for urinary β2MG, 53.8% and 66.8% (AUC = 0.591, P = 0.043) for urinary NAG, and 25.0% and 85.4% (AUC = 0.495, P = 0.913) for urinary albumin, respectively.
Figure 4
Figure 4
A receiver operating characteristic (ROC) curve analysis for the prediction of true worsening renal failure (WRF) in patients with non‐chronic kidney disease (CKD) and CKD. The ROC curve analysis of the cardiac biomarkers, including the serum heart‐type fatty acid‐binding protein (HFABP) (red line), N‐terminal pro‐brain‐type natriuretic peptide (NT‐proBNP) (blue line), and the high‐sensitivity troponin T (hsTnT) (green line), for predicting true WRF are shown in (A) and (C). The ROC curve analysis of the renal urinary biomarkers, including the urinary neutrophil gelatinase‐associated lipocalin (NGAL) (pink line), urinary liver fatty acid‐binding protein (LFABP) (light blue line), urinary β2‐microglobulin (β2MG) (light green line), urinary acetyl‐β‐d‐glucosaminidase (NAG) (orange line), and urinary albumin (purple line), for predicting true WRF are shown in (B) and (D). (A) The area under the ROC curve (AUC) for serum HFABP, NT‐proBNP, and hsTnT in non‐CKD patients was 0.904 (P < 0.001), 0.687 (P = 0.010), and 0.717 (P = 0.003), respectively. (B) The AUC for urinary NGAL, LFABP, NAG, β2MG, and albumin in non‐CKD patients was 0.714 (P = 0.003), 0.617 (P = 0.108), 0.630 (P = 0.083), 0.666 (P = 0.027), and 0.488 (P = 0.876), respectively. (C) The AUC for serum HFABP, NT‐proBNP, and hsTnT in CKD patients was 0.732 (P < 0.001), 0.596 (P = 0.073), and 0.611 (P = 0.038), respectively. (D) The AUC for urinary NGAL, LFABP, NAG, β2MG, and albumin in CKD patients was 0.653 (P = 0.004), 0.535 (P = 0.517), 0.486 (P = 0.802), 0.554 (P = 0.339), and 0.495 (P = 0.928), respectively

Similar articles

Cited by

References

    1. Cowie MR, Komajda M, Murray‐Thomas T, Underwood J, Ticho B, Investigators P . Prevalence and impact of worsening renal function in patients hospitalized with decompensated heart failure: results of the prospective outcomes study in heart failure (POSH). Eur Heart J 2006; 27: 1216–1222. - PubMed
    1. Kociol RD, Greiner MA, Hammill BG, Phatak H, Fonarow GC, Curtis LH, Hernandez AF. Long‐term outcomes of Medicare beneficiaries with worsening renal function during hospitalization for heart failure. Am J Cardiol 2010; 105: 1786–1793. - PubMed
    1. Hata N, Yokoyama S, Shinada T, Kobayashi N, Shirakabe A, Tomita K, Kitamura M, Kurihara O, Takahashi Y. Acute kidney injury and outcomes in acute decompensated heart failure: evaluation of the RIFLE criteria in an acutely ill heart failure population. Eur J Heart Fail 2010; 12: 32–37. - PubMed
    1. Mullens W, Abrahams Z, Francis GS, Sokos G, Taylor DO, Starling RC, Young JB, Tang WH. Importance of venous congestion for worsening of renal function in advanced decompensated heart failure. J Am Coll Cardiol 2009; 53: 589–596. - PMC - PubMed
    1. Forman DE, Butler J, Wang Y, Abraham WT, O'Connor CM, Gottlieb SS, Loh E, Massie BM, Rich MW, Stevenson LW, Young JB, Krumholz HM. Incidence, predictors at admission, and impact of worsening renal function among patients hospitalized with heart failure. J Am Coll Cardiol 2004; 43: 61–67. - PubMed

MeSH terms