. 2019 Feb 25;15(2):e1006440.
doi: 10.1371/journal.pcbi.1006440. eCollection 2019 Feb.

Electrical synapses regulate both subthreshold integration and population activity of principal cells in response to transient inputs within canonical feedforward circuits

Affiliations

Electrical synapses regulate both subthreshold integration and population activity of principal cells in response to transient inputs within canonical feedforward circuits

Tuan Pham et al. PLoS Comput Biol. .

Abstract

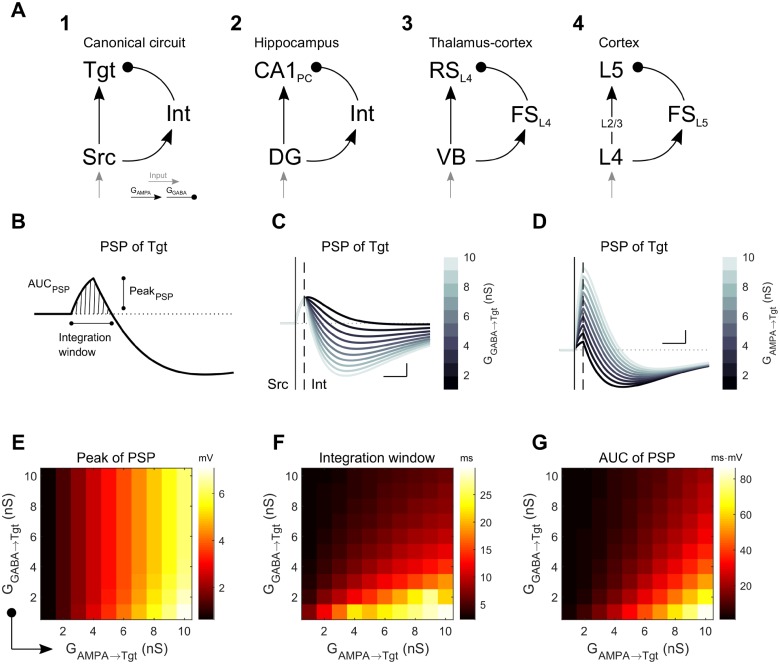
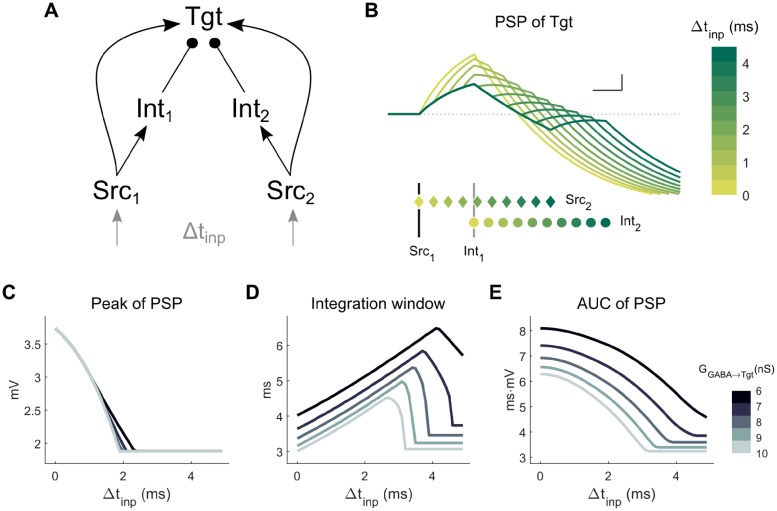
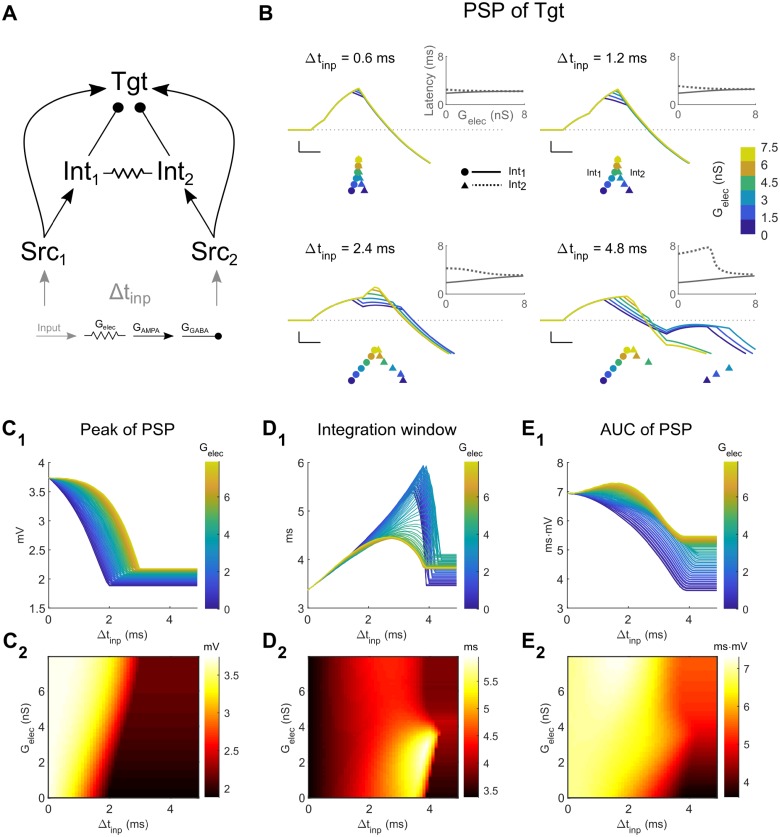
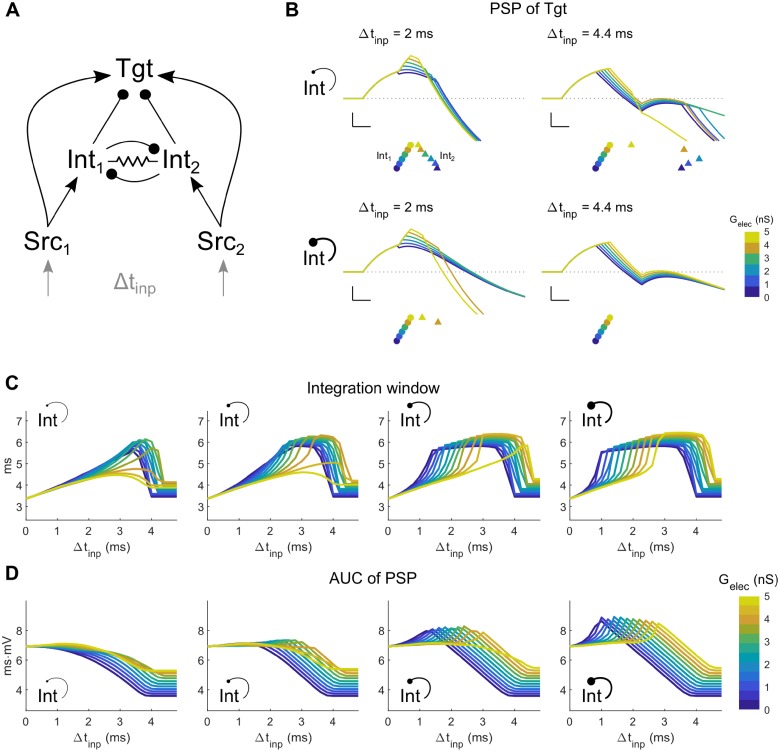
As information about the world traverses the brain, the signals exchanged between neurons are passed and modulated by synapses, or specialized contacts between neurons. While neurotransmitter-based synapses tend to exert either excitatory or inhibitory pulses of influence on the postsynaptic neuron, electrical synapses, composed of plaques of gap junction channels, continuously transmit signals that can either excite or inhibit a coupled neighbor. A growing body of evidence indicates that electrical synapses, similar to their chemical counterparts, are modified in strength during physiological neuronal activity. The synchronizing role of electrical synapses in neuronal oscillations has been well established, but their impact on transient signal processing in the brain is much less understood. Here we constructed computational models based on the canonical feedforward neuronal circuit and included electrical synapses between inhibitory interneurons. We provided discrete closely-timed inputs to the circuits, and characterize the influence of electrical synapse strength on both subthreshold summation and spike trains in the output neuron. Our simulations highlight the diverse and powerful roles that electrical synapses play even in simple circuits. Because these canonical circuits are represented widely throughout the brain, we expect that these are general principles for the influence of electrical synapses on transient signal processing across the brain.


Conflict of interest statement

The authors have declared that no competing interests exist.

Figures

Fig 1
Fig 1. Simple canonical model (SCC) of feedforward inhibition.
A: The Three-cell circuit model used herein (A1) with feedforward disynaptic inhibition between excitatory source (Src) and target (Tgt) neurons. This canonical model represents those found in, for example (A2) the hippocampal circuit, between dentate gyrus (DG) and CA1 cells [28]; (A3) from thalamic VB relay neurons to regular spiking cells in the somatosensory thalamocortical circuit [29]; and (A4) the cortical translaminar inhibitory circuit [30]. B: Example compound subthreshold postsynaptic membrane potential (PSP) in the Tgt neuron following a spike in Src, and the quantifications (PSP peak, integration window, and area under the PSP curve (AUC)) used throughout the text. C: Effect of different inhibitory strengths GGABA→Tgt on the compound PSP in Tgt; GAMPA→Tgt was 3 nS. D: Effect of varied GAMPA→Tgt on the compound PSP of Tgt; GGABA→Tgt was 6 nS. For both C and D, scale bar is 1 mV, 5 ms; the vertical straight line and dashed line mark the spike times of Src and Int, respectively. E-G: Combined effects of both excitatory and inhibitory synaptic strengths towards the peak, duration of the integration window and AUC of the positive portion of the compound PSP in Tgt.
Fig 2
Fig 2. Coupled canonical circuit (CCC) model: Two Src neurons and two Int neurons lead to a common Tgt neuron.
A: Model schematic. For the simulations shown here, there were no connections between the Int neurons. Each Src neuron received its own input, with timing difference between the two inputs Δtinp. B: PSPs in Tgt for varied Δtinp, with a color code representing different values of Δtinp. Spike times are shown below for Src1 (vertical black line), Src2 (colored diamonds ♦), Int1 (gray line) and Int2 (colored circles ●), each vertically separated for clarity. GGABA→Tgt was 8 nS. Scale bar is 1 mV, 1 ms. C-E: Integration parameters for the Tgt PSP as defined in Fig 1 for varied combinations of Δtinp and GGABA→Tgt.
Fig 3
Fig 3. Coupled canonical circuit (CCC) model: Two Src neurons and two Int neurons lead to a common Tgt neuron.
A: Model schematic. For the simulations shown here, the Int neurons were electrically coupled. Each Src neuron receives its own input, with timing difference between the two inputs as Δtinp. B: Examples of Tgt PSPs for different electrical synapse strengths between interneurons in the network (colored lines and legends). Each subpanel represents different values of input timing differences Δtinp. Scale bar is 1 mV, 1 ms. Colored symbols below PSPs represent the spike times of Int1 (circle ●) and Int2 (triangle ▲). Symbols are vertically separated for clarity. Insets show latencies of Int1 (solid lines) and Int2 (dashed lines) spikes relative to Src1, against Gelec. C-E: Increased electrical coupling leads to increased peak and AUC of the Tgt PSP, and decreased the integration window.
Fig 4
Fig 4. Coupled canonical circuit (CCC) model: Two Src neurons and two Int neurons lead to a common Tgt neuron.
A: Model schematic. For the simulations shown here, the Int neurons were electrically coupled and were reciprocally connected by an inhibitory synapse. Each Src neuron receives its own input, with timing difference between the two inputs Δtinp. B: Examples of Tgt PSP for different electrical synapse strengths between interneurons of the coupled network (colored lines and legends). Each subpanel shows PSPs for different input timing differences Δtinp (left: 2 ms, right: 4.4 ms), and strength of reciprocal inhibition GGABA→Int (top: 1 nS, bottom: 7 nS). Scale bar is 1 mV, 1 ms. Colored symbols represent the spike times of Int1 (circles ●) and Int2 (triangle ▲), with colors representing different values of Gelec between the two interneurons. Symbols are vertically separated for clarity. C-D: Integration window and AUC of the PSP in Tgt for varied strengths of Gelec (0–5 nS) and GGABA→Int (1, 3, 5, 7 nS from left to right).
Fig 5
Fig 5. Coupled canonical network (CCN), comprising subunits of SCCs.
A: Model schematic. For the simulations shown here, the Int neurons were connected by electrical synapses. Each Src neuron receives a single input, with arrival times drawn from a Gaussian distribution with specific standard deviation σinp. B: Normalized distributions of the input (top) and distributions of spike times in the Int (middle) and Tgt (bottom row) populations. Each column represents a different value of input timing distribution standard deviation (σinp = 1, 3, 5, 10 ms, from left to right). Dashed line (middle row) represents the average distribution of Src population spike times centered around t = 0 ms. Insets (bottom row) highlight the latencies of Tgt population, with threshold used to determine them (grey dashed line, 0.1). Line colors represent different values of electrical coupling strength of the interneuron population. C: Latency of Tgt distributions relative to Src, computed by thresholding the distributions in at 0.1. B. D: Response rate of Tgt neurons shown for each σinp, with 100% indicating spikes in all 50 Tgt neurons. E: Average Tgt spiking time (center of Tgt distribution) relative to Src, shown for each σinp.
Fig 6
Fig 6. Coupled canonical network (CCN), comprising subunits of SCCs.
A: Model schematic. For the simulations shown here, the Int neurons were connected by electrical synapses and reciprocal inhibition. Each Src neuron receives its own input, with arrival times drawn from a Gaussian distribution with specific standard deviation σinp. B: Normalized spike time distributions of the Tgt population. Each subpanel represents a different combination of input timing distribution standard deviation (σinp = 1, 3, 5, 10 ms, from left to right) and reciprocal inhibition strength (∑GGABA→Int = 1, 3, 5 nS from top to bottom). C: Latency of Tgt distributions relative to Src, computed by thresholding the distributions in B at 0.1, shown here for weak (∑GGABA→Int = 1, dotted lines) and strong (∑GGABA→Int = 5, solid lines). D: Response rate of Tgt neurons shown for each σinp and for weak and strong inhibition, as in C, with 100% indicating spikes in all 50 Tgt neurons. E: Average Tgt spiking time (center of Tgt distribution) relative to Src, shown for each σinp and for weak and strong inhibition, as in C.
Fig 7
Fig 7. Changes in properties of spike train distribution’s of Int and Tgt for the CCNs.
Values are expressed as normalized to the input (Src) distributions. (A) Int population and (B) Tgt population. In each panel, rows represent increasing reciprocal inhibitory strength within the Int population (ΣGGABA→Int = 0, 1, 3, 5 nS, from top to bottom). The top row of each set is the baseline CCN with ΣGGABA→Int = 0 (Fig 5), while the second, third and fourth rows represent the CCN with ΣGGABA→Int > 0 (Fig 6). The first column of each heat map always represents the uncoupled case, with 0 gain as indicated in white (see Methods). Within each heat map, electrical coupling ΣGelec is varied on the x axis and input distribution size σinp is varied on the y axis. Latency is shown relative to Src.
Fig 8
Fig 8. Information transfer between Tgt and Src in the CCN.
A1, 2: Example spike rasters for one set of CCN simulations demonstrating dispersion of Int and Tgt spike times, accumulated from all 50 SCC subunits over 50 trials with σinp = 5 ms and ΣGelec = 1 nS (top) or ΣGelec = 4.5 nS (bottom), and without reciprocal inhibition. Gray dashed line represents Src spike times, and colored dotted lines represent the uncoupled network (no electrical nor reciprocal inhibitory coupling). Spike times are ordered by Tgt- Src latency for clarity. A3, 4: Smoothed distributions of Tgt latencies relative to Src (A3, vertically offset for clarity, scale bar = 0.05) and entropy of the latencies (A4; ΣGelec = 0, 1, 2, 3, and 4.5 nS). B: Mutual information between Src and Tgt distributions, plotted against ΣGelec and σinp, for ΣGGABA→Int = 0, 1, 3, 5 nS from left to right. C: Transmission efficiency (percent of Tgt entropy attributed to Src) from Src to Tgt.

Similar articles

Cited by

References

    1. Connors BW, Long MA. Electrical synapses in the mammalian brain. Annu Rev Neurosci. 2004;27:393–418. 10.1146/annurev.neuro.26.041002.131128 . - DOI - PubMed
    1. Nagy JI, Pereda AE, Rash JE. Electrical synapses in mammalian CNS: Past eras, present focus and future directions. Biochim Biophys Acta. 2018;1860(1):102–23. 10.1016/j.bbamem.2017.05.019 . - DOI - PMC - PubMed
    1. Bennett MV, Zukin RS. Electrical coupling and neuronal synchronization in the Mammalian brain. Neuron. 2004;41(4):495–511. . - PubMed
    1. Gibson JR, Beierlein M, Connors BW. Functional properties of electrical synapses between inhibitory interneurons of neocortical layer 4. J Neurophysiol. 2005;93(1):467–80. 10.1152/jn.00520.2004 . - DOI - PubMed
    1. Haas JS, Landisman CE. State-dependent modulation of gap junction signaling by the persistent sodium current. Front Cell Neurosci. 2012;5:31 10.3389/fncel.2011.00031 . - DOI - PMC - PubMed

Publication types