

Magnetic resonance imaging-guided phase 1 trial of putaminal AADC gene therapy for Parkinson's disease
- PMID: 30802998
- PMCID: PMC6593762
- DOI: 10.1002/ana.25450
Magnetic resonance imaging-guided phase 1 trial of putaminal AADC gene therapy for Parkinson's disease
Abstract
Objective: To understand the safety, putaminal coverage, and enzyme expression of adeno-associated viral vector serotype-2 encoding the complementary DNA for the enzyme, aromatic L-amino acid decarboxylase (VY-AADC01), delivered using novel intraoperative monitoring to optimize delivery.
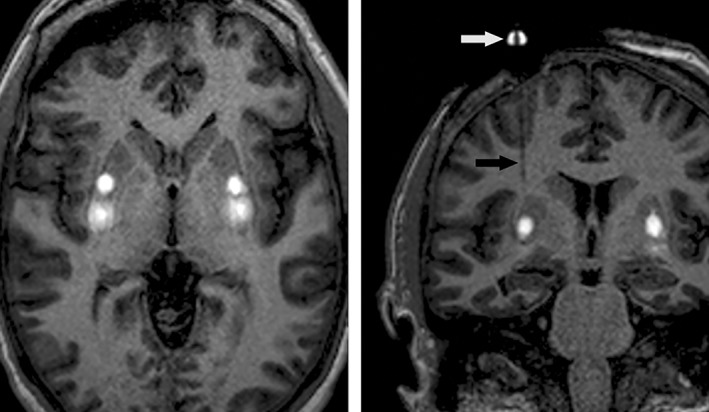
Methods: Fifteen subjects (three cohorts of 5) with moderately advanced Parkinson's disease and medically refractory motor fluctuations received VY-AADC01 bilaterally coadministered with gadoteridol to the putamen using intraoperative magnetic resonance imaging (MRI) guidance to visualize the anatomic spread of the infusate and calculate coverage. Cohort 1 received 8.3 × 10¹¹ vg/ml and ≤450 μl per putamen (total dose, ≤7.5 × 10¹¹ vg); cohort 2 received the same concentration (8.3 × 10¹¹ vg/ml) and ≤900 μl per putamen (total dose, ≤1.5 × 10¹² vg); and cohort 3 received 2.6 × 10¹² vg/ml and ≤900 μl per putamen (total dose, ≤4.7 × 10¹² vg). (18)F-fluoro-L-dihydroxyphenylalanine positron emission tomography (PET) at baseline and 6 months postprocedure assessed enzyme activity; standard assessments measured clinical outcomes.
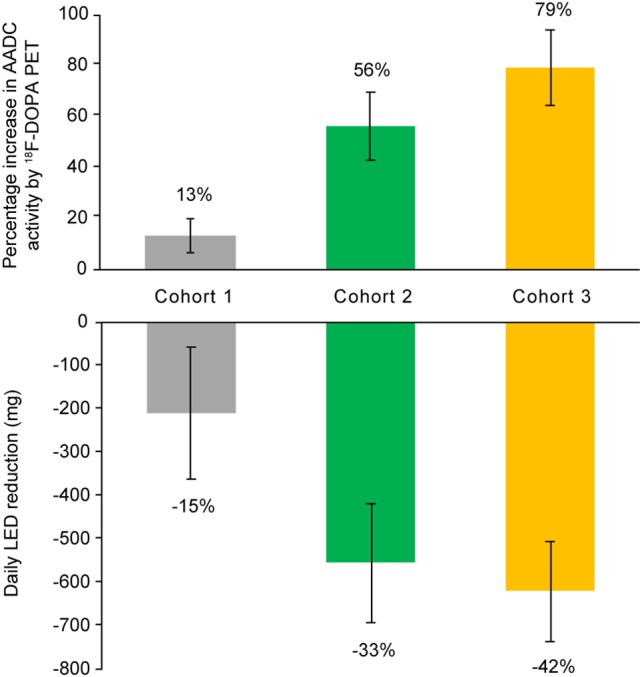
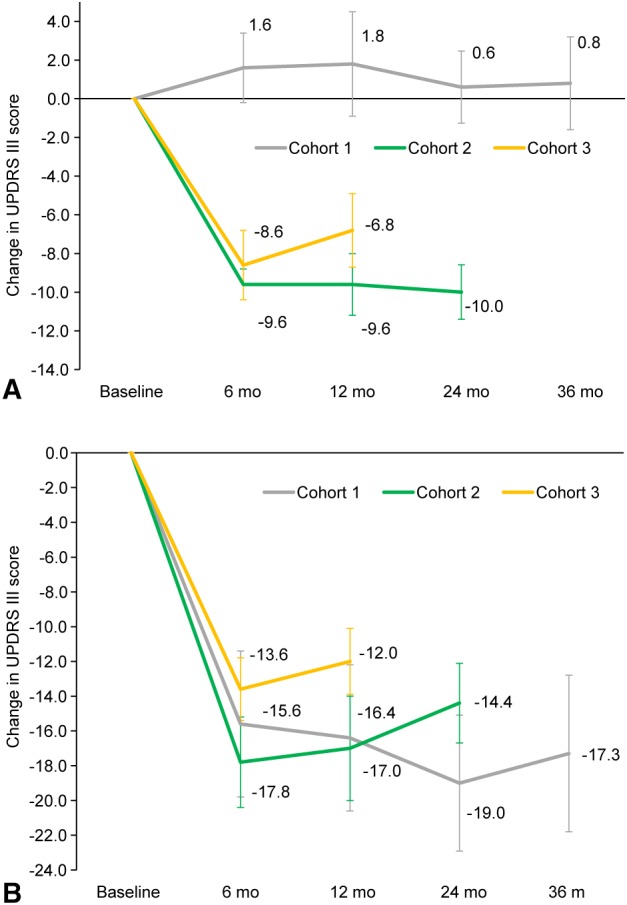
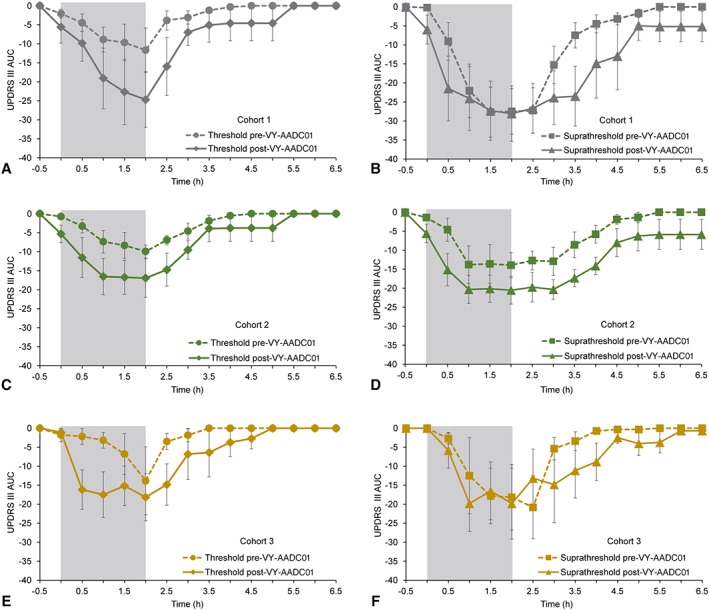
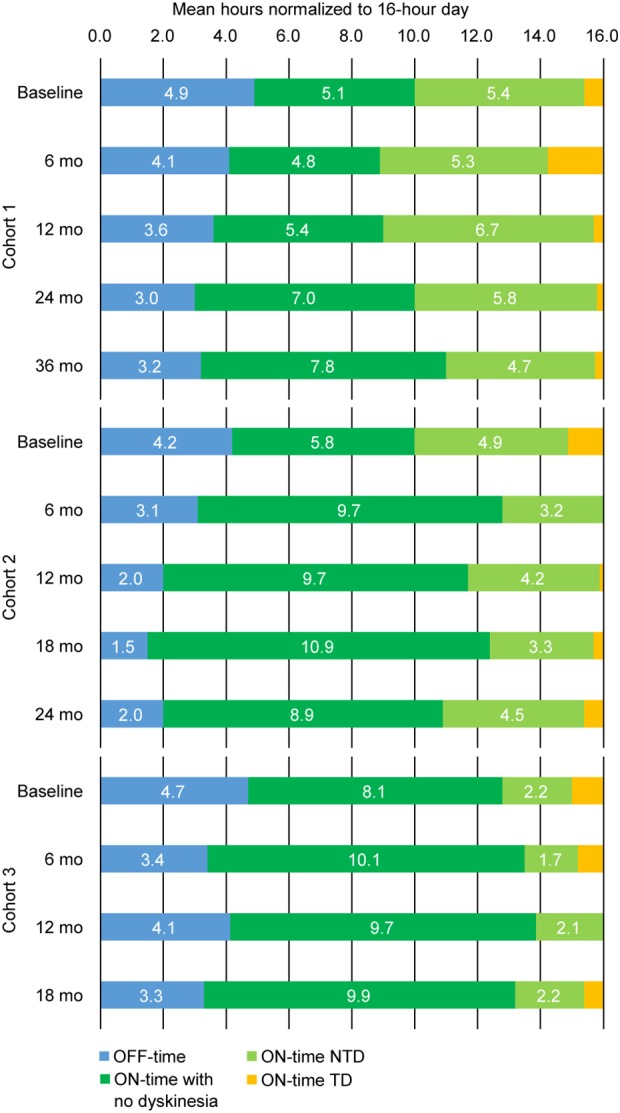
Results: MRI-guided administration of ascending VY-AADC01 doses resulted in putaminal coverage of 21% (cohort 1), 34% (cohort 2), and 42% (cohort 3). Cohorts 1, 2, and 3 showed corresponding increases in enzyme activity assessed by PET of 13%, 56%, and 79%, and reductions in antiparkinsonian medication of -15%, -33%, and -42%, respectively, at 6 months. At 12 months, there were dose-related improvements in clinical outcomes, including increases in patient-reported ON-time without troublesome dyskinesia (1.6, 3.3, and 1.5 hours, respectively) and quality of life.
Interpretation: Novel intraoperative monitoring of administration facilitated targeted delivery of VY-AADC01 in this phase 1 study, which was well tolerated. Increases in enzyme expression and clinical improvements were dose dependent. ClinicalTrials.gov Identifier: NCT01973543 Ann Neurol 2019;85:704-714.
© 2019 The Authors. Annals of Neurology published by Wiley Periodicals, Inc. on behalf of American Neurological Association.
Conflict of interest statement
The authors report the following potential conflicts of interest during the conduct of this study: C.W.C. and J.N. received grants from Voyager Therapeutics, Inc.; K.S.B. received grants and personal fees from Voyager Therapeutics and holds a patent on the use of AAV2‐AADC for the treatment of Parkinson's disease licensed to Genzyme and Voyager Therapeutics, and a patent on the step cannula for gene delivery with royalties paid by MRI Interventions to UCSF; A.D.V.L., R.M.R., and A.J.M. received grants from Voyager Therapeutics; B.R. was an employee of Voyager Therapeutics and has a patent on AADC gene transfer in Parkinson's disease pending; A.P.K. was an employee of Voyager Therapeutics; B.B. was an employee of Voyager Therapeutics; M.E.T. received grants and nonfinancial support from Voyager Therapeutics; and P.S.L. received grants from Voyager Therapeutics and nonfinancial support from MRI Interventions, the company that makes the surgical delivery platform and step cannula used for gene delivery.
Figures
References
-
- Fahn S, Oakes D, Shoulson I, et al. Levodopa and the progression of Parkinson's disease. N Engl J Med 2004;351:2498–2508. - PubMed
-
- Chan PL, Nutt JG, Holford NH. Pharmacokinetic and pharmacodynamic changes during the first four years of levodopa treatment in Parkinson's disease. J Pharmacokinet Pharmacodyn 2005;32:459–484. - PubMed
-
- Gray R, Ives N, Rick C, et al. Long‐term effectiveness of dopamine agonists and monoamine oxidase B inhibitors compared with levodopa as initial treatment for Parkinson's disease (PD MED): a large, open‐label, pragmatic randomised trial. Lancet 2014;384:1196–1205. - PubMed
Publication types
MeSH terms
Substances
Associated data
Grants and funding
LinkOut - more resources
Full Text Sources
Other Literature Sources
Medical
Miscellaneous
