

Nocturnal Melatonin Suppression by Adolescents and Adults for Different Levels, Spectra, and Durations of Light Exposure
- PMID: 30803301
- PMCID: PMC6640648
- DOI: 10.1177/0748730419828056
Nocturnal Melatonin Suppression by Adolescents and Adults for Different Levels, Spectra, and Durations of Light Exposure
Abstract
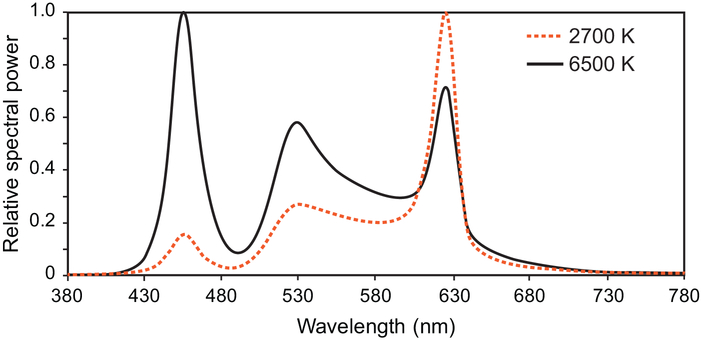
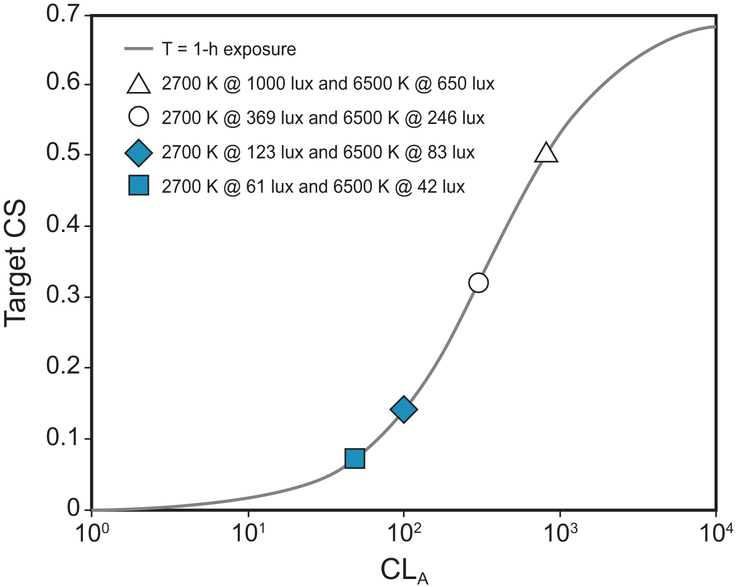
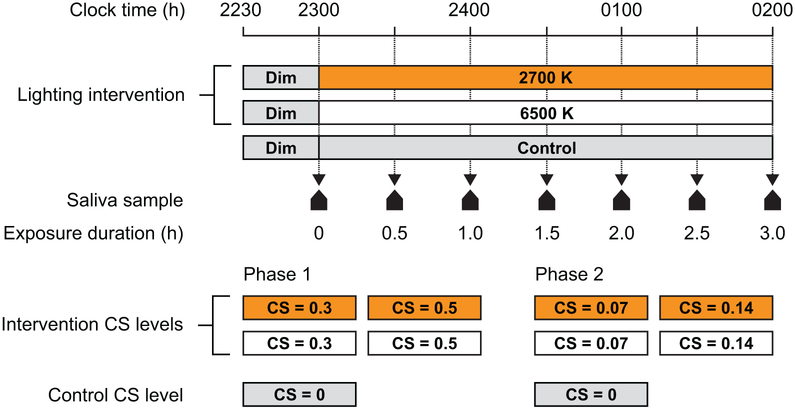
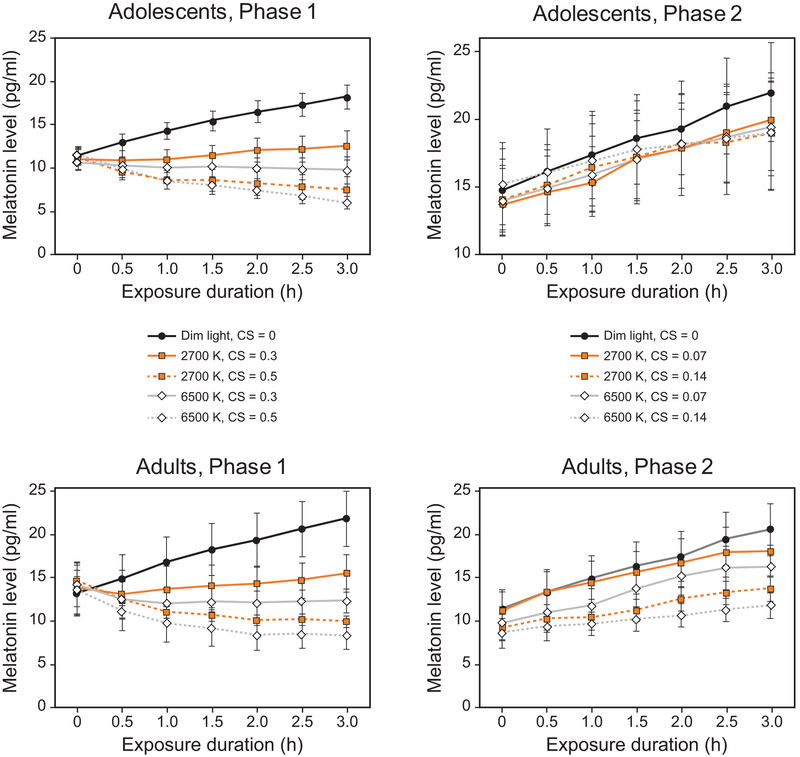
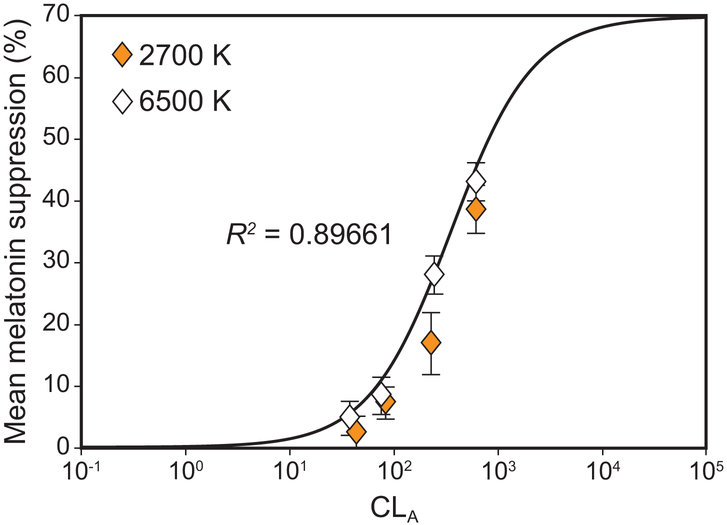
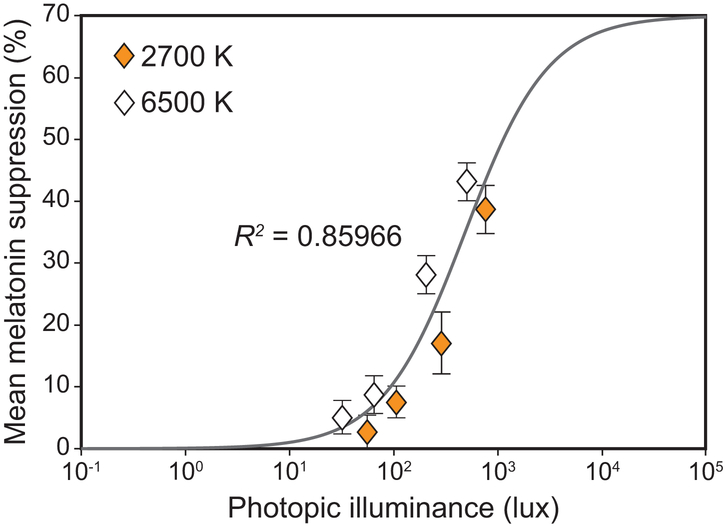
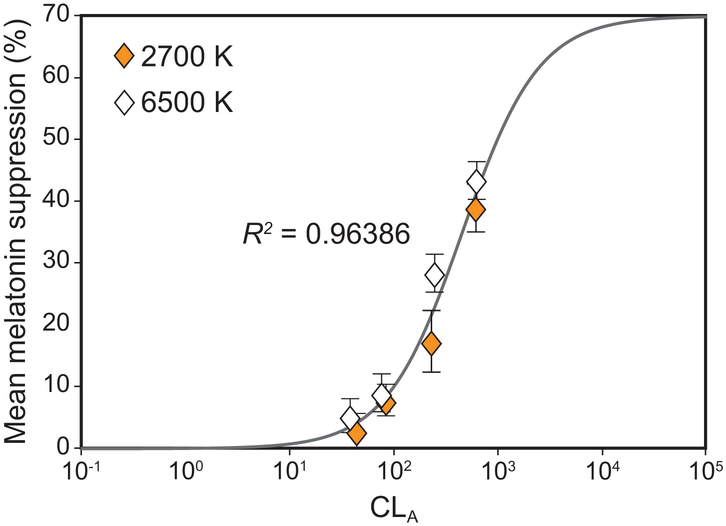
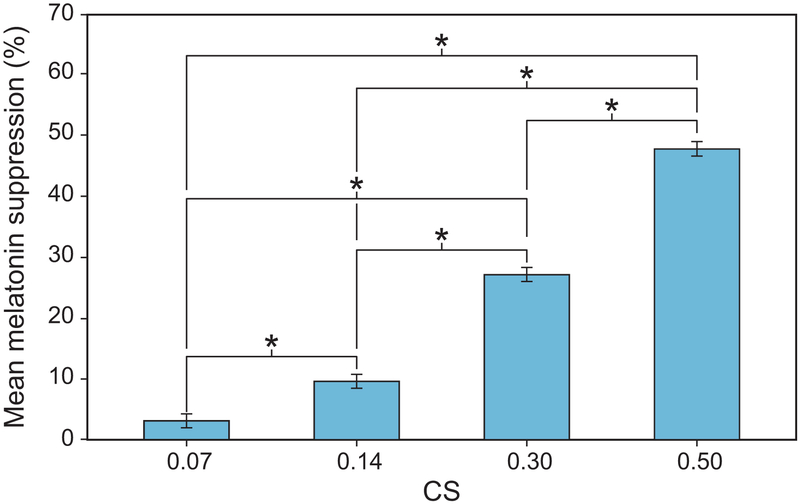
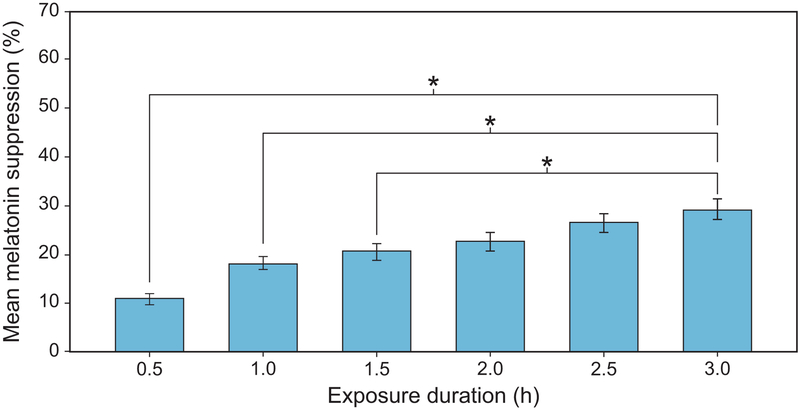
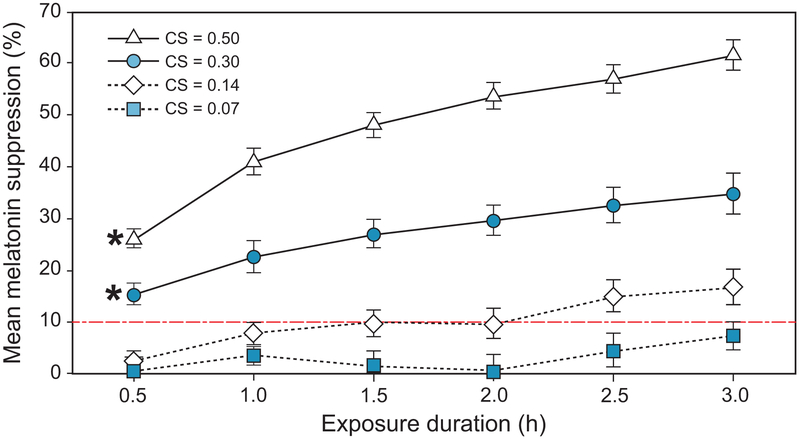
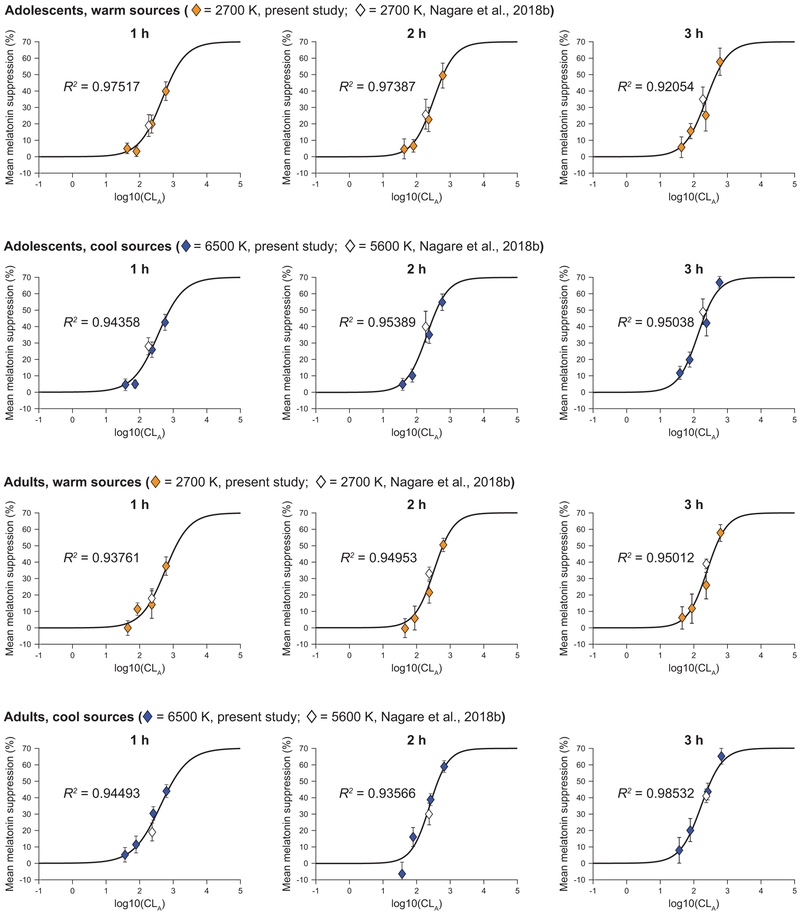
The human circadian system is primarily regulated by the 24-h LD cycle incident on the retina, and nocturnal melatonin suppression is a primary outcome measure for characterizing the biological clock's response to those light exposures. A limited amount of data related to the combined effects of light level, spectrum, and exposure duration on nocturnal melatonin suppression has impeded the development of circadian-effective lighting recommendations and light-treatment methods. The study's primary goal was to measure nocturnal melatonin suppression for a wide range of light levels (40 to 1000 lux), 2 white light spectra (2700 K and 6500 K), and an extended range of nighttime light exposure durations (0.5 to 3.0 h). The study's second purpose was to examine whether differences existed between adolescents' and adults' circadian sensitivity to these lighting characteristics. The third purpose was to provide an estimate of the absolute threshold for the impact of light on acute melatonin suppression. Eighteen adolescents (age range, 13 to 18 years) and 23 adults (age range, 24 to 55 years) participated in the study. Results showed significant main effects of light level, spectrum, and exposure duration on melatonin suppression. Moreover, the data also showed that the relative suppressing effect of light on melatonin diminishes with increasing exposure duration for both age groups and both spectra. The present results do not corroborate our hypothesis that adolescents exhibit greater circadian sensitivity to short-wavelength radiation compared with adults. As for threshold, it takes longer to observe significant melatonin suppression at lower CS levels than at higher CS levels. Dose-response curves (amount and duration) for both white-light spectra and both age groups can guide lighting recommendations when considering circadian-effective light in applications such as offices, schools, residences, and healthcare facilities.
Keywords: age-related change; and spectrum; circadian phase; circadian phototransduction; circadian rhythms; exposure duration; light level; nocturnal melatonin suppression; white light.
Figures
Similar articles
-
Circadian Potency Spectrum with Extended Exposure to Polychromatic White LED Light under Workplace Conditions.J Biol Rhythms. 2020 Aug;35(4):405-415. doi: 10.1177/0748730420923164. Epub 2020 Jun 16. J Biol Rhythms. 2020. PMID: 32539484 Free PMC article.
-
Effect of White Light Devoid of "Cyan" Spectrum Radiation on Nighttime Melatonin Suppression Over a 1-h Exposure Duration.J Biol Rhythms. 2019 Apr;34(2):195-204. doi: 10.1177/0748730419830013. Epub 2019 Mar 1. J Biol Rhythms. 2019. PMID: 30821188 Free PMC article.
-
Circadian effectiveness of two polychromatic lights in suppressing human nocturnal melatonin.Neurosci Lett. 2006 Oct 9;406(3):293-7. doi: 10.1016/j.neulet.2006.07.069. Epub 2006 Aug 22. Neurosci Lett. 2006. PMID: 16930839
-
Systematic review of light exposure impact on human circadian rhythm.Chronobiol Int. 2019 Feb;36(2):151-170. doi: 10.1080/07420528.2018.1527773. Epub 2018 Oct 12. Chronobiol Int. 2019. PMID: 30311830
-
Review on age-related differences in non-visual effects of light: melatonin suppression, circadian phase shift and pupillary light reflex in children to older adults.J Physiol Anthropol. 2023 Jun 24;42(1):11. doi: 10.1186/s40101-023-00328-1. J Physiol Anthropol. 2023. PMID: 37355647 Free PMC article. Review.
Cited by
-
Numerical correlation between non-visual metrics and brightness metrics-implications for the evaluation of indoor white lighting systems in the photopic range.Sci Rep. 2023 Sep 8;13(1):14858. doi: 10.1038/s41598-023-41371-3. Sci Rep. 2023. PMID: 37684284 Free PMC article.
-
Circadian Potency Spectrum with Extended Exposure to Polychromatic White LED Light under Workplace Conditions.J Biol Rhythms. 2020 Aug;35(4):405-415. doi: 10.1177/0748730420923164. Epub 2020 Jun 16. J Biol Rhythms. 2020. PMID: 32539484 Free PMC article.
-
Diurnal Circadian Lighting Accumulation Model: A Predictor of the Human Circadian Phase Shift Phenotype.Phenomics. 2022 Feb 11;2(1):50-63. doi: 10.1007/s43657-021-00039-6. eCollection 2022 Feb. Phenomics. 2022. PMID: 36939753 Free PMC article.
-
Power Analysis for Human Melatonin Suppression Experiments.Clocks Sleep. 2024 Feb 26;6(1):114-128. doi: 10.3390/clockssleep6010009. Clocks Sleep. 2024. PMID: 38534797 Free PMC article.
-
A Purkinje image-based system for an assessment of the density and transmittance spectra of the human crystalline lens in vivo.Sci Rep. 2020 Oct 5;10(1):16445. doi: 10.1038/s41598-020-73541-y. Sci Rep. 2020. PMID: 33020575 Free PMC article.
References
-
- Alliance for Solid-State Illumination Systems and Technologies (ASSIST) (2011) A Method for Estimating Discomfort Glare from Exterior Lighting Systems. In, Lighting Research Center, Rensselaer Polytechnic Institute; Troy, NY.
-
- American Medical Association (2016) Human and Environmental Effects of Light Emitting Diode (LED) Community Lighting In Council on Science & Public Health Reports, American Medical Association, Chicago, IL.
-
- Aoki H, Yamada N, Ozeki Y, Yamane H, and Kato N (1998) Minimum light intensity required to suppress nocturnal melatonin concentration in human saliva. Neurosci Lett 252:91–94. - PubMed
-
- Bierman A, Klein TR, and Rea MS (2005) The Daysimeter: A device for measuring optical radiation as a stimulus for the human circadian system. Meas Sci Technol 16:2292–2299.
Publication types
MeSH terms
Substances
Grants and funding
LinkOut - more resources
Full Text Sources
Research Materials
