. 2019 Feb 26:8:e40947.
doi: 10.7554/eLife.40947.

Somatic mutations in early metazoan genes disrupt regulatory links between unicellular and multicellular genes in cancer

Affiliations

Somatic mutations in early metazoan genes disrupt regulatory links between unicellular and multicellular genes in cancer

Anna S Trigos et al. Elife. .

Abstract

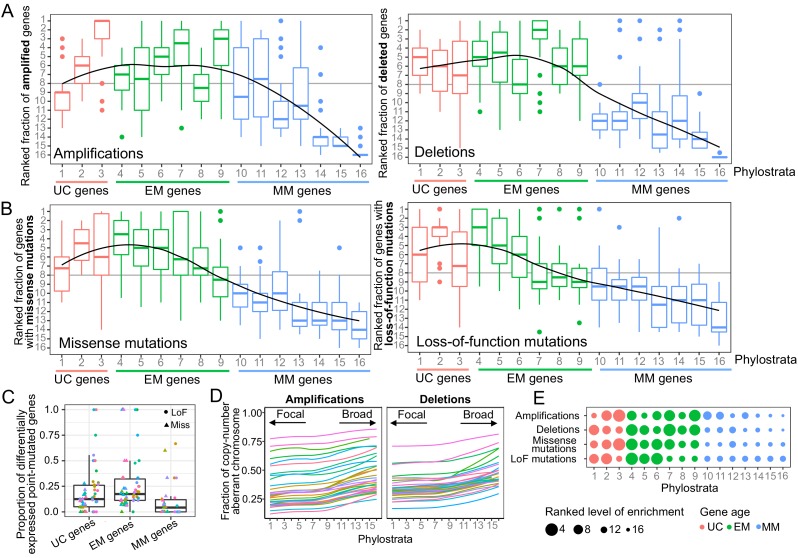
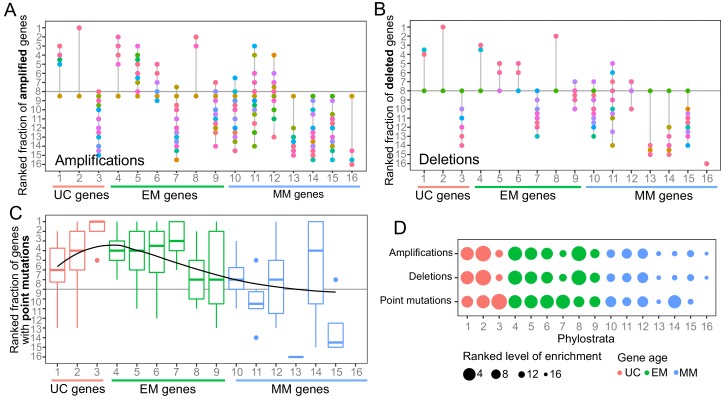
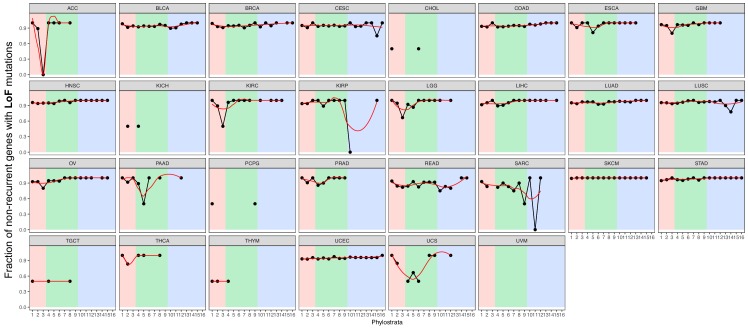
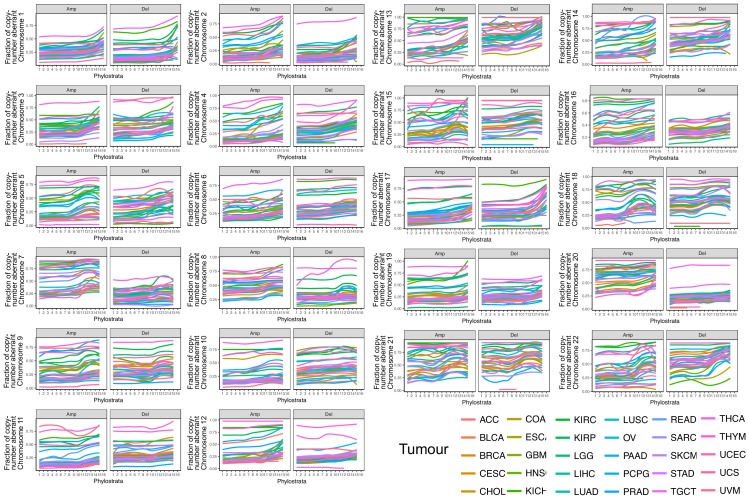
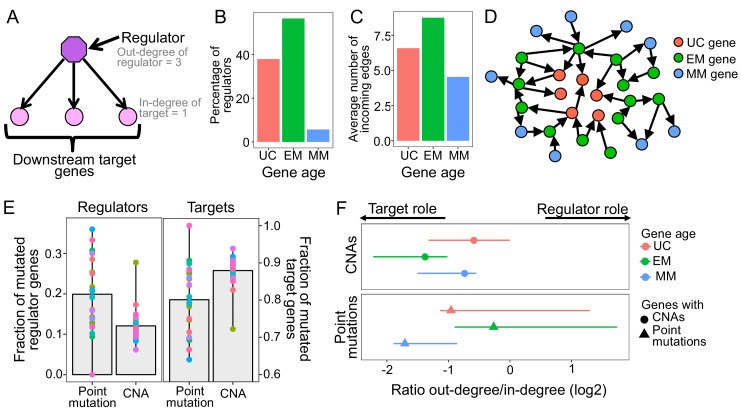
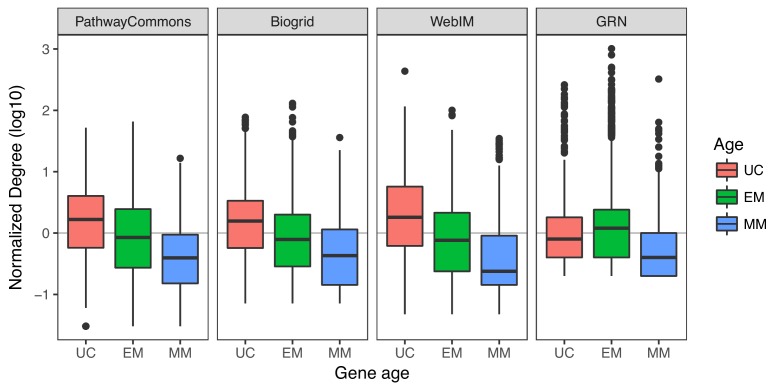
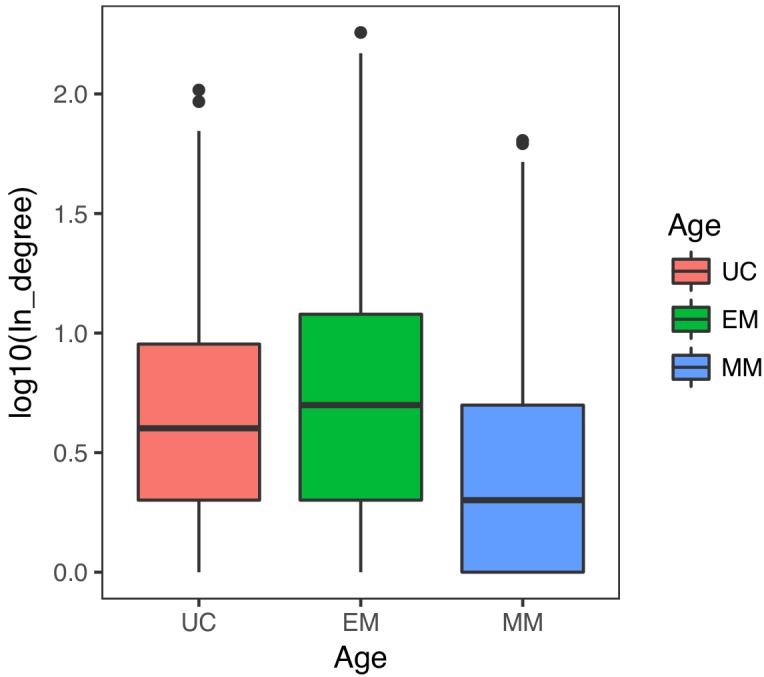
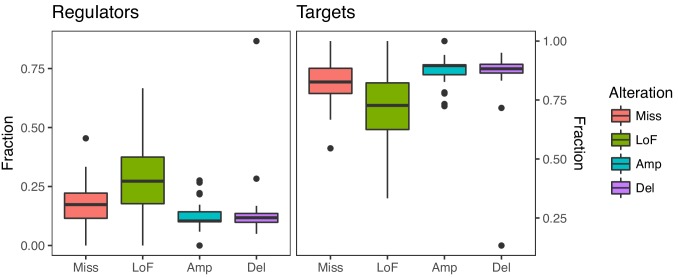
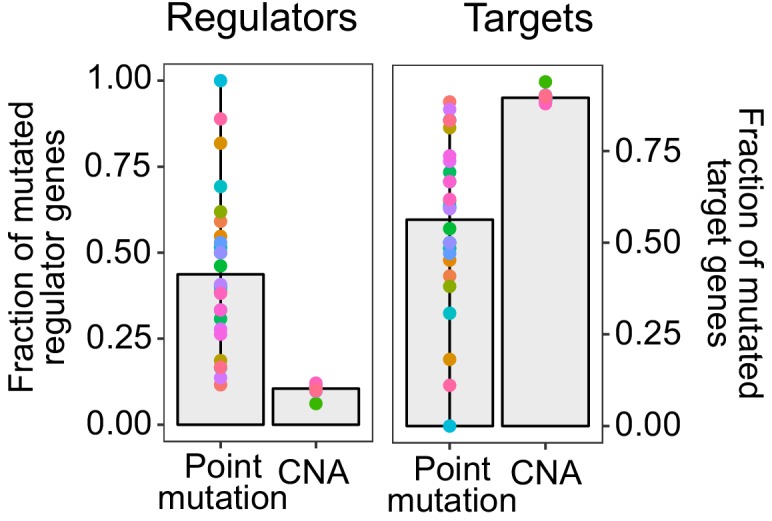
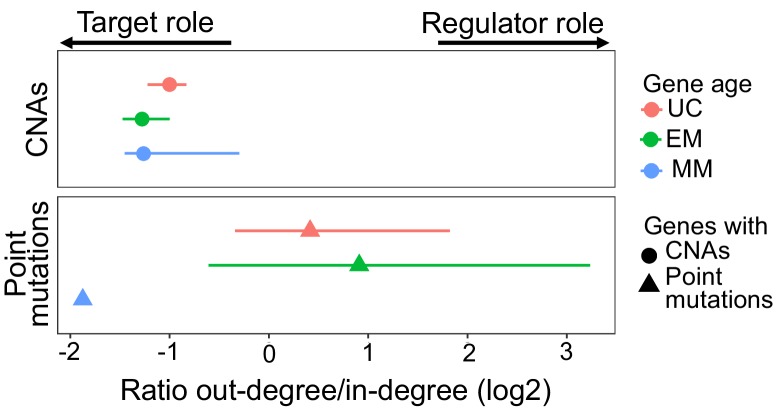
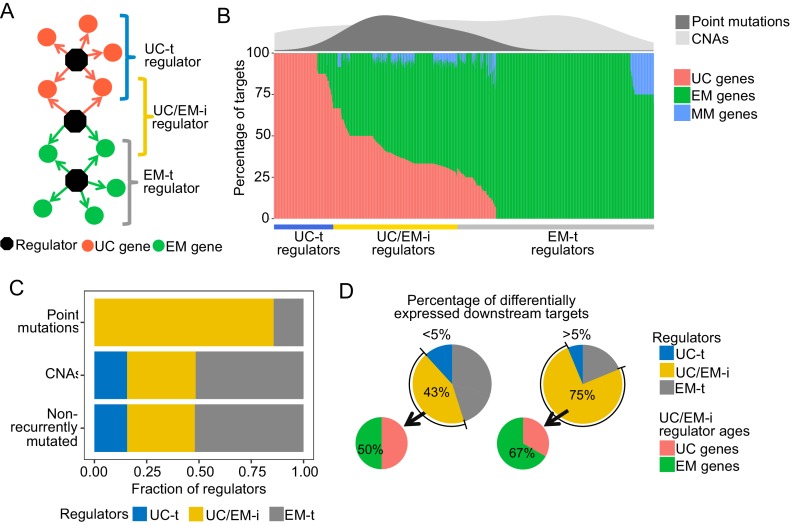
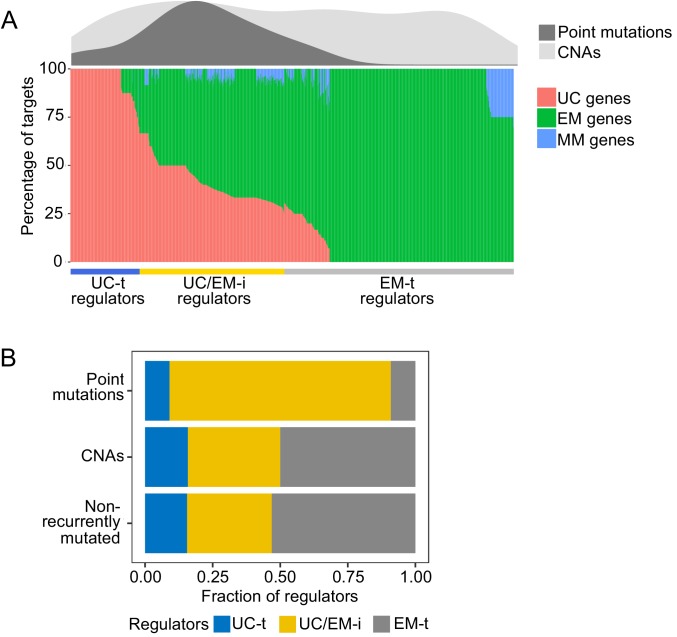
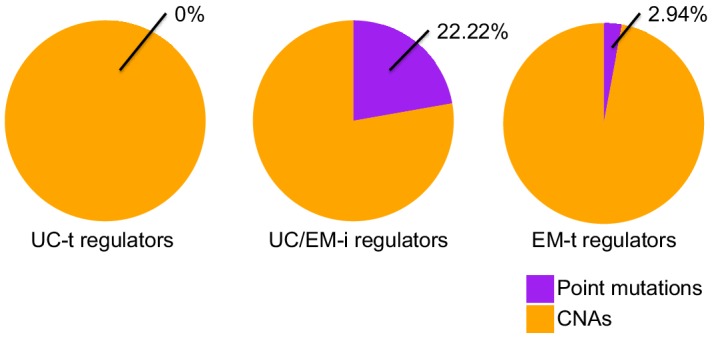
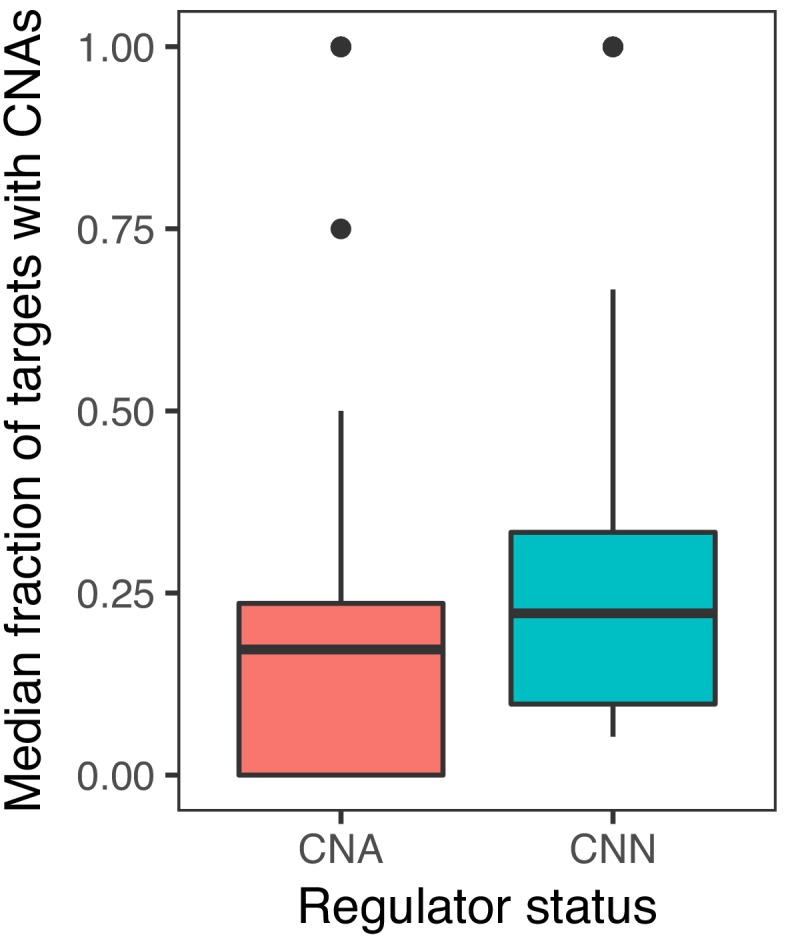
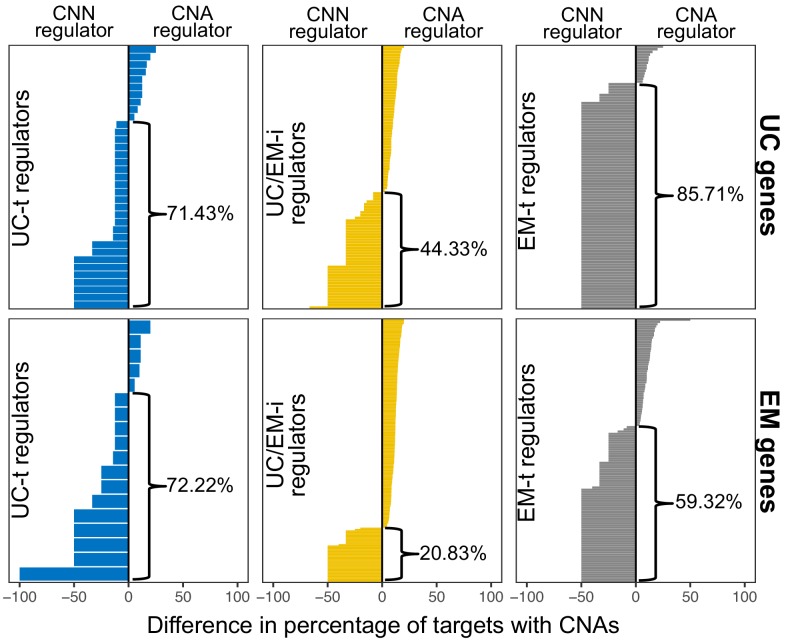
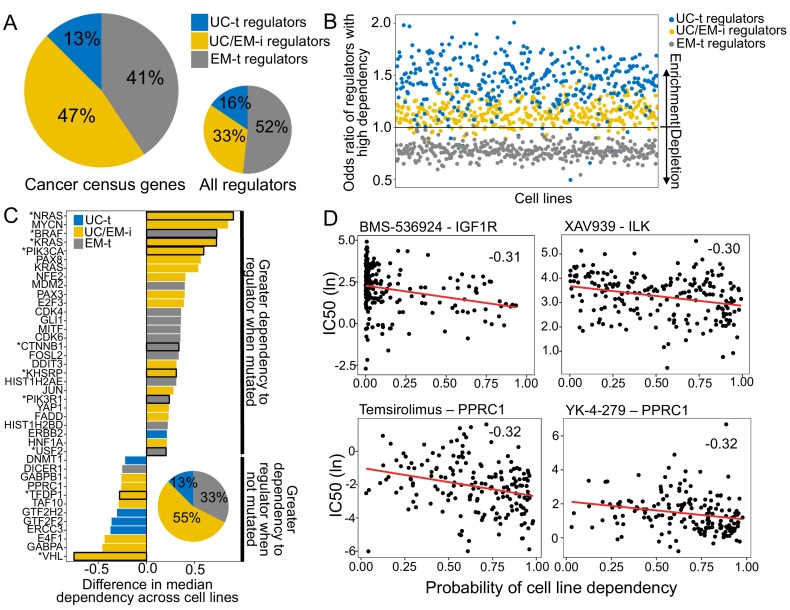
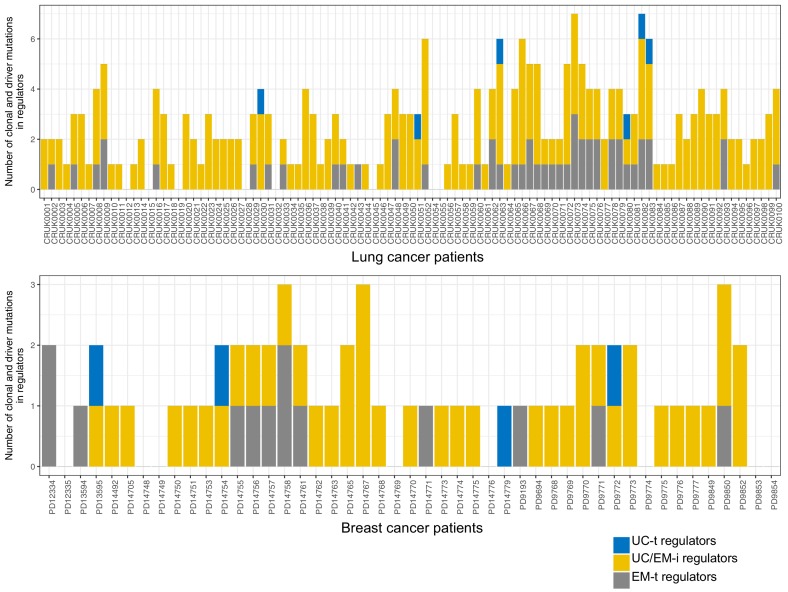
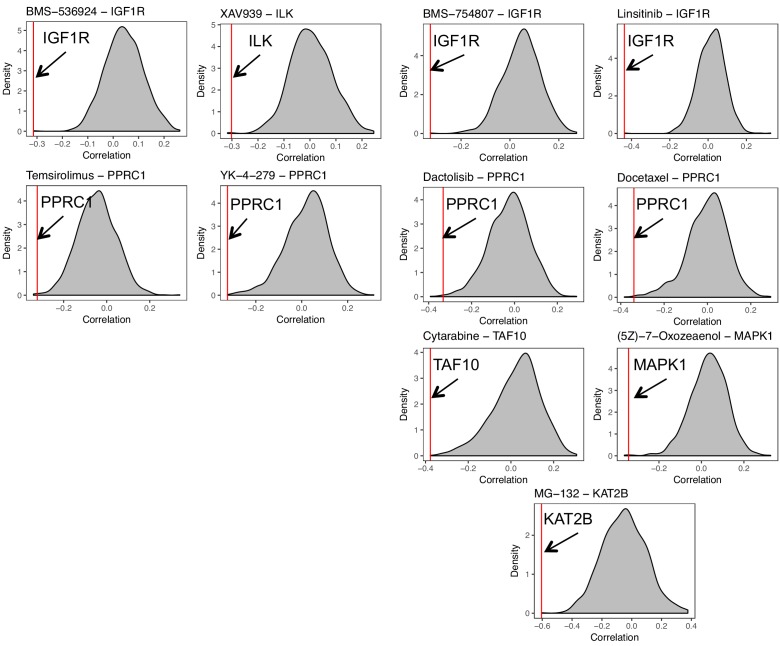
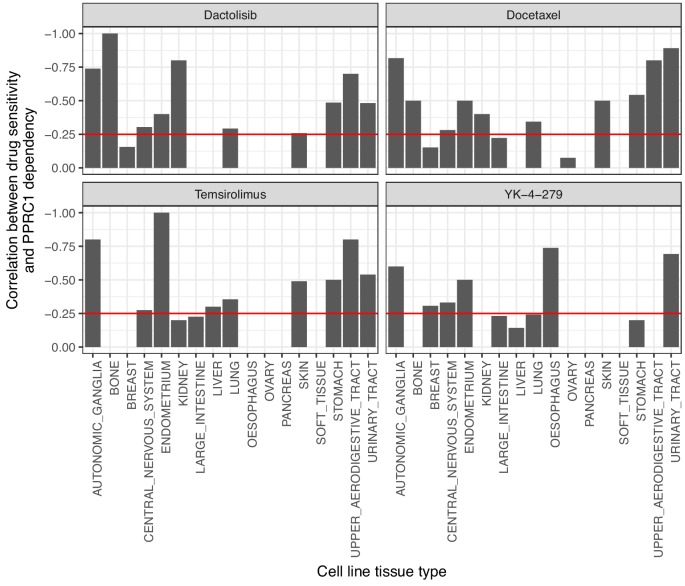
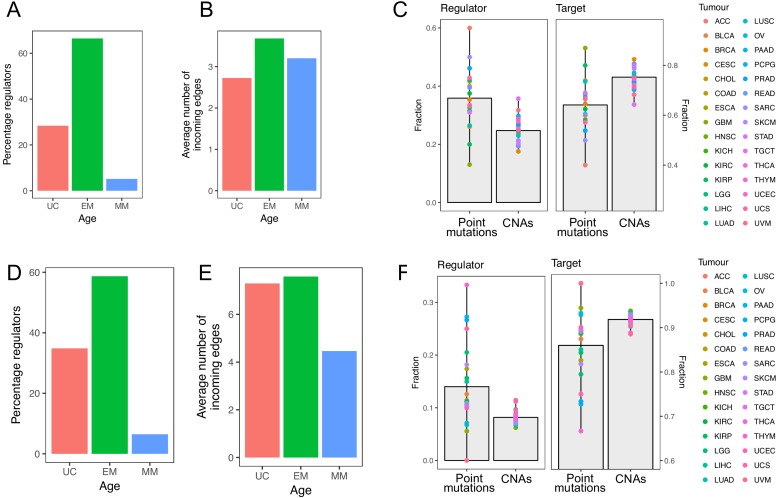
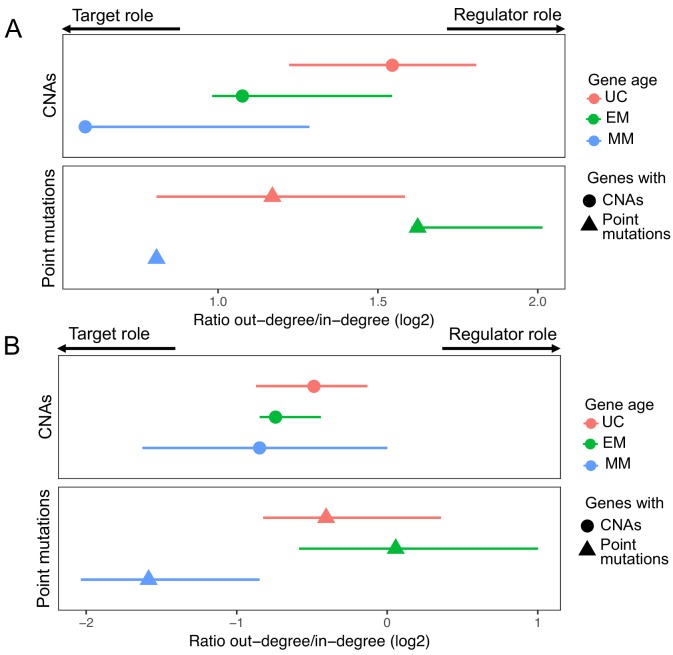
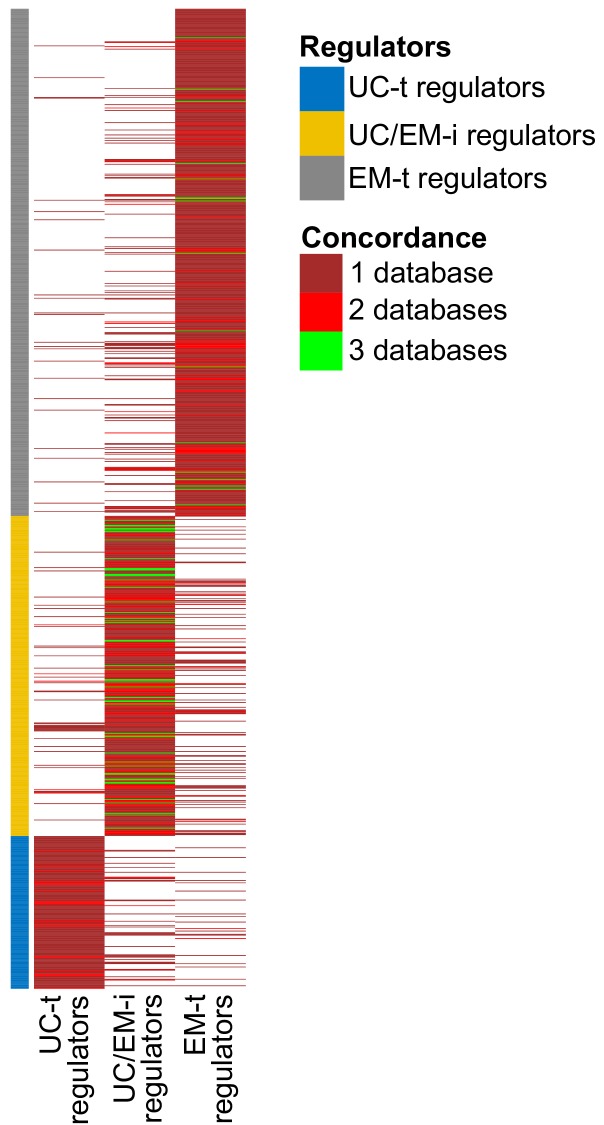
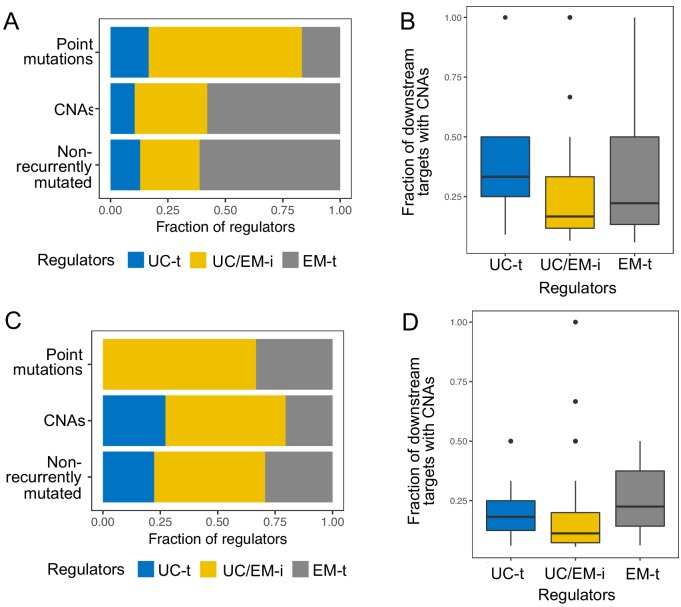
Extensive transcriptional alterations are observed in cancer, many of which activate core biological processes established in unicellular organisms or suppress differentiation pathways formed in metazoans. Through rigorous, integrative analysis of genomics data from a range of solid tumors, we show many transcriptional changes in tumors are tied to mutations disrupting regulatory interactions between unicellular and multicellular genes within human gene regulatory networks (GRNs). Recurrent point mutations were enriched in regulator genes linking unicellular and multicellular subnetworks, while copy-number alterations affected downstream target genes in distinctly unicellular and multicellular regions of the GRN. Our results depict drivers of tumourigenesis as genes that created key regulatory links during the evolution of early multicellular life, whose dysfunction creates widespread dysregulation of primitive elements of the GRN. Several genes we identified as important in this process were associated with drug response, demonstrating the potential clinical value of our approach.

Keywords: cancer; cancer biology; computational biology; evolution; human; multicellularity; mutations; networks; orthology; systems biology.


Conflict of interest statement

AT, RP, AP, DG No competing interests declared

Figures

Figure 1.
Figure 1.. Enrichment of CNAs and point mutations in EM genes.
(A) Fraction of amplified (left) and deleted (right) genes across phylostrata. EM genes are preferentially copy-number altered across tumor types, whereas MM genes are depleted. (B) Fraction of genes with missense (left) and LoF (right) mutations across phylostrata. Late UC genes and EM genes are enriched in missense and LoF mutations across tumor types, whereas MM genes consistently have the lowest fraction of genes with point mutations. The fractions rank from 1 (phylostratum with the highest fraction of mutated genes) to rank 16 (phylostratum with the lowest fraction of mutated genes). The line is a trendline calculated using a loess smoothing function. (C) Proportion of differentially expressed point-mutated EM genes across all tumor types compared to UC (one-sided Wilcoxon p=0.031) and MM genes (p=3.78×10⁻⁶). (D) Presence of genes of each phylostratum at different fractions of chromosome altered by amplifications. Older genes are preferentially located in regions with focal alterations, whereas younger, MM genes are located in regions with broader changes, suggesting stronger selection for the CNA of UC and EM genes (increasing trend adj. p<0.05). (E) Summary enrichment results of recurrent point mutations and CNAs in phylostrata across tumors. The size of the point corresponds to the level of enrichment (rank). The largest enrichment occurs in EM genes, with some enrichment of UC genes.
Figure 1—figure supplement 1.
Figure 1—figure supplement 1.. Ratio of the number of missense and LoF mutations over synonymous mutations.
Known cancer genes (derived from the Cancer Census database) have a higher ratio that other genes, indicating that this metric captures genes more likely to be drivers. Only genes with missense or LoF mutations in at least three patients were kept. The number of genes with missense and LoF mutations is shown.
Figure 1—figure supplement 2.
Figure 1—figure supplement 2.. Phylogenetic tree depicting gene phylostrata.
Genes assigned to earlier phylostrata (smaller numbers) are more ancient as they are across multiple phylogenetic groups of the tree of life, whereas genes assigned to later phylostrata (larger numbers) evolved more recently and are only found in specific phologenetic groups.
Figure 1—figure supplement 3.
Figure 1—figure supplement 3.. Number of genes in each phylostratum.
Genes were assigned to phylostratum based on the age of the most ancient ancestor with an ortholog of the gene using phylostratigraphy. 38.80% (6719) of human genes are of UC origin (red), 45.84% (7939) are of EM origin (green) and 15.36% (2660) are of MM origin (blue).
Figure 1—figure supplement 4.
Figure 1—figure supplement 4.. Enrichment in EM genes of recurrent CNAs and point mutations identified by Gistic and MutSig2CV.
(A) Fraction of amplified, (B) deleted and point mutated (C) genes across phylostrata. At least 3 of the top five most recurrently affected phylostrata by amplifications were EM in 26/29 tumor types. Enrichment was also obtained for deletions (28/29 tumor types) and point mutations (14/23 tumor types), indicating that recurrently copy-number altered or mutated genes are EM genes. (D) Summary enrichment results of recurrent point mutations and CNAs in phylostrata across tumors. The size of the point corresponds to the level of enrichment (rank). The largest enrichment occurs in EM genes, with some enrichment of UC genes. The x-axis correspond to the phylostrata defined in Figure 1—figure supplement 2.
Figure 1—figure supplement 5.
Figure 1—figure supplement 5.. Fraction of non-recurrent amplified genes.
We calculated the fraction of genes with non-recurrent amplifications of all genes with amplification. Although most mutated genes were non-recurrent across phylostrata, mutated MM genes are particularly non-recurrent (increasing trend). Red strip = UC phylostrata, green strip-EM phylostrata, blue strip = MM phylostrata. Note that dips in phylostratum 16 in results from the small number of genes belonging to these groups and strong selection for the amplification of the chromosomes where the genes are located. For example, only four genes of phylostratum 16 are amplified in BRCA, 2 of which are recurrently amplified. These genes are located on chromosome 17, which is recurrently amplified due to the presence of ERBB2, a common oncogene in breast cancer.
Figure 1—figure supplement 6.
Figure 1—figure supplement 6.. Fraction of non-recurrent deleted genes.
We calculated the fraction of genes with non-recurrent deletions of all genes with deletions. Although most mutated genes were non-recurrent across phylostrata, mutated MM genes are particularly non-recurrent (increasing trend). Red strip = UC phylostrata, green strip-EM phylostrata, blue strip = MM phylostrata.
Figure 1—figure supplement 7.
Figure 1—figure supplement 7.. Fraction of non-recurrent missense mutations.
We calculated the fraction of genes with non-recurrent missense mutations of all genes with missense mutations. Although most mutated genes were non-recurrent across phylostrata, mutated MM genes are particularly non-recurrent (increasing trend). Red strip = UC phylostrata, green strip-EM phylostrata, blue strip = MM phylostrata.
Figure 1—figure supplement 8.
Figure 1—figure supplement 8.. Fraction of non-recurrent loss-of-function mutations.
We calculated the fraction of genes with non-recurrent loss-of-function mutations of all genes with loss-of-function mutations. Although most mutated genes were non-recurrent across phylostrata, mutated MM genes are particularly non-recurrent (increasing trend). Red strip = UC phylostrata, green strip-EM phylostrata, blue strip = MM phylostrata.
Figure 1—figure supplement 9.
Figure 1—figure supplement 9.. Presence of genes by phylostratum by fraction of aberrant chromosome.
The overall increasing trend across chromosomes and tumor types indicated that earlier genes tend to be located in more focal region of copy-number changes, whereas later genes tend to be located in regions of broad aberrations. There is an evident steep increase for MM genes in chrosomoes 1, 2, 3, 5, 7 (for amplifications), 13, 17 (for deletions) and 22 (for both amplifications and deletions).
Figure 2.
Figure 2.. Point mutations in EM genes affect mostly regulators, whereas CNAs in EM genes affect downstream targets.
(A) Diagram of a GRN distinguishing regulator and target genes. The number of outgoing edges from a regulator corresponds to its out-degree, whereas the number of incoming edges to a target gene is denoted by its in-degree. (B) Percentage of regulators of each age. Regulators are enriched in early metazoan genes (Fisher enrichment test p=6.48×10⁻⁶), with over half being EM (56.42%). (C) Average number of incoming edges for targets of each age. EM genes are also among the mostly highly regulated genes, with an average of 8.76 regulators controlling their activity, compared to 6.59 and 4.54 regulating UC and MM downstream target genes. (D) GRN diagram. EM genes (green) are highly interconnected, acting as master regulators and highly regulated targets. (E) Fraction of mutated regulator and target genes by each mutation type. A greater proportion of regulators are affected by recurrent point mutations than CNAs (0.20 vs 0.12; left), whereas the opposite trend is observed for targets (Wilcoxon test p=2.95×10⁻⁵). (F) Ratio of out-degree/in-degree (log2) of genes with mutations. EM genes are strongly biased toward a preferential regulatory role when point mutated, whereas the CNAs of EM genes preferentially occurs in those with a strong downstream target role. Points represent the median values for each tumor type and bars represent the range between the upper and lower quantiles.
Figure 2—figure supplement 1.
Figure 2—figure supplement 1.. Distribution of out-degree of regulators in the GRN.
Genes in the upperquantile of the distribution (log10 out-degree greater or equal than 1) were selected as master regulators.
Figure 2—figure supplement 2.
Figure 2—figure supplement 2.. Degree of genes across multiple molecular networks.
Although in protein-protein interaction networks (PahtwayCommons, Biogrid and WebIM) UC genes are the most highly connected, in the GRN EM genes are more likely to be hubs. The normalized degree was obtained by dividing the degree of genes by the median values of each database. The PathwayCommons network was obtained by excluding edges related to metabolites and chemicals, as well as those annotated as ‘controls-expression-of’. The decreasing trend of the association between degree and gene age was significant for the PathwayCommons, Biogrid and WebIM databases (Jonckheere-Terpstra Benjamini-Hochberg adjusted p-value<10−16), but not for the GRN (p-value=0.338). In the GRN, EM genes tend to have a higher degree than UC and MM genes (Wilcoxon test p-value for each case <10−16).
Figure 2—figure supplement 3.
Figure 2—figure supplement 3.. Distribution of in-degree of target genes in the GRN.
EM genes tended to have a greater in-degree than UC and MM genes (Wilcoxon test p<2.2×10⁻¹⁶ in both cases), indicating these genes are highly regulated.
Figure 2—figure supplement 4.
Figure 2—figure supplement 4.. Fraction of regulators and targets with mutations.
Genes with point mutations, especially LoF mutations, affect a higher fraction of regulators than genes with amplifications or deletions (Wilcoxon p for LoF mutations = 1.10×10⁻⁷, for missense mutations = 1.73×10⁻⁴). In contrast, genes with amplifications and deletions affect a higher fraction of target genes than genes with point mutations (p=3.54×10⁻⁶ for amplifications and p=4.08×10⁻⁶ for deletions).
Figure 2—figure supplement 5.
Figure 2—figure supplement 5.. Fraction of mutated regulator and target genes by each mutation type.
Recurrent point mtuations were derived using MutSig2CV, and significant driver CNAs by Gistic. Point mutations affected a higher fraction of regulators (mean fraction altered = 0.44) than CNAs (0.10) in all of tumor types with at least three recurrent point mutations or CNAs (Wilcoxon test p=1.84×10⁻¹¹). In contrast, CNAs were more likely to affect downstream target genes without a regulatory role than regulators (Wilcoxon test p=1.84×10⁻¹¹) (mean fraction altered = 0.90 for CNAs, 0.56 for point mutations). This dichotomy was even more pronounced in somatic mutations that were recurrent in at least 7 of the 30 tumor types. Whereas only 10.66% of genes with recurrent CNAs across tumors were regulators, this number was seven times larger (73.33%) for genes with point mutations. In contrast, 89.34% of CNAs recurrent across tumors affected downstream target genes, but only 26.67% of point mutations affected targets.
Figure 2—figure supplement 6.
Figure 2—figure supplement 6.. Ratio of out-degree/in-degree (log2) of genes with mutations.
EM genes with point mutations held the strongest regulatory role across tumors (median ratio = 1.88), whereas UC and MM genes with point mutations did less so (median ratio = 1.33 and 0.27, respectively). In contrast, EM genes with CNAs were the strongest skewed toward being highly regulated downstream targets (median ratio = 0.41), even compared to UC and MM genes with CNAs (median ratio UC = 0.50 and MM = 0.42). Points represent the median values for each tumor type and bars represent the range between the upper and lower quantiles.
Figure 3.
Figure 3.. Point mutations in regulators affect UC-EM gene regulation.
(A) Classification of regulators by the age of their downstream targets. UC-t regulators mostly regulate UC genes, EM-t regulators EM genes, and UC/EM-i regulators are at the interface of UC and EM genes. (B) (Lower panel) Percentage of UC, EM and MM target genes in regulators. (Upper panel) Distribution of recurrent point mutations (dark grey) and CNAs (light grey) across regulators. UC/EM-i regulators are enriched in point mutations. (C) Fraction of regulators with point mutations, CNAs and those non-recurrently altered. More than 85% of regulators affected by point mutations are UC/EM-i regulators. The fraction of regulators of each class affected by CNAs is similar to those not affected by recurrent mutations, indicating a lack of preferential alteration of a particular regulator class by CNAs. (D) Effect of point mutations in regulators on the expression of downstream targets. Point mutations with a high downstream effect (>5% differentially expressed targets) are more likely to be UC/EM-i regulators of EM origin. Low impact mutations (<5% differentially expressed targets) affect a higher proportion of regulators of a UC origin.
Figure 3—figure supplement 1.
Figure 3—figure supplement 1.. Distribution of recurrent point mutations and CNAs identified by MutSig2CV and Gistic in regulators.
(A) (Lower panel) Percentage of UC, EM and MM target genes in regulators. (Upper panel) Distribution of recurrent point mutations (dark grey) and CNAs (light grey) across regulators. UC/EM-i regulators are enriched in point mutations. (B) Fraction of regulators with point mutations, CNAs and those non-recurrently altered. The majority of regulators with recurrent point mutations were UC/EM-i (81.82%), whereas this percentage was only 34.14% and 31.33% for regulators affected by CNAs or not recurrently mutated across tumor cohorts. Additionally, only a small subset of point-mutated regulators were UC-t (9.09%) EM-t (9.09%). This indicates preference for the point mutation of UC/EM-i regulators.
Figure 3—figure supplement 2.
Figure 3—figure supplement 2.. Distribution of CNAs and point mutations across recurrently mutated regulators.
Mutated UC-t and EM-t regulators were preferentially affected by CNAs (10/10 mutated UC-t regulators, 33/34 mutated EM-t regulators), whereas UC/EM-i regulators had the highest proportion of regulators affected by point mutations (6/21, 28.57%).
Figure 3—figure supplement 3.
Figure 3—figure supplement 3.. Effect of point mutations in regulators on the expression of downstream genes.
Point mutations with a high impact (>5% differentially expressed downstream genes) are more likely to affect EM genes, rather than those with a limited downstream effect (<5%). The prevalence was calculated as the ratio of number of EM regulators over the number of UC regulators in each category. The log10 values were calculated to normalize to zero.
Figure 4.
Figure 4.. CNAs directly regulate the expression of UC and EM target genes.
(A) Fraction of downstream targets with CNAs in regulators. Targets of UC-t and EM-t regulators are more likely to be affected by CNAs than targets of UC/EM-i regulators. (B) Percentage of differentially expressed target genes with amplifications. UC and EM target genes are more likely to be upregulated after amplifications compared to younger, mammal-specific genes (Jonckheere-Terpstra decreasing trend test p-value: 0.0028). A similar trend is found for the downregulation of deleted genes (Figure 4—figure supplement 2). (C) Median percentage of differentially expressed CNA genes per regulator class across tumors. Amplified and deleted target genes of UC-t regulators are more likely to be differentially expressed (median 78.27% and 75.00%, respectively), whereas few CNA target genes of UC/EM-i regulators are DE (median 21.05% and 23.33%, respectively). Deleted targets of EM-t regulators are more likely to be downregulated (50.00%) than amplifications are upregulated (33.33%). No preference is evident for targets of UC/EM-i regulators. (D) Fraction of target genes with CNAs when their regulators are CNA or CNN. A higher fraction of target genes are CNA when UC-t and EM-t regulators are CNN than when they are CNA (Wilcoxon test p=1.36×10⁻⁷ and p=1.11×10−42, respectively), indicating a preference for the alteration of targets of these regulators. However, UC/EM-i regulators display the opposite trend, although not significant. (E) Difference in the fraction of downstream targets altered by CNAs when their regulators are CNN or CNA. Values less than 0 indicate a higher fraction of CNA targets when the regulator is CNN. This trend is evident across UC-t regulators (71.70%) and EM-t regulators (71.30%), but not for UC/EM-i regulators (28.72%).
Figure 4—figure supplement 1.
Figure 4—figure supplement 1.. Targets are more likely differentially expressed after CNAs than regulators.
We calculated the difference in the percentage of differentially expressed targets and regulators that were CNA. Values greater than 0 indicate a higher percentage of differentially expressed targets than regulators. The trend is evident for amplifications in all tumor types, and for deletions in 64.64% of the tumor types.
Figure 4—figure supplement 2.
Figure 4—figure supplement 2.. Percentage of differentially expressed target genes with CNAs.
UC and EM target genes are more likely to be upregulated after amplifications and downregulated after deletions compared to younger, mammalian-specific genes. Jonckheere-Terpstra decreasing trend test: amplifications p-value: 0.0028, deletions p-value: 0.0021.
Figure 4—figure supplement 3.
Figure 4—figure supplement 3.. The median fraction of targets with CNAs by regulator status.
Copy-number normal (CNN) regulators have a higher fraction of targets with CNAs than CNA regulators (Wilcoxon one-sided p-value=4.10×10⁻²⁹).
Figure 4—figure supplement 4.
Figure 4—figure supplement 4.. Difference in the fraction of downstream targets altered by CNAs when their regulators are CNN or CNA.
A higher fraction of CNA targets with a CNN regulator is observed for UC-t and EM-t regulators, but not for UC/EM-i regulators, regardless of regulator age. However, the opposite trend is more pronounced in UC/EM-i regulators of early metazoan origin.
Figure 5.
Figure 5.. UC/EM-i regulators are fundamental to tumor development and drug response.
(A) Fraction of known cancer drivers of each regulator class. While only 33% of regulators are UC/EM-i, 47% of cancer drivers are UC/EM-i regulators, indicating an enrichment of this regulator class in genes involved in cancer development. (B) Enrichment of regulators to which cancer cell lines are dependent, as demonstrated by gene knockout. Dependency of cancer cell lines to regulators is associated with regulator class, with an enrichment of UC-t and UC/EM-i regulators and a depletion of EM-t regulators. (C) Difference in cell line regulator dependency associated with mutational status. Most cells increase their dependency to specific regulators with point mutations or amplifications, indicating that the mutation of these genes are important for cancer cell survival. This is especially true for UC/EM-i regulators (55%, pie chart). Only regulators with a difference in the median dependency of at least 0.2 are shown. Asterisks denote regulators with significantly different dependency scores between cell lines where the gene was point mutated and non-point-mutated, and the rest those that were significantly different between cell lines where the gene was amplified and non-amplified. (D) Correlation between the probability of cell line dependency to UC/EM-i regulators and the IC50 of drugs. (Top left) Expected association between the dependency to the IGF1R regulator and the sensitivity to the IGF1R- inhibitor, BMS-536924. (Top right) Cell lines dependent to ILK show a greater sensitivity to the B-catenin pathway inhibitor (XAV939). (Bottom row) Cell lines dependent on PPRC1 showed increased sensitivity to mTOR inhibitors (temsirolimus) and RNA helicase A inhibitors (YK-4–279).
Figure 5—figure supplement 1.
Figure 5—figure supplement 1.. Number of driver and clonal point mutated regulators in 100 non-small-cell lung cancers from the TRACERx study (Jamal-Hanjani et al., 2017) and 50 breast cancers (Yates et al., 2015) obtained by Caravagna et al. (2018).
A high prevalence of UC/EM-i regulators as clonal drivers across lung cancer and breast cancer patients is observed, with a significant enrichment (p=1.16×10⁻¹¹) of UC/EM-i regulators among clonal driver genes with point mutations in the TRACERx dataset.
Figure 5—figure supplement 2.
Figure 5—figure supplement 2.. Distribution of probabilities of dependency to regulators from the Avana CRISPR-Cas9 genome-scale knockout dataset.
The knockout of regulators generally reveals a low probability of dependency (the highest point of the distributions is close to 0). However, the knockout of a small number of regulators reveal a high probability of dependency (inset).
Figure 5—figure supplement 3.
Figure 5—figure supplement 3.. Odds ratio of dependency of regulators in cancer cell lines after knockout at different probability cutoffs.
Regardless of the cutoff used, UC-t and UC/EM-i regulators are enriched (odds ratio >0) in regulators with high dependency.
Figure 5—figure supplement 4.
Figure 5—figure supplement 4.. Correlation between cell line dependency and IC50 Distribution of correlations between cell line dependency to regulators and the IC50 (ln) of 250 drugs.
We selected correlations < −0.25 and with a p-value<0.05 as significant.
Figure 5—figure supplement 5.
Figure 5—figure supplement 5.. Significant correlations between the probability of dependency to UC/EM-i regulators and the IC50 (ln) of drugs.
Only significant (p<0.05) Spearman correlations (<−0.25) were selected, which are cases where an increased dependency to the regulator was associated greater drug sensitivity at lower concentrations (lower IC50).
Figure 5—figure supplement 6.
Figure 5—figure supplement 6.. Distribution of correlations of the probability of cell-line dependency to regulators and the IC50 (ln) of drugs.
The red line indicates the genes whose probability of dependency is significantly correlated (correlation <0.25 and p<0.05) with the IC50 of the drug.
Figure 5—figure supplement 7.
Figure 5—figure supplement 7.. Correlation between drug sensitivity per cell-life tissue type and PPRC1 cell-line dependency.
Drug sensitivity to dactolisib, docetaxel, temsirolimus and YK-4–279 is correlated with PPRC1 dependency across cells lines of multiple tissue types. The red line indicates a strong correlation of at lest −0.25.
Appendix 1—figure 1.
Appendix 1—figure 1.. Results obtained using the TRRUST and RegNetwork databases pertaining to network composition and distribution of mutations in regulators and targets.
The top row corresponds to results obtained with TRRUST, and the bottom row those obtained with RegNetwork. The results are largely consistent with those obtained with the GRN from PathwayCommons.
Appendix 1—figure 2.
Appendix 1—figure 2.. Results obtained using the TRRUST and RegNetwork databases related to the regulatory and target roles of genes with point mutations and CNAs.
In both the TRRUST (A) and RegNetwork (B), EM genes with point mutations have a stronger regulatory role (high out-degree/in-degree ratio) than UC and MM genes with point mutations. In contrast, genes affected by CNAs have a mostly target role.
Appendix 1—figure 3.
Appendix 1—figure 3.. Concordance of regulator classification across databases.
The classification shown on the left corresponds to that obtained with GRN from PathwayCommons. Many regulators are only found in this databases (large sections of dark red). Although there is some variability in the classification of regulators across databases, UC/EM-i regulators are more likely to be classified as such by the three databases (green lines).
Appendix 1—figure 4.
Appendix 1—figure 4.. Results obtained using the TRRUST and RegNetwork databases pertaining to point mutations and CNAs in different classes of regulators.
The top row corresponds to results obtained with TRRUST, and the bottom row those obtained with RegNetwork. The results are largely consistent with those obtained with the GRN from PathwayCommons.
Author response image 1.
Author response image 2.

Similar articles

Cited by

References

    1. Aktipis CA, Boddy AM, Jansen G, Hibner U, Hochberg ME, Maley CC, Wilkinson GS. Cancer across the tree of life: cooperation and cheating in multicellularity. Philosophical Transactions of the Royal Society B: Biological Sciences. 2015;370:20140219. doi: 10.1098/rstb.2014.0219. - DOI - PMC - PubMed
    1. Aktipis CA, Nesse RM. Evolutionary foundations for cancer biology. Evolutionary Applications. 2013;6:144–159. doi: 10.1111/eva.12034. - DOI - PMC - PubMed
    1. Arenas-Mena C. The origins of developmental gene regulation. Evolution & Development. 2017;19:96–107. doi: 10.1111/ede.12217. - DOI - PubMed
    1. Armenia J, Wankowicz SAM, Liu D, Gao J, Kundra R, Reznik E, Chatila WK, Chakravarty D, Han GC, Coleman I, Montgomery B, Pritchard C, Morrissey C, Barbieri CE, Beltran H, Sboner A, Zafeiriou Z, Miranda S, Bielski CM, Penson AV, Tolonen C, Huang FW, Robinson D, Wu YM, Lonigro R, Garraway LA, Demichelis F, Kantoff PW, Taplin ME, Abida W, Taylor BS, Scher HI, Nelson PS, de Bono JS, Rubin MA, Sawyers CL, Chinnaiyan AM, Schultz N, Van Allen EM, PCF/SU2C International Prostate Cancer Dream Team The long tail of oncogenic drivers in prostate cancer. Nature Genetics. 2018;50:645–651. doi: 10.1038/s41588-018-0078-z. - DOI - PMC - PubMed
    1. Atashrazm F, Dzamko N. LRRK2 inhibitors and their potential in the treatment of Parkinson's disease: current perspectives. Clinical Pharmacology : Advances and Applications. 2016;8:177–189. doi: 10.2147/CPAA.S102191. - DOI - PMC - PubMed

Publication types