. 2019 Mar:41:455-464.
doi: 10.1016/j.ebiom.2019.02.016. Epub 2019 Feb 23.

Increasing contribution of integrated forms to total HIV DNA in blood during HIV disease progression from primary infection

Affiliations

Increasing contribution of integrated forms to total HIV DNA in blood during HIV disease progression from primary infection

Pauline Trémeaux et al. EBioMedicine. 2019 Mar.

Abstract

Background: In the current context of research on HIV reservoirs, offering new insights into the persistence of HIV DNA in infected cells, which prevents viral eradication, may aid in identifying cure strategies. This study aimed to describe the establishment of stable integrated forms among total HIV DNA during primary infection (PHI) and their dynamics during the natural history of infection.

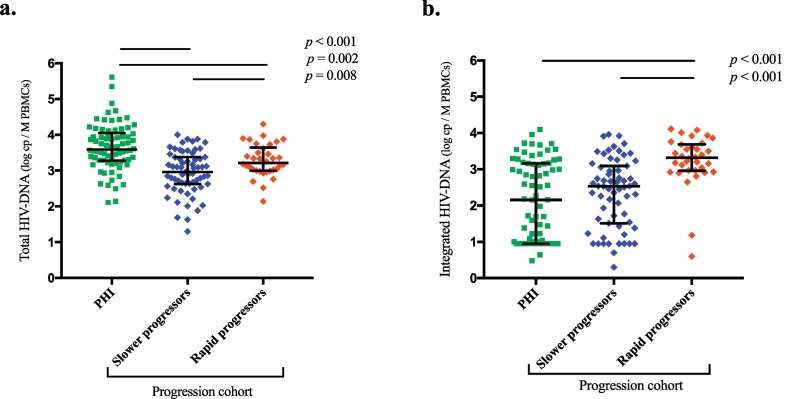
Methods: Total and integrated HIV DNA were quantified in blood from 74 PHI patients and 97 recent seroconverters (<12 months following infection, "progression cohort"). The evolution of both markers over six years was modelled (mixed-effect linear models). Their predictive values for disease progression were studied (Cox models).

Findings: For most patients during PHI, stable integrated forms were a minority among total HIV DNA (median: 12%) and became predominant thereafter (median at AIDS stage: 100%). Both total and integrated HIV DNA increased over a six-year period. Patients from the progression cohort who reached clinical AIDS during follow-up (n = 34) exhibited higher total and integrated HIV DNA levels at seroconversion and a higher percentage of integrated forms than did slower progressors (n = 63) (median: 100% vs 44%). The integrated HIV DNA load was strongly associated with the risk of developing AIDS (aRR = 2.63, p = 0.002).

Interpretation: The profile of "rapid" or "slower" progression in the natural history of HIV infection appears to be determined early in the course of HIV infection. The strong predominance of unstable unintegrated forms in PHI may explain the great benefit of this early treatment, which induces a sharp decrease in total HIV DNA. FUND: French National Agency for Research on AIDS and Viral Hepatitis.

Keywords: Acquired immunodeficiency syndrome; Integrated HIV DNA; Kinetics; Natural history; Primary HIV infection; Reservoirs; Total HIV DNA.


Figures

Fig. 1
Fig. 1
Total HIV DNA and integrated HIV DNA loads in the first year following infection. (a) Distribution with Loess regression of total HIV DNA (filled circles and solid line) and integrated HIV DNA (open circles and dotted line) according to the estimated time since infection (171 patients, one time point per patient at their inclusion in the ANRS-PRIMO cohort (PHI) or the ANRS-SEROCO cohort (progression cohort, divided into rapid and slower progressors)). (b) Repartition of integrated among total HIV DNA percentages according to the time since infection. These percentages were divided into four categories defined by the quartile values obtained for the 171 patients (light blue to purple, with Q1 = 2%, Q2 = 28%, Q3 = 85%). Patients were classified into five groups defined by the time since infection (in days). The bar chart represents the percentage of patients belonging to each category of integrated/total HIV DNA percentage. (For interpretation of the references to colour in this figure legend, the reader is referred to the web version of this article.)
Fig. 2
Fig. 2
Baseline HIV DNA levels during primary infection and recent seroconversion, according to further progression to clinical AIDS. Scatter dot plots display (a) total HIV DNA and (b) integrated HIV DNA loads for patients in the primary infection phase (PHI, ANRS-PRIMO cohort, <3 months since the estimated time of infection) and for the rapid progressors and slower progressors groups among the progression cohort (ANRS-SEROCO cohort, <1 year since infection). The bars represent median and interquartile range values.
Fig. 3
Fig. 3
Increase in total HIV DNA and integrated HIV DNA over six years of untreated infection. (a) Mixed-effect linear models (MELMs) describing the evolution of total HIV DNA over six years for rapid progressors (n = 34, 111 samples) and slower progressors (n = 63, 229 samples). (b) MELMs describing the evolution of integrated HIV DNA over six years for rapid progressors (107 samples) and slower progressors (207 samples). Samples obtained after six years of follow-up were not considered for inclusion in the MELMs to have enough results at each time point.
Fig. 4
Fig. 4
Proposed models for the dynamics of the different HIV DNA forms in blood reservoirs. HIV DNA loads are represented in log10 copies/106 PBMC. Note the breaks in the time axes. (a) Model for HIV DNA dynamics during the natural history of infection. During early PHI, total HIV DNA levels rise rapidly to reach a peak. Integrated HIV DNA shows a concomitant but much lower peak; the majority of HIV DNA is composed of unintegrated forms at that time [18]. Both total HIV DNA and integrated HIV DNA display a slight decrease thereafter, before reaching a more stable state. During chronic infection, both HIV blood biomarkers progressively increase, and the proportion of integrated forms increases. (b, c) Models of HIV DNA dynamics under treatment, depending on the timing of cART initiation. Efficient treatment initiation stops or significantly decreases viral replication and the infection of new cells [43]. Unintegrated HIV DNA forms, resulting from viral replication, are eliminated because of their lability or cell death, or they are diluted during cell division, without new production as a result of cART. In contrast, stable integrated HIV DNA can persist for a longer time. Thus, cART initiation at PHI (b), when the integrated HIV DNA level is low, induces a more pronounced and extended decrease of total HIV DNA than cART initiation during the chronic stage, when the predominance of stable integrated forms is already higher (c) [11,12]. Efficient treatment initiation stops the evolution of CD4+ T-cell subsets contributions to HIV reservoirs; they remain mainly composed of short-lived cells when cART is initiated during PHI [38,40], while long-lived cells are the major contributor to HIV DNA when cART is initiated during chronic infection [35,40]. This difference might explain the continued decrease in total HIV DNA after several years of treatment when cART is initiated early.

References

    1. Churchill M.J., Deeks S.G., Margolis D.M., Siliciano R.F., Swanstrom R. HIV reservoirs: what, where and how to target them. Nat Rev Microbiol. 2016;14(1):55–60. - PubMed
    1. Murray J.M., Zaunders J.J., McBride K.L. HIV DNA subspecies persist in both activated and resting memory CD4+ T cells during antiretroviral therapy. J Virol. 2014;88(6):3516–3526. - PMC - PubMed
    1. Avettand-Fenoel V., Chaix M.L., Blanche S. LTR real-time PCR for HIV-1 DNA quantitation in blood cells for early diagnosis in infants born to seropositive mothers treated in HAART area (ANRS CO 01) J Med Virol. 2009;81(2):217–223. - PubMed
    1. Bruner K.M., Murray A.J., Pollack R.A. Defective proviruses rapidly accumulate during acute HIV-1 infection. Nat Med. 2016;22(9):1043–1049. - PMC - PubMed
    1. Ho Y.C., Shan L., Hosmane N.N. Replication-competent noninduced proviruses in the latent reservoir increase barrier to HIV-1 cure. Cell. 2013;155(3):540–551. - PMC - PubMed