Coordinated calcium signalling in cochlear sensory and non-sensory cells refines afferent innervation of outer hair cells
- PMID: 30804003
- PMCID: PMC6484507
- DOI: 10.15252/embj.201899839
Coordinated calcium signalling in cochlear sensory and non-sensory cells refines afferent innervation of outer hair cells
Abstract
Outer hair cells (OHCs) are highly specialized sensory cells conferring the fine-tuning and high sensitivity of the mammalian cochlea to acoustic stimuli. Here, by genetically manipulating spontaneous Ca2+ signalling in mice in vivo, through a period of early postnatal development, we find that the refinement of OHC afferent innervation is regulated by complementary spontaneous Ca2+ signals originating in OHCs and non-sensory cells. OHCs fire spontaneous Ca2+ action potentials during a narrow period of neonatal development. Simultaneously, waves of Ca2+ activity in the non-sensory cells of the greater epithelial ridge cause, via ATP-induced activation of P2X3 receptors, the increase and synchronization of the Ca2+ activity in nearby OHCs. This synchronization is required for the refinement of their immature afferent innervation. In the absence of connexin channels, Ca2+ waves are impaired, leading to a reduction in the number of ribbon synapses and afferent fibres on OHCs. We propose that the correct maturation of the afferent connectivity of OHCs requires experience-independent Ca2+ signals from sensory and non-sensory cells.
Keywords: calcium waves; hair cells; pre‐hearing development; purinergic receptors; spontaneous activity.
© 2019 The Authors. Published under the terms of the CC BY 4.0 license.
Conflict of interest statement
The authors declare that they have no conflict of interest.
Figures
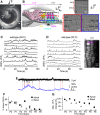
- A
Image of the mouse cochlea at P2 highlighting the apical and basal regions used for the experiments. The apical and basal regions were at a fractional distance along the coil of approximately 8–32% (corresponding to a frequency range in the mature mouse of ˜ 6–12 kHz) and 55–80% (˜ 25–45 kHz) from the apex, respectively.
- B
Diagram (left) showing a cross‐section of an early postnatal organ of Corti. OHCs: outer hair cells; IHCs: inner hair cells; GER: greater epithelial ridge, which includes non‐sensory cells such as the inner phalangeal cells (surrounding the IHCs) and tightly packed tall columnar cells forming the Kölliker's organ (KO); LER: lesser epithelial ridge. Right panels show DIC images of the cochlea at the level of the hair bundle (top) and both OHCs and non‐sensory Deiters’ cells in the LER region (bottom).
- C, D
Representative ΔF/F 0 traces from nine apical OHCs of a P2 wild‐type mouse (from the image in the right panel) recorded at body (C) and room (D) temperature. Traces are computed as pixel averages of regions of interest centred on OHCs. Calcium signals are evident in OHCs. In this and the following panels, the right image provides a visual representation of the spontaneous activity over the entire duration of the recordings (120 s) and was obtained by averaging 4,000 frames of raw data.
- E
Simultaneous cell‐attached patch clamp recording (top) and Ca2+ imaging (bottom) obtained from a P1 OHC from wild‐type mouse at room temperature. The intracellular Ca2+ level in OHCs increased rapidly but decayed with a relatively long fluorescence decay time constant (˜ 300 ms; Ceriani et al, 2016).
- F
Percentage of apical and basal OHCs showing spontaneous Ca2+ signals at near body temperature and as a function of postnatal age. Note that these values likely represent an underestimation of the fraction of active OHCs, since the three‐dimensional structure of the cochlea and the optical sectioning capability of 2‐photon microscopy make it difficult to be in the optimal focal conditions for the simultaneous recording of all three rows of OHCs. Moreover, active OHCs were those showing activity within the 2‐min recording time. Number of total OHCs and recordings from left to right were as follows: apical cochlea 384 and 8; 338 and 7; 441 and 10; 497 and 9; 466 and 10; 453 and 11; 254 and 6; and basal cochlea 408 and 9; 528 and 11; 460 and 10; 380 and 7; 676 and 12; 143 and 3; 133 and 4. Values are mean ± SEM.
- G
Maximum ΔF/F 0 changes in apical and basal active OHCs as a function of postnatal age. Number of active OHCs were as follows: apical cochlea 218; 189; 82; 336; 94; 39; 6; and basal cochlea 273; 303; 124; 46; 0; 0; 0. These OHCs came from the dataset in (F). Values are mean ± SEM.
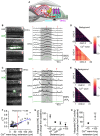
- A
Diagram showing a cross‐section of an immature organ of Corti. Spontaneous Ca2+ waves (curved red arrow) are generated in the non‐sensory cells present in the greater epithelial ridge (GER: red line).
- B, C
Three representative images (left panels) obtained before (1), during (2) and after (3) the spontaneous appearance of a wide (B) and a narrow (C) Ca2+ wave in the GER in the apical coils of P2 wild‐type mice. Right panels show representative ΔF/F 0 traces from 12 (B) and 8 (C) OHCs (black traces) and those originating from the Ca2+ wave in the GER (green traces). The grey‐shaded areas highlight the time window used for correlation analysis (see below). Recordings were made at 31°C.
- D, E
Correlation matrices computed from the Ca2+ fluorescence traces of 69 (D) and 72 (E) OHCs from panel (B) (large Ca2+ wave) and panel (C) (small Ca2+ wave). Correlation coefficients were computed before (top panels: background) and during (bottom panels: Ca2+ wave) the occurrence of the Ca2+ wave in nearby non‐sensory cells. Each matrix element represents the Spearman's rank correlation coefficient (r s: see Materials and Methods) of one pair of OHCs.
- F
Average Spearman's rank correlation coefficient (: see Materials and Methods) between the Ca2+ activity in OHCs as a function of the longitudinal extension of spontaneous Ca2+ waves in the GER from the apical coil of P1–P2 mouse cochleae. The average length of the apical‐coil segments used for these experiments was 188 ± 4 μm (see Materials and Methods). Grey dots represent Ca2+ waves that are associated with a significant increase in OHC correlation, while black dots represent events during which OHC correlation did not increase significantly. Waves travelling more than 75 μm in the longitudinal direction (red dashed line) always triggered a significant increase in OHC synchronization. Solid line in panel (F) represents a linear fit to the data. The slope was (2.60 ± 0.26)10−3 μm−1, significantly different from zero (P < 0.0001; ANOVA, f‐test).
- G
Fractional increase in the integral of the fluorescence Ca2+ traces recorded from OHCs as a function of their distance from the Ca2+ waves. Overall one‐way ANOVA: P = 0.0007. Number of recordings from left to right: 18, 19, 19, 7.
- H
Average increase in the integral of the Ca2+ traces in OHCs for small (< 75 μm) and large (> 150 μm) Ca2+ waves. Number of recordings: < 75 μm 56; < 150 μm 8. These two ranges were selected to emphasize the effect of the different extension of the Ca2+ waves recorded.

- A, B
Spontaneous activity recorded using the patch clamp technique from Deiters’ cells using whole‐cell voltage clamp (A) and current clamp (B) in a P1 mouse cochlea. Recordings were made at RT.
- C
Simultaneous recording of whole‐cell voltage responses in a Deiters’ cell in the LER (black trace) and a spontaneous Ca2+ wave from the GER (ΔF/F 0) of a Ca V 1.3 −/− P1 mouse (for wild‐type mouse cochlea, see Appendix Fig S1).
- D
Representative ΔF/F 0 traces (right traces) from the GER and one Deiters’ cell (arrowhead in the middle panel) of a P1 Ca V 1.3 −/− mouse. The red triangle (left panel) shows the fluorescence level before the Ca2+ wave, and the red circle (middle panel) shows the response during the wave. Note that the response in the GER occurs earlier than that in the Deiters’ cell (left), even though the rapid onset of the voltage change in the Deiters’ cell (C) gives the impression of an overlapping event. Traces are computed as pixel averages from a single non‐sensory cell in the GER and a Deiters’ cell positioned in the radial direction to the Ca2+ wave. The onset of the Ca2+ waves was defined by a fluorescence increase of five times the standard deviation of the background noise compared to baseline.

- A
Three representative images showing the small photo‐damaged region in the GER (top panel, small white rectangles and arrow), the initiation of the Ca2+ wave from the damaged non‐sensory cells (middle panel: arrow) and the full extent of the Ca2+ wave (bottom panel). Note the increase in fluorescence of OHCs during Ca2+ wave. The red regions of interest in the top panel are used to measure Ca2+ signals at the point where the Ca2+ wave was generated (GER1) and its propagation along the epithelium (GER2). The blue ROIs are those used to measure OHC Ca2+ signalling. Recording was performed at RT from wild‐type P2 mouse. The photo‐damage area was 55 μm2 in size (18 × 23 pixels) and typically covered the apical surface of ˜ 1–2 non‐sensory cells in the GER.
- B
Representative ΔF/F 0 traces from the GER (red traces) and OHCs (blue traces). Note that the six OHCs traces named “OHC1” are those closer to GER1 (photo‐damage region: see top panel A), while the eight OHC traces named “OHC2” are those near GER2 (far away from the photo‐damage region: see top panel A). Recordings were made at RT.
- C
Diagram showing the immature organ of Corti without the Deiters’ cells. Note that for these experiments two (as shown in the diagram) or all three rows of Deiters’ cells (usually spanning the distance of 5–10 OHCs) were removed prior to performing the Ca2+ imaging experiments.
- D, E
Average (D) and maximum (E) Ca2+ responses from apical OHCs (P2–P3) induced by photo‐damage of non‐sensory cells in the GER. Black trace and symbol (wild‐type cochlea with Deiters’ cells intact) are averages of 85 OHCs from nine recordings; blue trace and symbol (wild‐type cochlea in which one or no rows of Deiters’ cells were present) are averages of 72 OHCs from nine recordings; red trace and symbol (Ca V 1.3 −/− cochlea with Deiters’ cells intact but with electrically silent OHCs) are average of 175 OHCs from 10 recordings. Values in (E) are mean ± SEM.
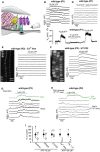
- A
Diagram showing a portion of the immature organ of Corti highlighting the experimental approach used to locally perfuse channel blockers and ATP directly to the basolateral membrane of OHCs in situ.
- B
Representative ΔF/F 0 traces from nine apical OHCs of a P1 wild‐type mouse during the application of 10 μM ATP. Data analysis as shown in Fig 1C.
- C
Voltage responses in whole‐cell current clamp from a P1 OHC of a wild‐type mouse during the extracellular application of 10 μM ATP alone or together with 200 μM of the P2X receptor blocker suramin. Suramin largely reduced the ATP‐induced OHC depolarization.
- D
Representative ΔF/F 0 traces from nine apical OHCs of a P1 wild‐type mouse during the application of 10 μM ATP + 200 μM suramin. Note that suramin prevents the occurrence of the large Ca2+ signals in OHCs. Data analysis as shown in Fig 1C.
- E, F
Representative ΔF/F 0 traces from 10 apical OHCs of P1 wild‐type mice (selected from the images in the left panels) during the application of 10 μM ATP in the absence of Ca2+ in the extracellular solution (E) or in the presence of the metabotropic P2Y receptor blocker U73122 (10 μM, F). Note that large OHC depolarizations obtained with ATP caused sustained Ca2+ signals.
- G, H
The P2Y agonist UTP (1 μM) caused increased Ca2+ signals in the Deiters’ cells, which directly elevate the firing activity of OHCs (G). Note that in the absence of Deiters’ cells (H) OHCs did not show Ca2+ responses.
- I
Histogram showing maximum ΔF/F 0 Ca2+ responses in P1–P2 OHCs to the extracellular application of ATP (10 μM or 100 μM) alone (black columns) and together with the purinergic receptor blockers suramin (200 μM) PPADS (100 μM) and U73122 (10 μM), Ca2+‐free extracellular solution and in Ca v 1.3 −/− mice. Experiments were performed in the absence of the Deiters’ cells. Responses in each condition are normalized to control experiments, carried out under the same imaging and dye‐loading conditions. Number of recordings shown above the columns. *P < 0.05, **P < 0.01, Mann–Whitney U‐test. Values are mean ± SEM.
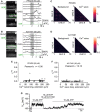
- A, B
Representative ΔF/F 0 traces from apical OHCs of wild‐type mice (selected from the images in the left panel) in the continuous presence of the non‐selective purinergic antagonist PPADS (A, P2) or the selective P2X3 antagonist A317491 (B, P1). Note the lack of synchronized Ca2+ activity in OHCs despite the presence of a large Ca2+ wave in the GER.
- C, D
Correlation matrices computed from the Ca2+ fluorescence traces of 75 (C: PPADS) and 70 (D: A317491) OHCs from panel (A and B), respectively. See Fig 2D and E legend for more details.
- E, F
Average Spearman's rank correlation coefficient (: see Materials and Methods) between the OHC activity as a function of the longitudinal extension of spontaneous Ca2+ waves in the GER from the apical coil of P1–P2 mouse cochleae in the presence of 50 μM PPADS (E, 16 recordings, 11 cochleae, 7 mice) or 50 μM A317491 (F, 17 recordings, 7 cochleae, 6 mice, 1,267 OHCs). Grey and black dots are as described in Fig 2. Solid lines represent a linear fit to the data. Slopes were not significantly different from zero [E: (−0.05 ± 0.13)10−3 μm−1 P = 0.699; F: (0.02 ± 0.03)10−3 μm−1 P = 0.444].
- G
Voltage responses in whole‐cell current clamp from a P2 OHC of a wild‐type mouse during the extracellular application of 10 μM ATP alone or together with 10 μM of the P2X3 receptor antagonist A317491. A317491 reversibly blocked the ATP‐induced OHC depolarization.

Representative ΔF/F 0 traces from nine apical OHCs of a P2 Cx30 −/− mouse (selected from the images in the left panel) recorded at 31°C. Data analysis as shown in Fig 1C.
Percentage of apical and basal OHCs showing spontaneous Ca2+ signals as a function of postnatal age. Number of total OHCs and recordings from left to right were as follows: apical cochlea 404 and 7; 156 and 3; 368 and 7; 454 and 8; 365 and 8; and basal cochlea 441 and 8; 375 and 6; 328 and 7; 487 and 9; 346 and 6. Values are mean ± SEM.
Average Spearman's rank correlation coefficient () between the OHC activity as a function of the longitudinal extension (C) of spontaneous Ca2+ waves in the GER from the apical coil of P1–P2 mouse cochleae (for additional details, see Fig 2F). Solid line represents a linear fit to the data. The slope was (1.36 ± 0.22)10−3 μm−1, significantly different from zero (P < 0.0001; ANOVA, f‐test).
Average increase in the integral of the Ca2+ traces in OHCs for small (< 75 μm, 136 recordings) and large (> 150 μm, four recordings) Ca2+ waves, as described in wild‐type cells (Fig 2H).
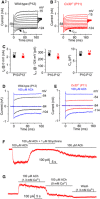
- A, B
Current responses in wild‐type (A) and Cx30 −/− (B) apical‐coil OHCs after their onset of maturity, which occurs at P7–P8. Outward currents were elicited by using depolarizing and hyperpolarizing voltage steps (10 mV increments) from −84 mV to the various test potentials shown by some of the traces.
- C
Average size of the total outward current measured at 0 mV (I K: left), the isolated I K,n measured as deactivating tail current at −124 mV (middle) and the membrane capacitance (C m: right) of P10–P12 OHCs. Values are mean ± SEM.
- D, E
Membrane currents recorded from OHCs in wild‐type (D, P12) and Cx30 −/− (E, P11) mice before and during superfusion of 100 μM ACh.
- F
In Cx30 −/− OHCs, the inward current elicited in 100 μM extracellular ACh at −90 mV was reversibly blocked by 1 μM strychnine, indicating the direct involvement of α9α10nAChRs.
- G
At −40 mV, the outward current in Cx30 −/− OHCs was prevented by an absence of Ca2+ in the extracellular solution, indicating the presence of SK2 channels.

- A–D
Maximum intensity projections of confocal z‐stack images that were taken from apical‐coil OHCs before (P4) and after (P10) their onset of functional maturation at P8 in wild‐type (A and C) and Cx30 −/− (B and D) mice. Immunostaining for ribbon synapses (CtBP2) is shown in red; Myo7a (blue) was used as the hair cell marker.
- E, F
Maximum intensity projections as in (A–D) from apical‐coil OHCs at P4 (E) and P10 (F) of Cav1.3 −/− mice.
- G
Number of ribbons (CtBP2 puncta) in wild‐type, Cx30 −/− and Cav1.3 −/− OHCs at P4 and P10. Values are mean ± SEM. Number of OHCs analysed is shown above each average data point; four mice were used for each experimental condition. *** indicates P < 0.001, one‐way ANOVA, Bonferroni post‐test. Scale bars 10 μm.

- A–C
Prestin labelling was similar between the different mouse strains and as such was used as an OHC marker. Scale bars 10 μm.
- D–F
Immunostaining for peripherin (red) highlights outer spiral fibres (arrows) of type II spiral ganglion neurons in the wild‐type mouse cochlea (D). These outer spiral fibres cross below IHCs and spiral below OHCs towards the cochlear base. In Cx30 −/− (E) and Cav1.3 −/− (F) mice, there are fewer peripherin‐labelled outer spiral fibres than in wild‐type. In Ca V 1.3 −/− mice (F), the outer spiral fibres travel towards the cochlear base (arrows), as in the wild‐type (D), but some also spiral apically (asterisks).
Comment in
-
A choreography of intracellular Ca2+ and extracellular ATP to refine auditory nociceptors before hearing.EMBO J. 2019 May 2;38(9):e101980. doi: 10.15252/embj.2019101980. Epub 2019 Apr 11. EMBO J. 2019. PMID: 30975689 Free PMC article.
Similar articles
-
Oncomodulin regulates spontaneous calcium signalling and maturation of afferent innervation in cochlear outer hair cells.J Physiol. 2023 Oct;601(19):4291-4308. doi: 10.1113/JP284690. Epub 2023 Aug 29. J Physiol. 2023. PMID: 37642186 Free PMC article.
-
Hair cell maturation is differentially regulated along the tonotopic axis of the mammalian cochlea.J Physiol. 2020 Jan;598(1):151-170. doi: 10.1113/JP279012. Epub 2019 Dec 21. J Physiol. 2020. PMID: 31661723 Free PMC article.
-
Oncomodulin Regulates Spontaneous Calcium Signaling and Maturation of Afferent Innervation in Cochlear Outer Hair Cells.bioRxiv [Preprint]. 2023 Mar 2:2023.03.01.529895. doi: 10.1101/2023.03.01.529895. bioRxiv. 2023. Update in: J Physiol. 2023 Oct;601(19):4291-4308. doi: 10.1113/JP284690. PMID: 36909575 Free PMC article. Updated. Preprint.
-
Efferent Inhibition of the Cochlea.Cold Spring Harb Perspect Med. 2019 May 1;9(5):a033530. doi: 10.1101/cshperspect.a033530. Cold Spring Harb Perspect Med. 2019. PMID: 30082454 Free PMC article. Review.
-
Short-term plasticity and modulation of synaptic transmission at mammalian inhibitory cholinergic olivocochlear synapses.Front Syst Neurosci. 2014 Dec 2;8:224. doi: 10.3389/fnsys.2014.00224. eCollection 2014. Front Syst Neurosci. 2014. PMID: 25520631 Free PMC article. Review.
Cited by
-
Postnatal Development of the Subcellular Structures and Purinergic Signaling of Deiters' Cells along the Tonotopic Axis of the Cochlea.Cells. 2019 Oct 17;8(10):1266. doi: 10.3390/cells8101266. Cells. 2019. PMID: 31627326 Free PMC article.
-
Prior Acoustic Trauma Alters Type II Afferent Activity in the Mouse Cochlea.eNeuro. 2021 Nov 11;8(6):ENEURO.0383-21.2021. doi: 10.1523/ENEURO.0383-21.2021. Print 2021 Nov-Dec. eNeuro. 2021. PMID: 34607806 Free PMC article.
-
Absence of oncomodulin increases susceptibility to noise-induced outer hair cell death and alters mitochondrial morphology.Front Neurol. 2024 Oct 23;15:1435749. doi: 10.3389/fneur.2024.1435749. eCollection 2024. Front Neurol. 2024. PMID: 39507624 Free PMC article.
-
The Cl--channel TMEM16A is involved in the generation of cochlear Ca2+ waves and promotes the refinement of auditory brainstem networks in mice.Elife. 2022 Feb 7;11:e72251. doi: 10.7554/eLife.72251. Elife. 2022. PMID: 35129434 Free PMC article.
-
Failure Of Hearing Acquisition in Mice With Reduced Expression of Connexin 26 Correlates With the Abnormal Phasing of Apoptosis Relative to Autophagy and Defective ATP-Dependent Ca2+ Signaling in Kölliker's Organ.Front Cell Neurosci. 2022 Mar 3;16:816079. doi: 10.3389/fncel.2022.816079. eCollection 2022. Front Cell Neurosci. 2022. PMID: 35308122 Free PMC article.
References
-
- Anselmi F, Hernandez VH, Crispino G, Seydel A, Ortolano S, Roper SD, Kessaris N, Richardson W, Rickheit G, Filippov MA, Monyer H, Mammano F (2008) ATP release through connexin hemichannels and gap junction transfer of second messengers propagate Ca2+ signals across the inner ear. Proc Natl Acad Sci USA 105: 18770–18775 - PMC - PubMed
-
- Bleasdale JE, Fisher SK (1993) Use of U73122 as an inhibitor of phospholipase Ca dependent processes. Neuroprotocols 3: 125–133
Publication types
MeSH terms
Substances
Grants and funding
LinkOut - more resources
Full Text Sources
Molecular Biology Databases
Miscellaneous

