

Histidine is selectively required for the growth of Myc-dependent dedifferentiation tumours in the Drosophila CNS
- PMID: 30804004
- PMCID: PMC6443203
- DOI: 10.15252/embj.201899895
Histidine is selectively required for the growth of Myc-dependent dedifferentiation tumours in the Drosophila CNS
Abstract
Rewired metabolism of glutamine in cancer has been well documented, but less is known about other amino acids such as histidine. Here, we use Drosophila cancer models to show that decreasing the concentration of histidine in the diet strongly inhibits the growth of mutant clones induced by loss of Nerfin-1 or gain of Notch activity. In contrast, changes in dietary histidine have much less effect on the growth of wildtype neural stem cells and Prospero neural tumours. The reliance of tumours on dietary histidine and also on histidine decarboxylase (Hdc) depends upon their growth requirement for Myc. We demonstrate that Myc overexpression in nerfin-1 tumours is sufficient to switch their mode of growth from histidine/Hdc sensitive to resistant. This study suggests that perturbations in histidine metabolism selectively target neural tumours that grow via a dedifferentiation process involving large cell size increases driven by Myc.
Keywords: Drosophila; dedifferentiation; histidine; metabolism; neuroblast.
© 2019 The Authors. Published under the terms of the CC BY 4.0 license.
Conflict of interest statement
The authors declare that they have no conflict of interest.
Figures
- A
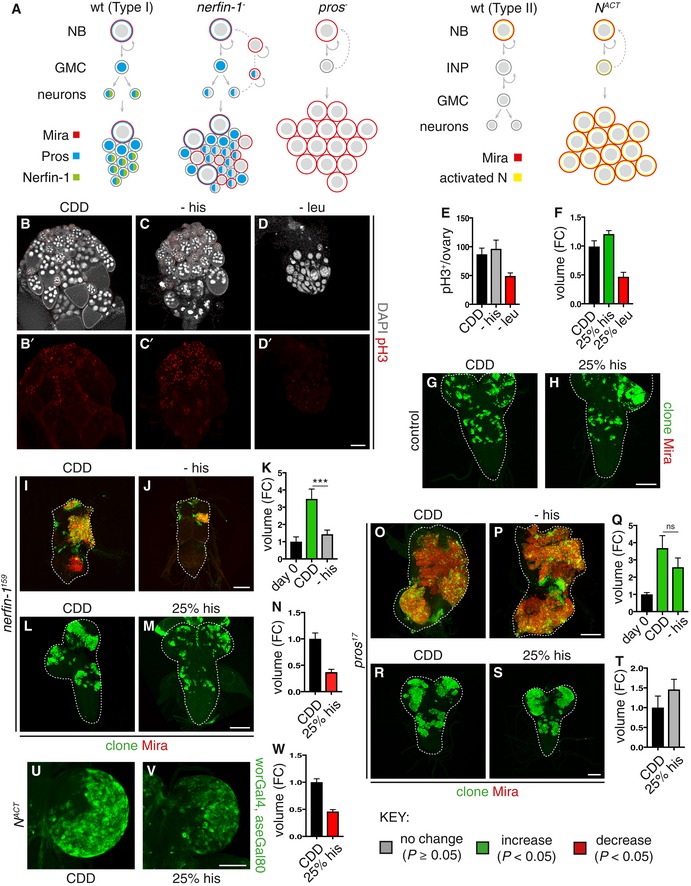
Schematic depicting wildtype NBs (left panel) which express Mira (red), undergoing asymmetric division to generate a GMC, which divides only once to give rise to two postmitotic neurons. The cell fate determinant Pros (blue) is inherited by the GMC, where it translocates to the nucleus to promote differentiation. Postmitotic neurons express Pros (blue) and Nerfin‐1 (green). Upon the loss of Nerfin‐1 (nerfin‐1 − , middle panel), neurons undergo stepwise reversion, by increasing cellular growth, and switching on stem cell genes while maintaining the expression of neuronal‐specific markers such as Pros, before their complete reversion to NBs, giving rise to clones consisting a mixture of NBs and neurons. In pros − clones, GMCs fail to differentiate and revert to NBs, giving rise to clones consisting mostly of Mira+ NBs. Schematic depicting type II wildtype NB lineages (left) and dedifferentiation of INP to NBs upon Notch overactivation, which gives rise to clones consisting of mostly NBs (right).
- B–E
Representative pictures showing that the withdrawal of dietary leu but not his significantly reduced stem cells and follicle cell proliferation (pH3, red) in the adult ovary after 10 days, quantified in (E) (n = 13, 14, 13), scale bar = 100 μm.
- F–H
Representative pictures showing that wildtype larval NB clonal growth was significantly reduced after 6 days of dietary leucine depletion (25% leu) and significantly increased by dietary histidine depletion (25% his), quantified in (F) (n = 28, 22, 7), scale bar = 50 μm
- I–K
Representative pictures showing that adult nerfin‐1 clonal growth was significantly reduced on −his diet compared to CDD (measured at day 0, and day 9) quantified in (K) (n = 27, 110, 136). Scale bar = 75 μm. ***P < 0.001
- L–N
Representative pictures showing that larval nerfin‐1 clonal growth was significantly reduced on 25% his diet compared to CDD (after 6 days), quantified in (N) (n = 53, 36). Scale bar = 50 μm.
- O–Q
Representative pictures showing that adult pros clonal growth was not significantly altered on −his diet compared to CDD (after 7 days), quantified in (Q) (n = 12, 23, 16). Scale bar = 75 μm.
- R–T
Representative pictures showing that larval pros clonal growth was not significantly altered by dietary histidine reduction (25% his) compared to CDD (after 6 days), quantified in (T) (n = 19, 13). Scale bar = 50 μm.
- U–W
Representative pictures showing that the growth of larval type II lineages overexpressing NACT significantly reduced dietary histidine reduction (25% his) compared to CDD, quantified in (W) (n = 27, 19). Scale bar = 100 μm.
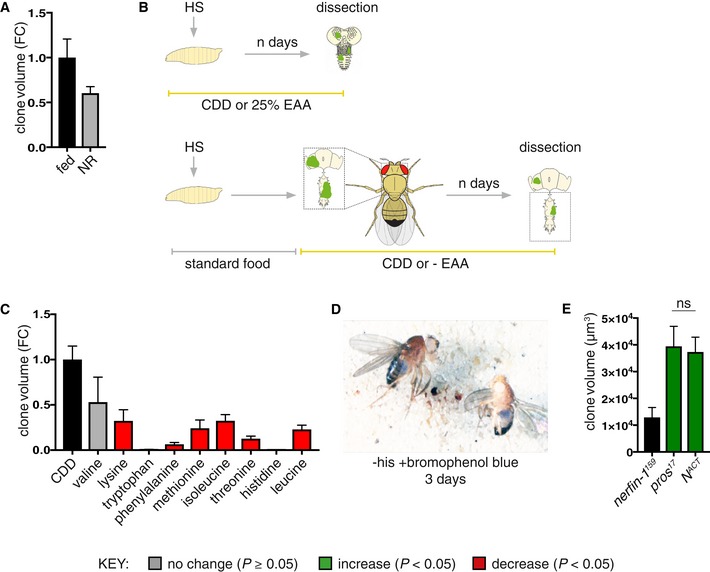
nerfin‐1 clones were induced at 48 h ALH and transferred to standard Drosophila media or agarose/PBS (nutrient restriction, NR) for 3 days, and clone size is reduced (though not significantly, P = 0.054) under NR (n = 90, 116).
Schematic depicting heat shock and dissection regimes for larval and adult EAA dietary manipulations.
Volume (fold change) of the sum of GFP+ nerfin‐1 clones per CNS in animals where clones were induced at 48 h ALH for 1 h and evaluated after 9 days of feeding on CDD or CDD‐EAAs (n = 17, 3, 8, 5, 12, 5, 10, 10, 17, 9).
w 118 adults (left, female, right, male) were fed a −his diet labelled with bromophenol blue; blue food was detected in the gut after 3 days of feeding.
Larval nerfin‐1, pros and N ACT clone volume, clones were induced at 48 h ALH and measured at 6 days ALH (n = 26, 11, 16). pros and N ACT are of comparable volume, ns = not significant.
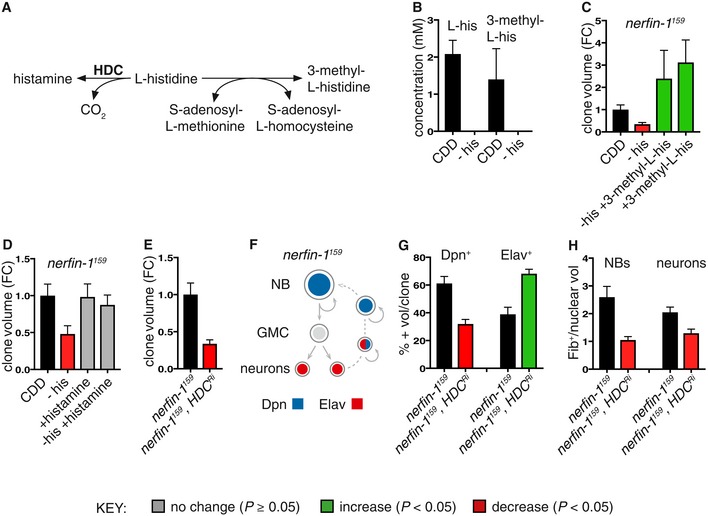
Schematic depicting the metabolic reaction between histidine and its downstream metabolites histamine and 3‐methyl‐L‐histidine.
Concentration of histidine and 3‐methyl‐L‐histidine from whole Drosophila adults extracts measured by 1H NMR after 3 days of feeding on either CDD or −his diet (n = 3, 3). Both compounds are reduced to below detection levels (< 0.3 mM) upon dietary his depletion.
Dietary supplementation of 3‐methyl‐L‐his for 4 days significantly increased adult nerfin‐1 clonal growth and rescued nerfin‐1 growth inhibition due to his dietary withdrawal (n = 18, 14, 7, 9).
Dietary supplementation of histamine does not significantly increase adult nerfin‐1 clone size, but can rescue nerfin‐1 clonal growth inhibition due to his dietary withdrawal (n = 42, 14, 23, 25).
Larval nerfin‐1 clonal growth is significantly decreased upon overexpression of HDC RNAi (n = 23, 36).
Schematic depicting stepwise neurons to NBs reversion in nerfin‐1 type I lineages where neurons express Elav, NBs express Dpn, and reverting neurons express both markers.
Hdc inhibition significantly reduced the percentage of Dpn+ NBs (n = 16, 17) and significantly increased the percentage of Elav+ neurons per clone (n = 16, 17).
HdcRi overexpression reduced cellular growth of nerfin‐1 NBs (n = 17, 19) and neurons (n = 36, 19) measured as the ratio of nucleolus/nuclear volume.
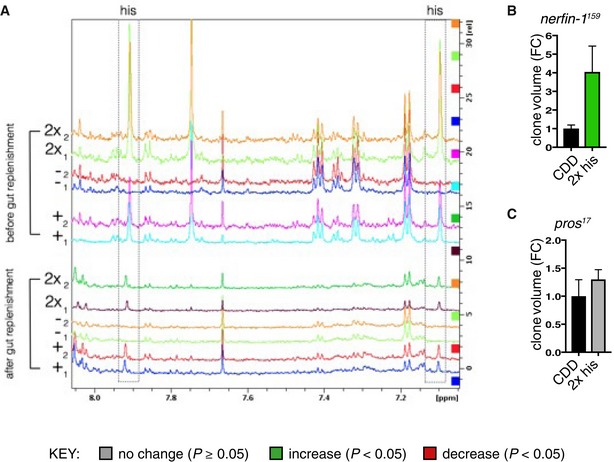
Spectra showing a region from 8.0 to 7.1 ppm from extracted whole adult fly polar metabolome before (upper panel) and after (lower panel) clearance of dietary histidine from the gut (see Materials and Methods), boxed panel highlights the histidine peak. Replica peaks for histidine are seen in the boxed areas at ˜7.9 (ε‐proton) and 7.1 (δ‐proton) ppm in histidine‐replete: “+” (0.5 g/l his) and “2x” (1.0 g/l his) CDD profiles; histidine peaks are not seen in “−” (0 g/l his) profiles in either panel.
nerfin‐1 − clone volume is increased by ˜4‐fold upon feeding on 2× his (n = 24, 15).
pros − clone volume did not significantly changed upon feeding on 2× his (n = 19, 34).
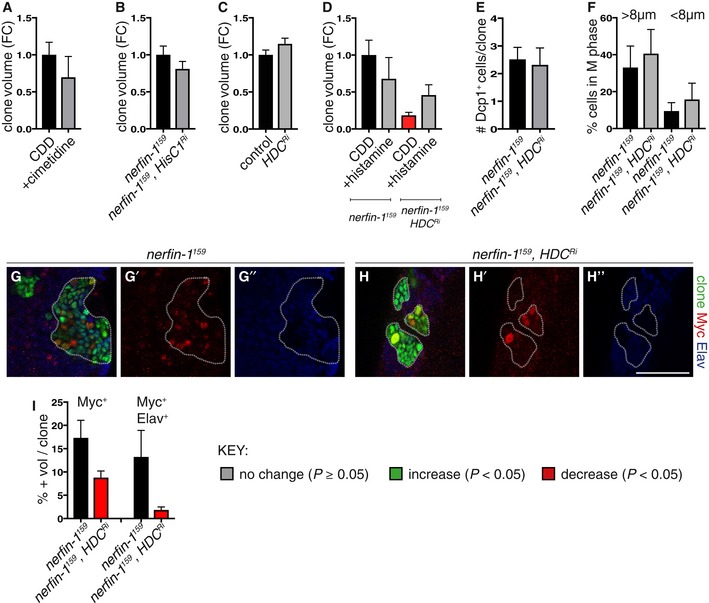
- A
500 mg/ml of the histamine receptor inhibitor cimetidine (n = 39, 23) did not significantly alter nerfin‐1 clonal growth in the adult CNS.
- B
Knockdown of histamine inhibitor HisCl1 (HisCl1Ri), knockdown verified in Oh et al, 2013, did not significantly alter nerfin‐1 clonal growth in the larval CNS (n = 37, 42).
- C
Hdc knockdown did not significantly alter the growth of wildtype larval CNS clones (n = 42, 36).
- D
Histamine supplementation did not significantly increase nerfin‐1 clone size, but significantly rescued nerfin‐1;HdcRi clonal growth in the larval CNS (n = 15, 10, 12, 9).
- E
Hdc knockdown did not significantly alter the amount of cell death in nerfin‐1 clones in the larvae (n = 43, 35).
- F
The speed of the cell cycle in fully dedifferentiated NBs > 8 μm (n = 11, 9) and dedifferentiating neurons < 8 μm (n = 11, 9) was not significantly altered by Hdc inhibition in nerfin‐1 larval clones.
- G–I
Representative pictures showing that Hdc inhibition significantly reduced the % of Myc+ NBs (red) and Myc+ Elav+ (blue) neurons in nerfin‐1 larval clones (G–H’’), quantified in (I) (n = 14, 14, 13, 16). Scale bar = 50 μm.
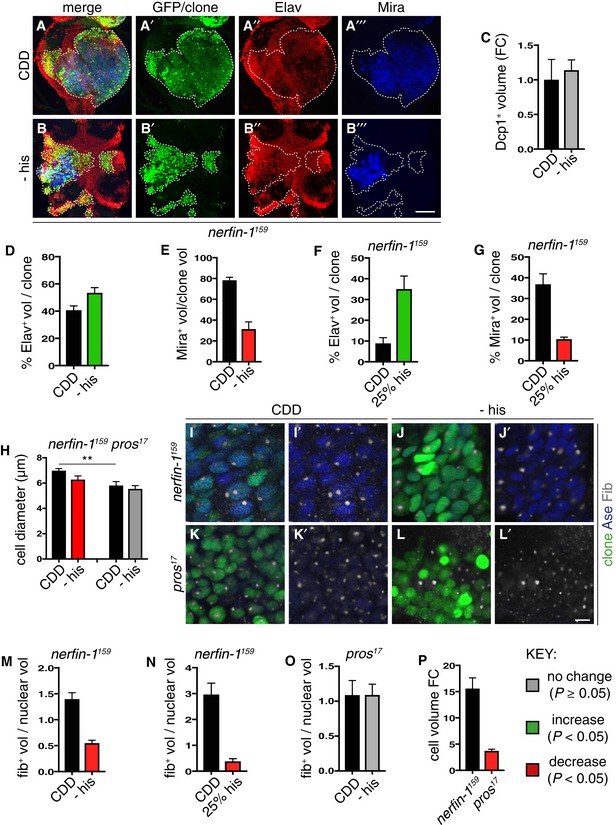
- A–E
Representative images of nerfin‐1 clones in the adult VNC after 6 days of feeding on CDD or −his diet, scale bar = 100 μm. Histidine dietary withdrawal resulted in clones containing significantly more differentiated Elav+ neurons (red) quantified in (D) (n = 16, 17) and significantly fewer Mira+ NBs (blue), quantified in (E) (n = 12, 22), without significantly altering the amount of cell death per clone quantified in (C) (n = 6, 7).
- F, G
Larval nerfin‐1 clones consisted of significantly greater proportion of differentiated neurons (n = 10, 7) and significantly reduced proportion of NBs per clone upon his dietary depletion (25% his, n = 9, 11).
- H–P
Representative images of adult nerfin‐1 (I–J’, green) and pros clones (K–L’, green), scale bar = 5 μm. In nerfin‐1 clones, the size of the NBs (Ase+, blue) was significantly reduced upon 6 days of histidine dietary withdrawal, quantified in (H) (n = 33, 20). Cellular growth measured as the ratio of nucleolus (Fib, white)/nuclear (Ase, blue) volume was also significantly reduced, quantified in (M) (n = 33, 20). In pros clones, the size of the NBs (Ase+ blue) and cellular growth measured as the ratio of nucleolus (Fib, white)/nuclear (Ase, blue) volume were not significantly altered upon 6 days of histidine dietary withdrawal, quantified in (H) (n = 9, 8) and (O) (n = 9, 7). Cellular growth measured as the ratio of nucleolus/nuclear volume was significantly reduced in larval nerfin‐1 NBs after 6 days his dietary reduction (25% his compared to CDD, n = 14, 6) quantified in (N). Panel (P) shows that the larval nerfin‐1 neuron‐to‐NB reversion requires 15‐fold increase in cellular volume (n = 10) and pros GMC‐to‐NB reversion requires approximately 3.5‐fold increase in cellular volume (n = 31).
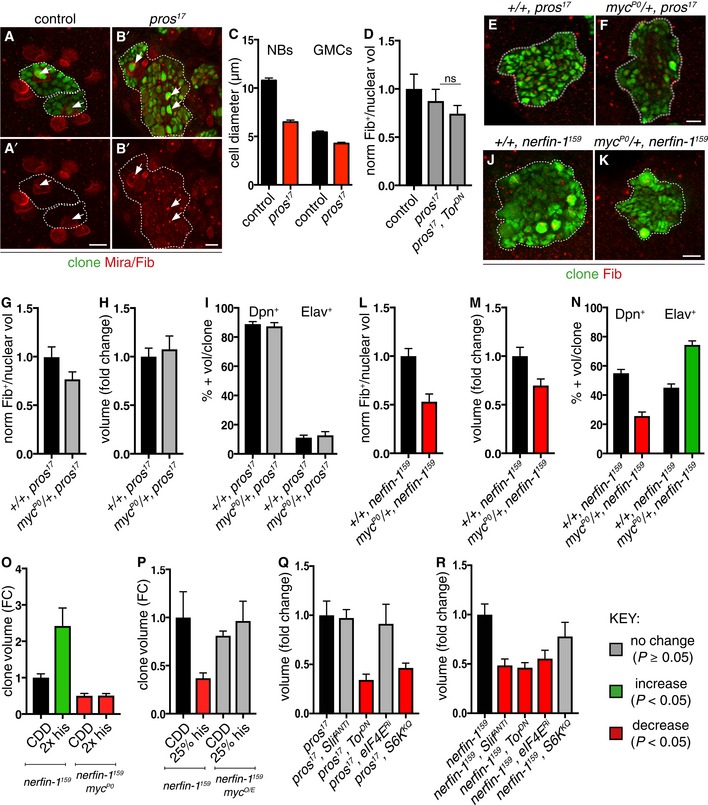
- A–D
Representative pictures showing that pros NBs and GMCs are smaller than wildtype (NBs and GMCs are distinguished at telophase, as a doublet of unequal size), quantified in (C) (n = 25, 31, 21, 16). pros NBs exhibit similar nucleolus/nuclear ratio (white arrows, nucleolus marked by Fib) compared to wildtype and pros;Tor DN NBs, quantified in (D) (n = 10, 18, 15).
- E–I
Representative pictures showing pros clones (green) generated in myc hypomorphic background did not significantly alter pros nucleolus/nuclear ratio (E, F), nucleolus labelled with Fib (red) [quantified in (G) (n = 44, 43)], clone size [quantified in (H) (n = 41, 34)] or the proportion of Dpn+ NBs and Elav+ neurons per clone [quantified in (I) (n = 15, 15, 15, 15)].
- J–N
Representative pictures showing that nerfin‐1 clones (green) generated in myc hypomorphic background (J, K) exhibited significantly reduced nucleolus/nuclear ratio, [nucleolus labelled with Fib (red)] and reduced clone size, quantified in (L) (n = 34, 27) and (M) (n = 106, 75), and displayed an increased proportion of differentiated Elav+ neurons and reduced proportion of Dpn+ NBs per clone, quantified in (N) (n = 20, 20, 20, 20). scale bar = 10 μm
- O
Reducing Myc dosage with the hypomorphic Myc allele, myc P0, abolished the increase in nerfin‐1 clone size mediated by 2× histidine dietary intake, 2× his (n = 41, 18, 10, 57).
- P
Overexpression of myc restored the growth of nerfin‐1 clones inhibited by histidine dietary reduction, 25% his (n = 51, 36, 39, 29).
- Q, R
pros (Q) and nerfin‐1 (R) clones are reduced upon Tor inhibition (n = 22, 63) compared to control (n = 51, 65), but their growth differentially depends on amino acid transporter Slif (n = 12, 32) and downstream growth regulators eIF4E (n = 21, 47) and S6K (n = 39, 37).
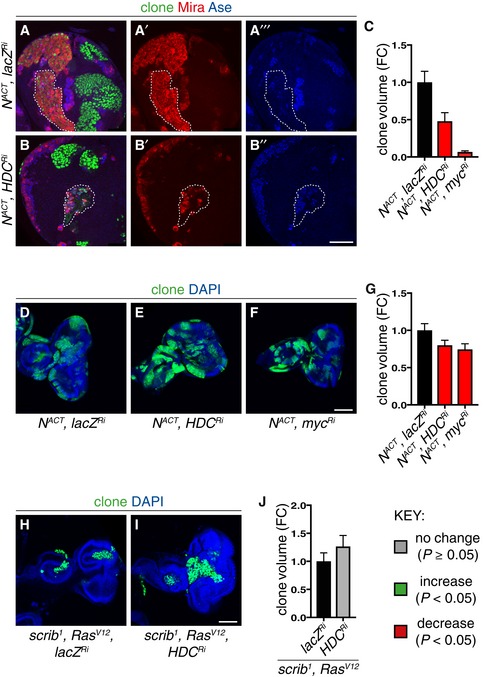
- A–C
Representative pictures showing that larval type II NACT MARCM clonal growth was significantly reduced by Hdc (A–B’’) and Myc knockdown, quantified in (C) (n = 11, 7, 7). Scale bar = 50 μm.
- D–G
Representative pictures showing that Myc (F) and Hdc (E) inhibition was sufficient to significantly reduce N ACT clonal growth in the larval eye imaginal epithelia, quantified in (G) (n = 75, 80, 75). Scale bar = 100 μm.
- H–J
Hdc inhibition did not significantly alter the growth of scrib 1 ;Ras V12 larval eye imaginal epithelia clones, quantified in (J) (n = 57, 33). Scale bar = 100 μm.
Similar articles
-
The transcription factor Nerfin-1 prevents reversion of neurons into neural stem cells.Genes Dev. 2015 Jan 15;29(2):129-43. doi: 10.1101/gad.250282.114. Genes Dev. 2015. PMID: 25593306 Free PMC article.
-
Myc in stem cell behaviour: insights from Drosophila.Adv Exp Med Biol. 2013;786:269-85. doi: 10.1007/978-94-007-6621-1_15. Adv Exp Med Biol. 2013. PMID: 23696362 Review.
-
Homeodomain protein Six4 prevents the generation of supernumerary Drosophila type II neuroblasts and premature differentiation of intermediate neural progenitors.PLoS Genet. 2021 Feb 8;17(2):e1009371. doi: 10.1371/journal.pgen.1009371. eCollection 2021 Feb. PLoS Genet. 2021. PMID: 33556050 Free PMC article.
-
The Brm-HDAC3-Erm repressor complex suppresses dedifferentiation in Drosophila type II neuroblast lineages.Elife. 2014 Mar 11;3:e01906. doi: 10.7554/eLife.01906. Elife. 2014. PMID: 24618901 Free PMC article.
-
Temporal patterning in neural progenitors: from Drosophila development to childhood cancers.Dis Model Mech. 2020 Jul 22;13(7):dmm044883. doi: 10.1242/dmm.044883. Dis Model Mech. 2020. PMID: 32816915 Free PMC article. Review.
Cited by
-
Histidine metabolism drives liver cancer progression via immune microenvironment modulation through metabolic reprogramming.J Transl Med. 2025 Mar 4;23(1):262. doi: 10.1186/s12967-025-06267-y. J Transl Med. 2025. PMID: 40038727 Free PMC article.
-
Dedifferentiation-derived neural stem cells exhibit perturbed temporal progression.EMBO Rep. 2023 Jun 5;24(6):e55837. doi: 10.15252/embr.202255837. Epub 2023 Apr 11. EMBO Rep. 2023. PMID: 37039033 Free PMC article.
-
Tumor models in various Drosophila tissues.WIREs Mech Dis. 2021 Nov;13(6):e1525. doi: 10.1002/wsbm.1525. Epub 2021 Mar 21. WIREs Mech Dis. 2021. PMID: 34730289 Free PMC article. Review.
-
Capillary Electrophoresis Electrospray Ionization Mass Spectrometry Reveals Metabolic Perturbations During Nematode Infection in Drosophila melanogaster.Molecules. 2025 May 1;30(9):2023. doi: 10.3390/molecules30092023. Molecules. 2025. PMID: 40363828 Free PMC article.
-
Metabolic Adaptations in Cancer and the Host Using Drosophila Models and Advanced Tools.Cells. 2024 Nov 29;13(23):1977. doi: 10.3390/cells13231977. Cells. 2024. PMID: 39682725 Free PMC article. Review.
References
-
- Bello BC, Hirth F, Gould AP (2003) A pulse of the Drosophila Hox protein Abdominal‐A schedules the end of neural proliferation via neuroblast apoptosis. Neuron 37: 209–219 - PubMed
-
- Bello B, Reichert H, Hirth F (2006) The brain tumor gene negatively regulates neural progenitor cell proliferation in the larval central brain of Drosophila . Development 133: 2639–2648 - PubMed
-
- Betschinger J, Mechtler K, Knoblich JA (2006) Asymmetric segregation of the tumor suppressor brat regulates self‐renewal in Drosophila neural stem cells. Cell 124: 1241–1253 - PubMed
-
- Bjordal M, Arquier N, Kniazeff J, Pin JP, Léopold P (2014) Sensing of amino acids in a dopaminergic circuitry promotes rejection of an incomplete diet in Drosophila . Cell 156: 510–521 - PubMed
Publication types
MeSH terms
Substances
Grants and funding
LinkOut - more resources
Full Text Sources
Molecular Biology Databases
