Evolution of the Highly Repetitive PEVK Region of Titin Across Mammals
- PMID: 30804022
- PMCID: PMC6469411
- DOI: 10.1534/g3.118.200714
Evolution of the Highly Repetitive PEVK Region of Titin Across Mammals
Abstract
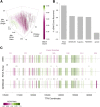
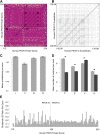
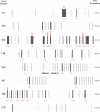
The protein titin plays a key role in vertebrate muscle where it acts like a giant molecular spring. Despite its importance and conservation over vertebrate evolution, a lack of high quality annotations in non-model species makes comparative evolutionary studies of titin challenging. The PEVK region of titin-named for its high proportion of Pro-Glu-Val-Lys amino acids-is particularly difficult to annotate due to its abundance of alternatively spliced isoforms and short, highly repetitive exons. To understand PEVK evolution across mammals, we developed a bioinformatics tool, PEVK_Finder, to annotate PEVK exons from genomic sequences of titin and applied it to a diverse set of mammals. PEVK_Finder consistently outperforms standard annotation tools across a broad range of conditions and improves annotations of the PEVK region in non-model mammalian species. We find that the PEVK region can be divided into two subregions (PEVK-N, PEVK-C) with distinct patterns of evolutionary constraint and divergence. The bipartite nature of the PEVK region has implications for titin diversification. In the PEVK-N region, certain exons are conserved and may be essential, but natural selection also acts on particular codons. In the PEVK-C, exons are more homogenous and length variation of the PEVK region may provide the raw material for evolutionary adaptation in titin function. The PEVK-C region can be further divided into a highly repetitive region (PEVK-CA) and one that is more variable (PEVK-CB). Taken together, we find that the very complexity that makes titin a challenge for annotation tools may also promote evolutionary adaptation.
Keywords: PEVK region; comparative genomics; gene prediction; molecular evolution; titin.
Copyright © 2019 Muenzen et al.
Figures


Similar articles
-
The elasticity of individual titin PEVK exons measured by single molecule atomic force microscopy.J Biol Chem. 2005 Feb 25;280(8):6261-4. doi: 10.1074/jbc.C400573200. Epub 2005 Jan 4. J Biol Chem. 2005. PMID: 15632200
-
Modeling AFM-induced PEVK extension and the reversible unfolding of Ig/FNIII domains in single and multiple titin molecules.Biophys J. 2001 Feb;80(2):597-605. doi: 10.1016/S0006-3495(01)76040-7. Biophys J. 2001. PMID: 11159428 Free PMC article.
-
Towards a molecular understanding of the elasticity of titin.J Mol Biol. 1996 Aug 9;261(1):62-71. doi: 10.1006/jmbi.1996.0441. J Mol Biol. 1996. PMID: 8760502
-
Sequence and mechanical implications of titin's PEVK region.Adv Exp Med Biol. 2000;481:53-63; discussion 64-6, 107-10. doi: 10.1007/978-1-4615-4267-4_4. Adv Exp Med Biol. 2000. PMID: 10987066 Review.
-
Stretching molecular springs: elasticity of titin filaments in vertebrate striated muscle.Histol Histopathol. 2000 Jul;15(3):799-811. doi: 10.14670/HH-15.799. Histol Histopathol. 2000. PMID: 10963124 Review.
Cited by
-
Alternative Splicing in the Heart: The Therapeutic Potential of Regulating the Regulators.Int J Mol Sci. 2024 Dec 4;25(23):13023. doi: 10.3390/ijms252313023. Int J Mol Sci. 2024. PMID: 39684734 Free PMC article. Review.
References
-
- Bang M. L., Centner T., Fornoff F., Geach A. J., Gotthardt M., et al. , 2001. The complete gene sequence of titin, expression of an unusual ≈700-kDa titin isoform, and its interaction with obscurin identify a novel Z-line to I-band linking system. Circ. Res. 89: 1065–1072. 10.1161/hh2301.100981 - DOI - PubMed
Publication types
MeSH terms
Substances
Associated data
LinkOut - more resources
Full Text Sources
