

Limits to the world's green water resources for food, feed, fiber, timber, and bioenergy
- PMID: 30804199
- PMCID: PMC6421454
- DOI: 10.1073/pnas.1817380116
Limits to the world's green water resources for food, feed, fiber, timber, and bioenergy
Abstract
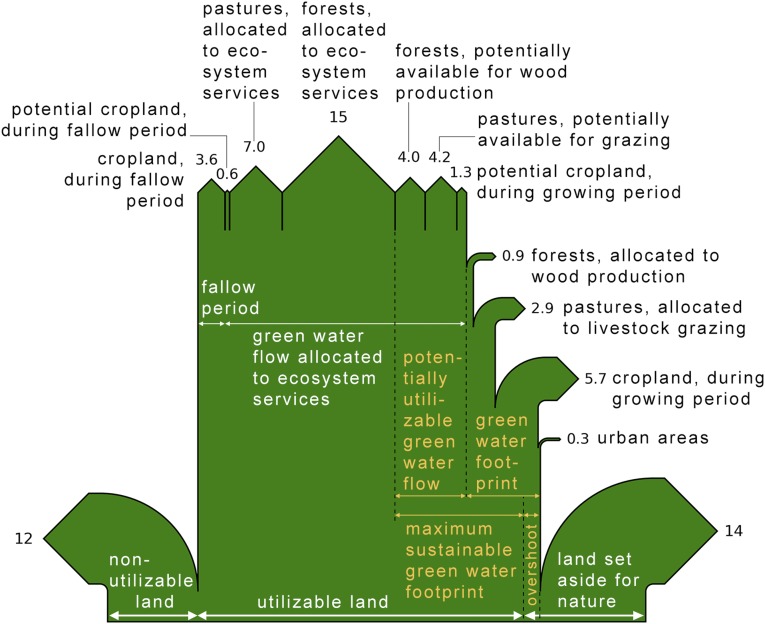
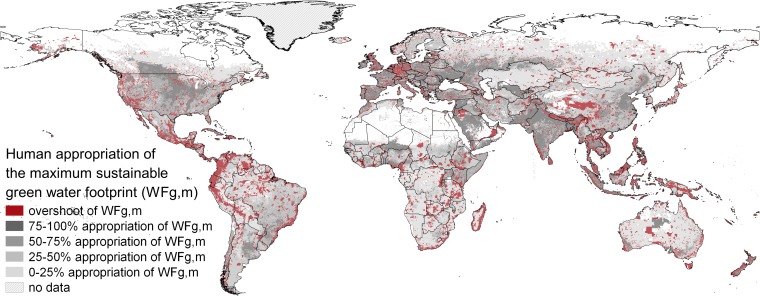
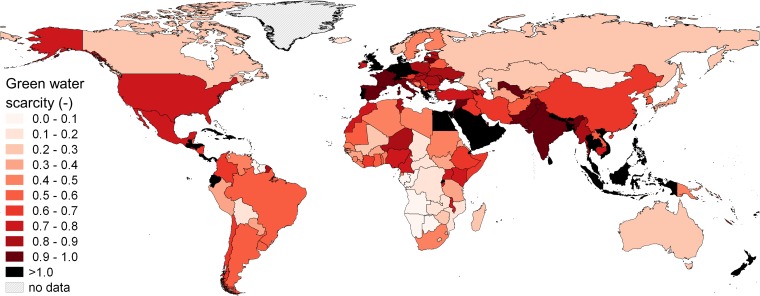
Green water--rainfall over land that eventually flows back to the atmosphere as evapotranspiration--is the main source of water to produce food, feed, fiber, timber, and bioenergy. To understand how freshwater scarcity constrains production of these goods, we need to consider limits to the green water footprint (WFg), the green water flow allocated to human society. However, research traditionally focuses on scarcity of blue water--groundwater and surface water. Here we expand the debate on water scarcity by considering green water scarcity (WSg). At 5 × 5 arc-minute spatial resolution, we quantify WFg and the maximum sustainable level to this footprint (WFg,m), while accounting for green water requirements to support biodiversity. We then estimate WSg per country as the ratio of the national aggregate WFg to the national aggregate WFg,m We find that globally WFg amounts to 56% of WFg,m, and overshoots it in several places, for example in countries in Europe, Central America, the Middle East, and South Asia. The sustainably available green water flows in these countries are mostly or fully allocated to human activities (predominately agriculture and forestry), occasionally at the cost of green water flows earmarked for nature. By ignoring limits to the growing human WFg, we risk further loss of ecosystem values that depend on the remaining untouched green water flows. We emphasize that green water is a critical and limited resource that should explicitly be part of any assessment of water scarcity, food security, or bioenergy potential.
Keywords: green water; water consumption; water footprint; water scarcity; water sustainability.
Copyright © 2019 the Author(s). Published by PNAS.
Conflict of interest statement
The authors declare no conflict of interest.
Figures
Comment in
-
Rainfall recycling needs to be considered in defining limits to the world's green water resources.Proc Natl Acad Sci U S A. 2019 Apr 23;116(17):8102-8103. doi: 10.1073/pnas.1903554116. Epub 2019 Apr 9. Proc Natl Acad Sci U S A. 2019. PMID: 30967500 Free PMC article. No abstract available.
References
-
- Oki T, Kanae S. Global hydrological cycles and world water resources. Science. 2006;313:1068–1072. - PubMed
-
- Falkenmark M, Rockström J. Building water resilience in the face of global change: From a blue-only to a green-blue water approach to land-water management. J Water Res Plann Manage. 2010;136:606–610.
-
- Savenije HHG. Water scarcity indicators; the deception of the numbers. Phys Chem Earth Part B Hydrol Oceans Atmos. 2000;25:199–204.
-
- Wada Y, Wisser D, Bierkens MFP. Global modeling of withdrawal, allocation and consumptive use of surface water and groundwater resources. Earth Syst Dyn. 2014;5:15–40.
Publication types
MeSH terms
Substances
LinkOut - more resources
Full Text Sources
