. 2019 Apr 19;294(16):6531-6549.
doi: 10.1074/jbc.RA118.004867. Epub 2019 Feb 25.

Polo-like kinase 4 maintains centriolar satellite integrity by phosphorylation of centrosomal protein 131 (CEP131)

Affiliations

Polo-like kinase 4 maintains centriolar satellite integrity by phosphorylation of centrosomal protein 131 (CEP131)

Ryan A Denu et al. J Biol Chem. .

Abstract

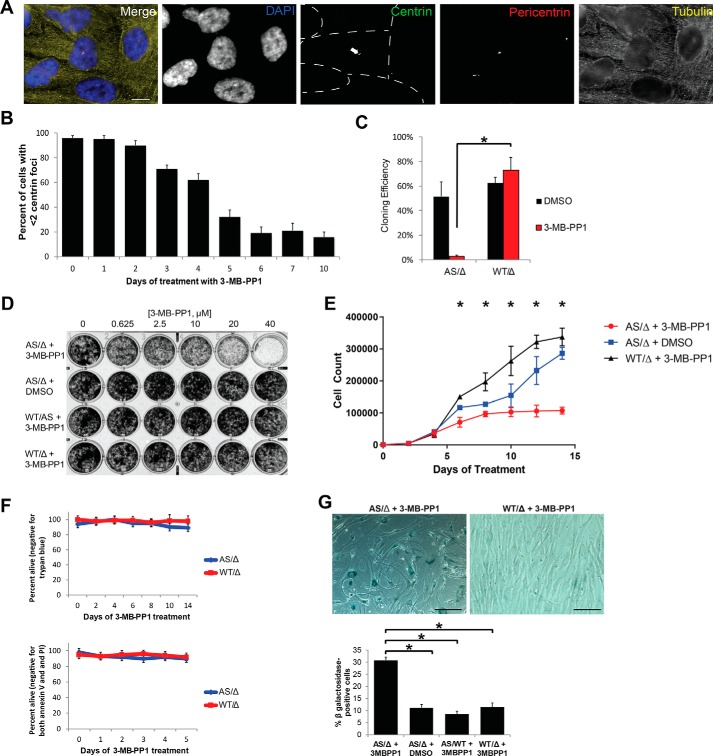
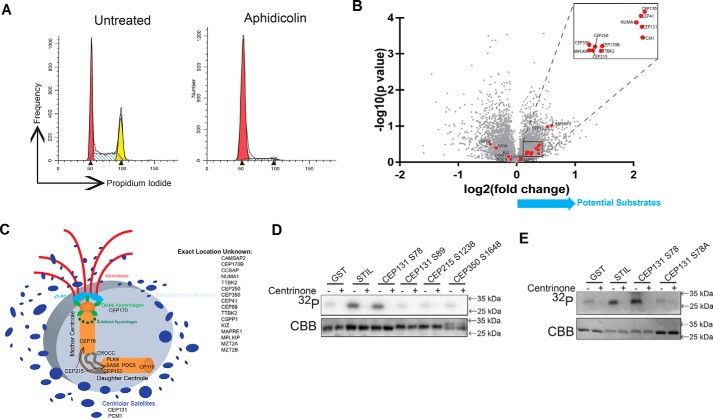
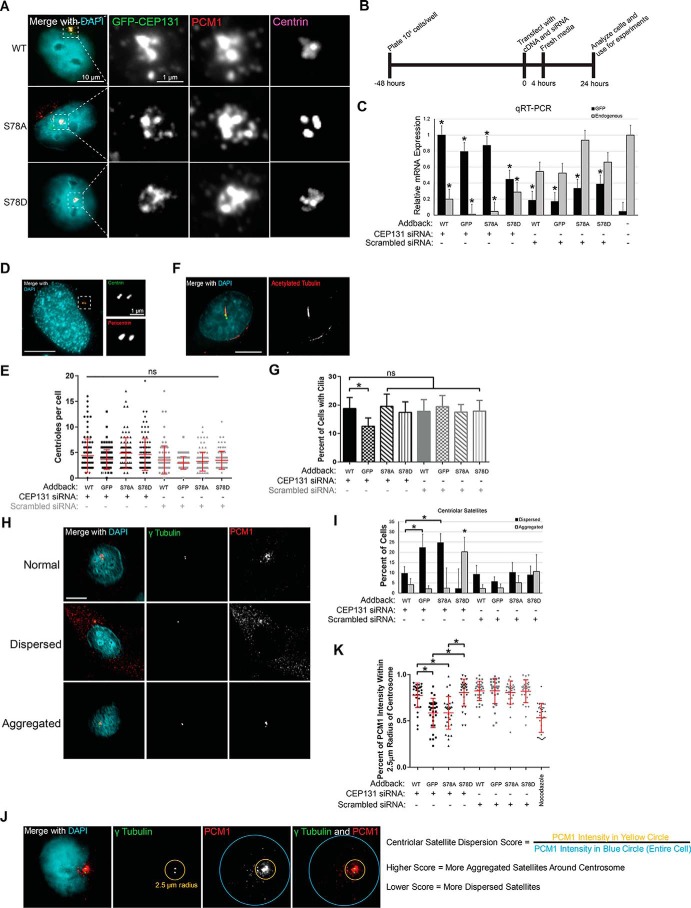
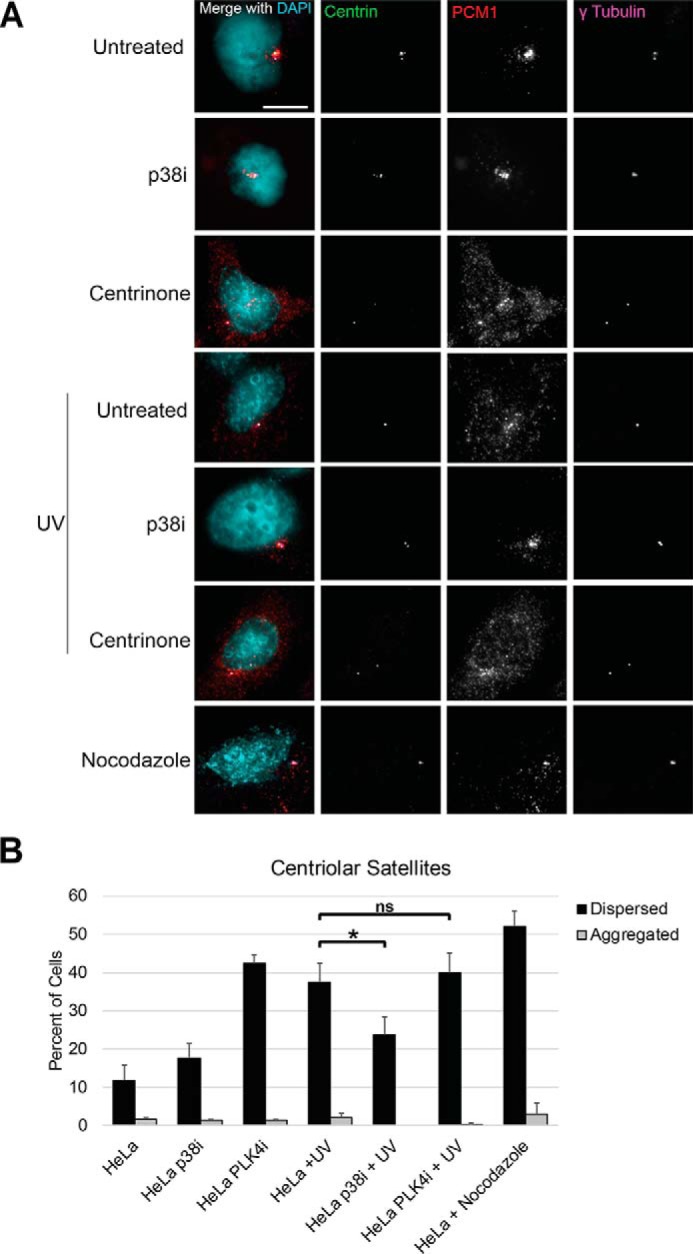
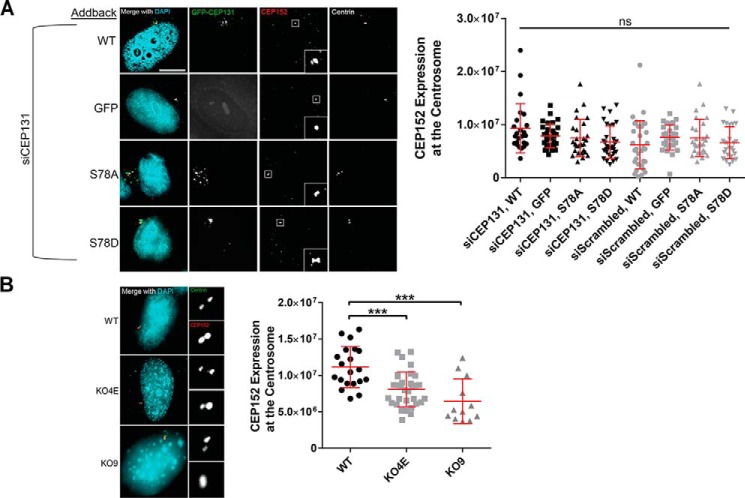
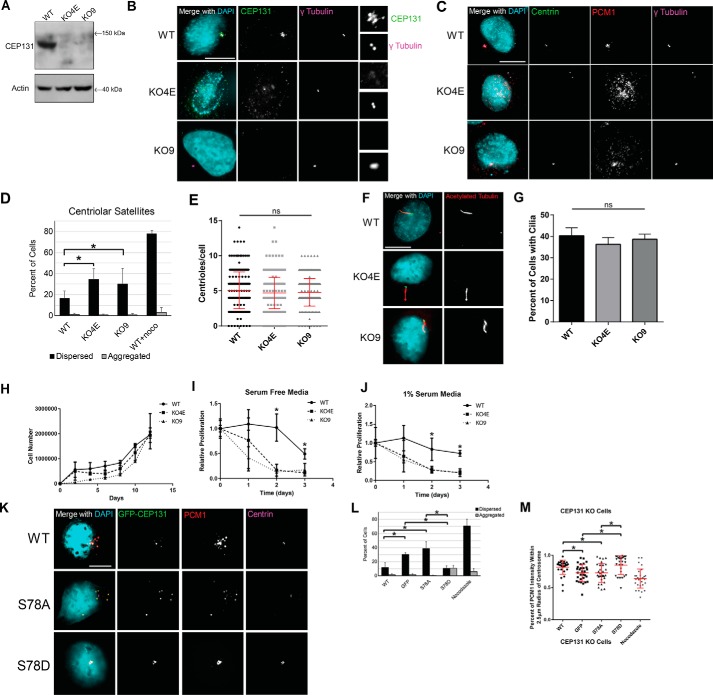
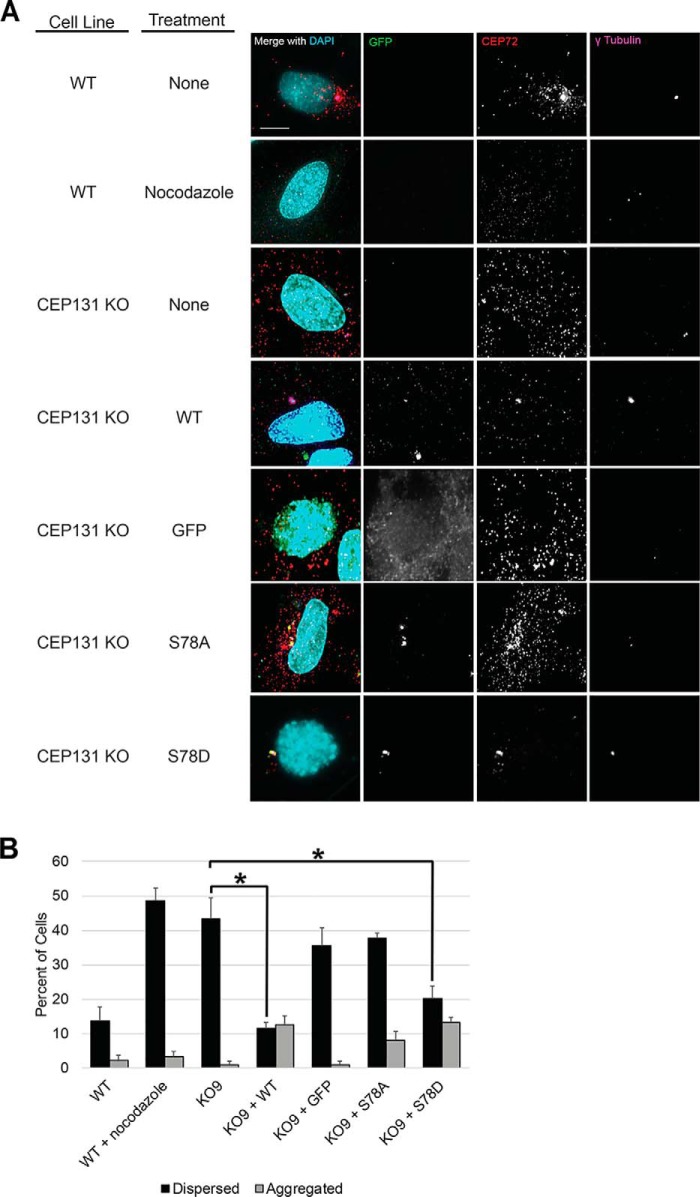
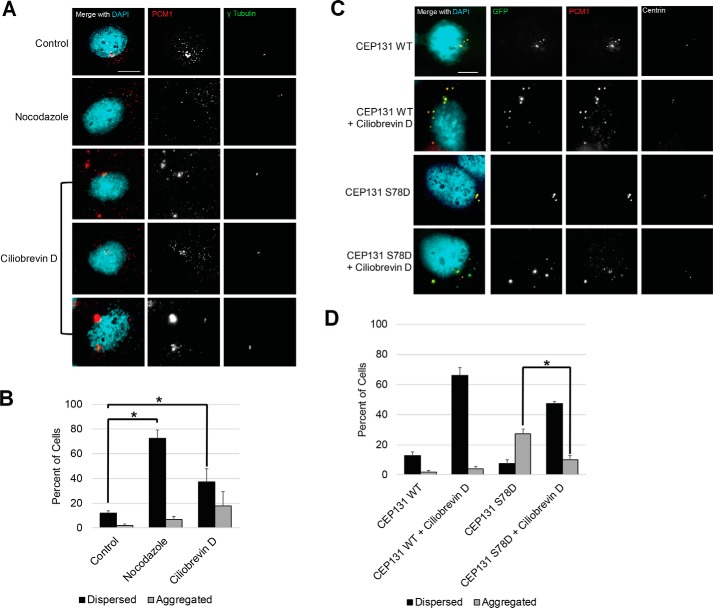
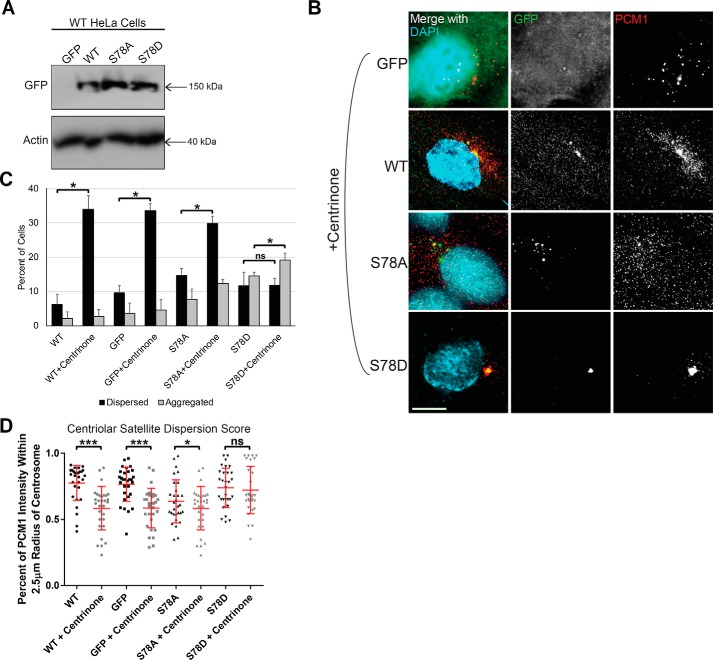
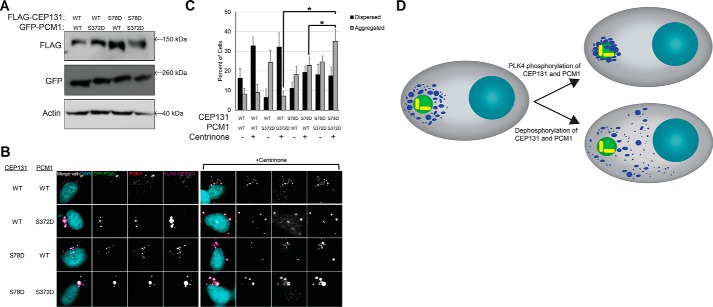
The centrosome, consisting of two centrioles surrounded by a dense network of proteins, is the microtubule-organizing center of animal cells. Polo-like kinase 4 (PLK4) is a Ser/Thr protein kinase and the master regulator of centriole duplication, but it may play additional roles in centrosome function. To identify additional proteins regulated by PLK4, we generated an RPE-1 human cell line with a genetically engineered "analog-sensitive" PLK4AS, which genetically encodes chemical sensitivity to competitive inhibition via a bulky ATP analog. We used this transgenic line in an unbiased multiplex phosphoproteomic screen. Several hits were identified and validated as direct PLK4 substrates by in vitro kinase assays. Among them, we confirmed Ser-78 in centrosomal protein 131 (CEP131, also known as AZI1) as a direct substrate of PLK4. Using immunofluorescence microscopy, we observed that although PLK4-mediated phosphorylation of Ser-78 is dispensable for CEP131 localization, ciliogenesis, and centriole duplication, it is essential for maintaining the integrity of centriolar satellites. We also found that PLK4 inhibition or use of a nonphosphorylatable CEP131 variant results in dispersed centriolar satellites. Moreover, replacement of endogenous WT CEP131 with an S78D phosphomimetic variant promoted aggregation of centriolar satellites. We conclude that PLK4 phosphorylates CEP131 at Ser-78 to maintain centriolar satellite integrity.

Keywords: CEP131; PLK4; cell division; centriolar satellite; centriole; centriole duplication; centrosome; chemical biology; chemical genetics; chromosome segregation; mass spectrometry (MS); microtubule; phosphoproteomics.


Conflict of interest statement

M. E. B. is on the medical advisory board of Strata Oncology and receives research funding from Abbvie, Genentech, Puma, and Loxo Oncology

Figures

Figure 1.
Figure 1.
Validation of PLK4 chemical genetic system. A, representative images of RPE PLK4 AS cells treated with 10 μm 3-MB-PP1 for 5 days. Individual cells are outlined with dotted lines in the centrin image, and the arrow points to the one cell in the image with centrioles. Scale bar, 5 μm. B, centrosomes were quantified after treatment with 3-MB-PP1 for the indicated times. Bars represent the average of 3 biological replicates of 100 cells each ± S.E. (error bars). C, PLK4AS/Δ and PLK4WT/Δ were subcloned by limiting dilution, and cloning efficiency was assessed using a Poisson correction. D, proliferation was assessed by culturing cells in the indicated concentration of 3-MB-PP1 for 7 days and then staining with crystal violet. E, 1000 cells were plated per well in a 6-well plate (day −2), and 3-MB-PP1 was added on day 0. Cells were counted every 2 days. Each point represents the average of three technical replicates ± S.E. F, cells were cultured for 7 days with DMSO or 3-MB-PP1, and apoptosis was assessed by both trypan blue exclusion assay and staining with propidium iodide and anti-annexin V followed by flow cytometric detection. The percentage of cells staining negative for both propidium iodide and annexin V is plotted. G, senescence was assessed by β-gal staining after 14 days of culture with 3-MB-PP1. The micrographs are representative images of the staining, and the bar graphs quantify the percentage of senescent cells. All experiments in this figure utilized RPE cells. *, p < 0.05.
Figure 2.
Figure 2.
PLK4 phosphorylates CEP131 Ser-78. A, cell cycle profile of cells arrested with aphidicolin to enrich RPE PLK4 AS cells in the G1/S transition, which is when centriole duplication occurs and therefore when PLK4 is active. These cells were utilized for MS. B, volcano plot of −log10(p value) versus log2(-fold change) for the centrosome components (red dots) that were identified in the MS screen. C, diagram of the centrosome showing where each of these proteins is thought to localize; derived from Ref. . D, GST-tagged peptides and PLK4 kinase domain were purified from Escherichia coli and utilized for in vitro kinase assays. GST serves as a negative control, and STIL serves as a positive control. Centrinone B is a PLK4 inhibitor. E, an S78A mutation was created in the CEP131 peptide and purified for in vitro kinase assay to confirm that PLK4 phosphorylates CEP131 Ser-78.
Figure 3.
Figure 3.
PLK4 phosphorylation of CEP131 maintains centriolar satellite integrity. A, localization of WT CEP131 and S78A and S78D mutants in WT HeLa cells. The dotted white box is enlarged for the adjacent gray scale images showing GFP, PCM1, and centrin at the centrosome. Scale bar sizes are indicated on the images. B, knockdown addback experiment timeline. C, quantitative RT-PCR experiment demonstrating the efficiency of knockdown and addback of CEP131. Asterisks demonstrate significant enrichment of GFP-tagged CEP131 versus endogenous GFP (black bars) or significant depletion of endogenous CEP131 versus untreated cells (gray bars). D and E, images and quantification of centriole duplication. Each dot represents one cell, and bars represent means ± S.D. (error bars) of at least 100 cells/condition. Centrioles were identified by counting centrin foci. For example, the image in D shows two centrosomes with four total centrioles. F and G, images and quantification of ciliogenesis. Cilia were marked by staining for acetylated tubulin. At least 300 total cells were analyzed per condition. H and I, images and quantification of centriolar satellites. At least 300 total cells were analyzed per condition. J, schema of a more quantitative approach to assess centriolar satellites. The yellow circle measures the PCM1 intensity within a 2.5-μm radius of the center of the centrosome, whereas the blue circle measures the PCM1 intensity in the entire cell. K, quantification of centriolar satellites using the schema described in J. Nocodazole is used as a positive control for centriolar satellite dispersion. All experiments in this figure utilize HeLa cells. Bars, means ± S.E. (error bars) from three independent experiments. Scale bars, 10 μm. *, p < 0.05. NS, not significant.
Figure 4.
Figure 4.
PLK4 activity is not required for centriolar satellite remodeling in response to UV. A, representative images of centriolar satellites (PCM1 staining) in HeLa cells under the indicated conditions. The p38 inhibitor (p38i) utilized was SB203580. Scale bar, 10 μm. B, quantification of centriolar satellites as aggregated or dispersed. DAPI, 4′,6-diamidino-2-phenylindole. Bars, averages ± S.D. (error bars) for one independent experiment. *, p < 0.05; ns, not significant. Scale bar, 5 μm.
Figure 5.
Figure 5.
Effects of S78A and S78D mutations on CEP131 interaction with CEP152. A, HeLa cells were simultaneously transfected with CEP131 siRNA and the indicated GFP-tagged CEP131 construct. Cells were then fixed and stained for CEP152. The amount of CEP152 at the centrosome was quantified and is shown in the adjacent dot plot. Insets in the CEP152 images show magnified CEP152 at the centrosome. B, WT HeLa cells and CEP131 knockout cell lines (KO4E and KO9) were stained for CEP152, and the amount of CEP152 at the centrosome was quantified. Insets, magnifications of the centrosome. Each dot represents a single cell. Bars, means ± S.D. (error bars). Scale bars, 10 μm. ***, p < 0.0001; ns, not significant.
Figure 6.
Figure 6.
Chronic CEP131 depletion causes dispersion of centriolar satellites and is rescued by CEP131 phosphorylation. A, CEP131 Western blotting in WT HeLa cells compared with two CEP131 knockout cell lines, KO4E and KO9. B, immunofluorescent images showing loss of CEP131 in the knockout cell lines. C, immunofluorescent imaging of centrioles and centriolar satellites in the knockout cell lines. D, quantification of centriolar satellites in WT HeLa cells and the two CEP131 knockout lines. E, quantification of centrioles (centrin foci) in WT and CEP131 knockout HeLa lines. F, representative images of primary cilia in WT and CEP131 knockout HeLa lines. G, quantification of primary cilia in WT HeLa cells and the two CEP131 knockout lines. Scale bars, 10 μm. H, cell counts over 12 days in WT HeLa cells compared with two CEP131 knockout cell lines. I and J, proliferation in cells treated with serum-free medium (I) or with 1% serum (J). Proliferation was normalized to untreated cells within each cell line. K, representative images of centriolar satellites (marked by PCM1) in CEP131 knockout cells transfected with either WT, S78A, or S78D CEP131 transgenes. L, quantification of the percentage of cells with dispersed and aggregated PCM1. M, quantification of the percentage of PCM1 intensity within a 2.5-μm radius of the center of the centrosome. Nocodazole is used as a positive control for centriolar satellite dispersion. All experiments in this figure utilize HeLa cells. Bars, means ± S.E. (error bars). Scale bars, 10 μm. *, p < 0.05; ns, not significant.
Figure 7.
Figure 7.
CEP72 staining recapitulates regulation of centriolar satellite integrity by CEP131 Ser-78 phosphorylation status. A, to ensure that our results regarding PLK4 phosphorylation of CEP131 regulating centriolar satellite integrity were not specific to PCM1, we also analyzed another marker of centriolar satellites, CEP72. WT or CEP131 KO HeLa cell lines were transfected with GFP-tagged CEP131 constructs (WT, S78A, and S78D) versus GFP-only control. Nocodazole treatment served as a positive control for satellite dispersion. Representative images are shown. B, CEP72 was assessed as either dispersed or aggregated, just as done for PCM1 staining of centriolar satellites in other figures. All experiments in this figure utilize HeLa cells. DAPI, 4′,6-diamidino-2-phenylindole. Bars, means ± S.D. (error bars) from three replicates. Scale bars, 10 μm. At least 300 cells were analyzed for each condition. *, p < 0.05.
Figure 8.
Figure 8.
Dynein is required for satellite aggregation with CEP131 S78D phosphomimetic. A, representative images of HeLa cells treated with nocodazole and the dynein inhibitor ciliobrevin D. B, quantification of centriolar satellites (PCM1 staining) in the conditions shown in A. C, representative images of WT HeLa cells transfected with CEP131 S78D and treated with ciliobrevin D. D, quantification of centriolar satellites (PCM1 staining) in the conditions shown in C. Bars, means ± S.D. (error bars) from three replicates. Scale bars, 10 μm. At least 300 cells were analyzed for each condition. *, p < 0.05.
Figure 9.
Figure 9.
PLK4 phosphorylation of CEP131 at Ser-78 is critical for proper centriolar satellite integrity. A, WT HeLa cells were transfected with GFP or GFP-tagged WT CEP131 or S78A or S78D mutant. Western blotting demonstrating transfection efficiency. B, images of centriolar satellites in these transfected cells after treatment with the PLK4 inhibitor centrinone B. Scale bar, 10 μm. C, qualitative assessment of centriolar satellites as either dispersed or aggregated. D, quantitative assessment of centriolar satellite dispersion/aggregation. All experiments in this figure utilize WT HeLa cells. Bars, means ± S.E. (error bars). Scale bars, 10 μm. *, p < 0.05; **, p < 0.01; ***, p < 0.0001; ns, not significant.
Figure 10.
Figure 10.
PLK4 phosphorylation of CEP131 cooperates with its phosphorylation of PCM1. A, Western blotting demonstrating transfection efficiency of the GFP-PCM1 and FLAG-CEP131 constructs. B, images of centriolar satellites in the transfected cell before and after PLK4 inhibition with centrinone B. Scale bar, 10 μm. C, quantification of dispersed and aggregated centriolar satellites. *, p < 0.05. Error bars, S.D. All experiments in this figure utilize HeLa cells. D, diagram summarizing the regulation of centriolar satellite integrity by PLK4 phosphorylation of CEP131 and PCM1. Red, cytoplasm; light blue, DNA; green, centrosome; yellow, centrioles; dark blue, centriolar satellites.

Similar articles

Cited by

References

    1. Sir J. H., Pütz M., Daly O., Morrison C. G., Dunning M., Kilmartin J. V., and Gergely F. (2013) Loss of centrioles causes chromosomal instability in vertebrate somatic cells. J. Cell Biol. 203, 747–756 10.1083/jcb.201309038 - DOI - PMC - PubMed
    1. Tanaka T., Serneo F. F., Higgins C., Gambello M. J., Wynshaw-Boris A., and Gleeson J. G. (2004) Lis1 and doublecortin function with dynein to mediate coupling of the nucleus to the centrosome in neuronal migration. J. Cell Biol. 165, 709–721 10.1083/jcb.200309025 - DOI - PMC - PubMed
    1. Tsai J. W., Bremner K. H., and Vallee R. B. (2007) Dual subcellular roles for LIS1 and dynein in radial neuronal migration in live brain tissue. Nat. Neurosci. 10, 970–979 10.1038/nn1934 - DOI - PubMed
    1. Mahjoub M. R. (2013) The importance of a single primary cilium. Organogenesis 9, 61–69 10.4161/org.25144 - DOI - PMC - PubMed
    1. Dammermann A., and Merdes A. (2002) Assembly of centrosomal proteins and microtubule organization depends on PCM-1. J. Cell Biol. 159, 255–266 10.1083/jcb.200204023 - DOI - PMC - PubMed

Publication types

MeSH terms