. 2019 May 3;294(18):7335-7347.
doi: 10.1074/jbc.RA119.007618. Epub 2019 Feb 25.

Cellular cholesterol abundance regulates potassium accumulation within endosomes and is an important determinant in bunyavirus entry

Affiliations

Cellular cholesterol abundance regulates potassium accumulation within endosomes and is an important determinant in bunyavirus entry

Frank W Charlton et al. J Biol Chem. .

Abstract

The Bunyavirales order of segmented negative-sense RNA viruses includes more than 500 isolates that infect insects, animals, and plants and are often associated with severe and fatal disease in humans. To multiply and cause disease, bunyaviruses must translocate their genomes from outside the cell into the cytosol, achieved by transit through the endocytic network. We have previously shown that the model bunyaviruses Bunyamwera virus (BUNV) and Hazara virus (HAZV) exploit the changing potassium concentration ([K+]) of maturing endosomes to release their genomes at the appropriate endosomal location. K+ was identified as a biochemical cue to activate the viral fusion machinery, promoting fusion between viral and cellular membranes, consequently permitting genome release. In this study, we further define the biochemical prerequisites for BUNV and HAZV entry and their K+ dependence. Using drug-mediated cholesterol extraction along with viral entry and K+ uptake assays, we report three major findings: BUNV and HAZV require cellular cholesterol during endosomal escape; cholesterol depletion from host cells impairs K+ accumulation in maturing endosomes, revealing new insights into endosomal K+ homeostasis; and "priming" BUNV and HAZV virions with K+ before infection alleviates their cholesterol requirement. Taken together, our findings suggest a model in which cholesterol abundance influences endosomal K+ levels and, consequently, the efficiency of bunyavirus infection. The ability to inhibit bunyaviruses with existing cholesterol-lowering drugs may offer new options for future antiviral interventions for pathogenic bunyaviruses.

Keywords: cholesterol; endosome; potassium channel; potassium transport; virology; virus entry.


Conflict of interest statement

The authors declare that they have no conflicts of interest with the contents of this article.

Figures
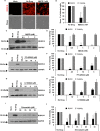
Figure 1.
Figure 1.
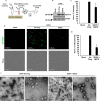
BUNV infection is inhibited by cellular cholesterol depletion. A, A549 cells were treated with MβCD for 45 min and infected with BUNV (m.o.i. 0.2). At 24 hpi, cells were fixed and stained for BUNV-N. Wide-field images were taken using an IncuCyte ZOOM® (representative images are shown). Scale bars = 200 μm. B, the percentage of BUNV-infected cells was quantified using IncuCyte Zoom® software and normalized to no-drug cells (black columns). *, p < 0.05; error bars are representative of ± S.D.; n = 3). Cell viability was assessed by MTS assays. Values were normalized to no-drug cells (gray columns). C, entry assays were performed as in A, cell lysates were resolved via SDS-PAGE, and BUNV-N expression was assessed by Western blot analysis. GAPDH was probed as a loading control. D, densitometry analysis of C. Band densities were normalized to no-drug BUNV–infected cells (black columns). MTS cell viability data are also shown (gray columns). *, p < 0.05. E, BUNV entry assays were performed in the presence of PF-429242. Cells were treated with 5–20 μm PF-429242 for 24 h and infected with BUNV (m.o.i. 0.2) for a further 24 h. Cells were lysed, and lysates were resolved via SDS-PAGE and screened for BUNV-N and GAPDH. F, densitometry analysis of E. *, p < 0.05. G, entry assays were performed as in E, with U-18666A at 2.5–10 μm. *, p < 0.05. H, densitometry analysis of BUNV-N expression following U-18666A treatment. *, p < 0.05. I, entry assays as in E, with 10–50 μm simvastatin. J, densitometry analysis of I as in D. *, p < 0.05.
Figure 2.
Figure 2.
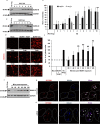
BUNV envelope cholesterol is also required for virus infection. A, schematic of BUNV envelope cholesterol extraction. GFP-BUNV virions were treated with MβCD for 90 min, and the drug/virus was diluted in DMEM and added to A549 cells for 24 h (m.o.i. 0.5). B, cells were lysed, and BUNV-N expression was assessed by Western blot analysis. C, blots were quantified by densitometry analysis and normalized to no-drug controls (*, p < 0.05; error bars ± S.D.; n = 3). D, virions were treated as in A, and GFP expression, as a marker of BUNV infection, was assessed by IncuCyte analysis. Representative wide-field images are shown. Scale bars = 200 μm. E, percentage of cells infected by MβCD-treated virions were measured using IncuCyte Zoom® software (*, p < 0.05; error bars ± S.D.; n = 3). F, purified BUNV virions were treated with 2 mm MβCD for 90 min at 37 °C. Treated and untreated (no-drug) virions were loaded onto carbon-coated grids and negatively stained with 1% uranyl acetate. Images were taken at 120 kV on a Tecnai T12 electron microscope. Scale bars = 0.5 μm.
Figure 3.
Figure 3.
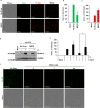
MβCD inhibits BUNV at an early post-penetration stage of infection. A, A549 cells were infected with BUNV (m.o.i. 0.1, t = 0). NH4Cl was added at the indicated time points and screened for BUNV-N expression at 24 hpi by Western blotting as in Fig. 1. B, cells were infected and treated with MβCD as in A. C, densitometry analysis of the NH4Cl and MβCD time courses in A and B (gray and black columns, respectively). Band densities were normalized to no-drug–infected cells (*, p < 0.05; NS, nonsignificant; error bars ± S.D.; n = 3). BUNV internalization takes up to 40 min. D, BUNV virions were added to A549 cells (m.o.i. 0.2, t = 0), which were treated with the cell-impermeable reducing agent TCEP for 5 min at the indicated post-infection time points (20–120 min). Cells were fixed at 24 hpi and stained for BUNV-N, and wide-field images were taken using the IncuCyte Zoom®. Scale bars = 200 μm. E, the percentage of infected cells was quantified using the IncuCyte Zoom® software. Values were normalized to no-drug infected cells (*, p < 0.05; error bars ± S.D.; n = 3). F, TCEP assays were performed as in D, and cell lysates were harvested and resolved via SDS-PAGE. Lysates were screened for BUNV-N by Western blot analysis. GAPDH was probed as a loading control. G, no-drug–treated A549 cells were infected with SYTO82/DiD-BUNV (m.o.i. ∼8) for 8 h at 37 °C. Cytopainter was added 30 min prior to live imaging as a cell marker. Scale bars = 10 μm. Fluorescent BUNV stained with SYTO82 (emissionmax 560 nm) and DiDvbt (emissionmax 665 nm) was imaged alongside Cytopainter (emissionmax 488 nm). H, cells were pretreated with MβCD for 45 min prior to infection with SYTO82/DiD-BUNV and imaged as in G. Representative confocal images are shown (scale bars = 10 μm).
Figure 4.
Figure 4.
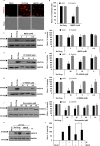
MβCD inhibits endosomal K+ accumulation, whereas K+-primed BUNV virions can overcome cellular cholesterol depletion. A, cells were pretreated with MβCD (or no-drug control) for 45 min, and the cell-impermeable K+ dye AG4 and TF-594 were added for 45 min at 37 °C to permit endosomal uptake. Noninternalized dyes were removed through PBS washes, and live cells were imaged using the IncuCyte Zoom®. Representative wide-field images are shown. Scale bars = 200 μm. B, AG4 fluorescence was quantified in MβCD-treated cells and normalized to no-drug cells (*, p < 0.05; NS, nonsignificant; error bars ± S.D.; n = 3). C, quantitative analysis of TF-594 internalization in no-drug– versus MβCD-treated cells, analyzed as in B. D, cells were pretreated with MβCD for 1 h, and BUNV virions were treated with buffers at pH 6.35, with or without 140 mm KCl, for 2 h at 37 °C. Buffers were diluted into 2 ml of fresh DMEM and immediately added to A549 cells. Cells were lysed at 18 hpi and immunoblotted for BUNV-N as in Fig. 1C. E, densitometry analysis of D as in Fig. 1D. F, cells were pretreated with 0.5, 1 or 2 mm MβCD for 45 min, and 2 μg/ml EGF-488 was added to cells for 30 min. Wide-field images were taken using IncuCyte Zoom® software. Scale bars = 200 μm.
Figure 5.
Figure 5.
HAZV infection is also inhibited by cellular cholesterol depletion. A, A549 cells were treated with MβCD for 45 min and infected with HAZV (m.o.i. 0.2). Cells were fixed at 24 hpi and stained for HAZV-N. Wide-field images were obtained using the IncuCyte Zoom®. Scale bars are 200 μm. B, the percentage of infected cells was quantified using IncuCyte Zoom® software and normalized to no-drug cells (black columns; *, p < 0.05; error bars ± S.D.; n = 3). Cell viability was assessed by MTS assay and normalized to no-drug cells (gray columns). C, entry assays were performed as in A. Cells were lysed, and HAZV-N expression was assessed by Western blot analysis. GAPDH was used as a control to confirm equal protein loading. D, densitometry analysis of C. Band densities were normalized to no-drug cells (black columns; n = 3) and compared with MTS cell viability data (gray columns). *, p < 0.05. E, HAZV entry assays in the presence of PF-429242. Cells were pretreated with 5–20 μm PF-429242 for 24 h and infected with HAZV (m.o.i. 0.2). Cells were lysed at 24 hpi and screened for HAZV-N and GAPDH as in C. F, densitometry analysis of E as in D. *, p < 0.05. G, entry assays performed as in E with U-18666A at 2.5–10 μm. H, densitometry analysis of G as in D. *, p < 0.05. I, HAZV entry assays were performed in the presence of simvastatin. Cells were pretreated with 10–50 μm simvastatin for 24 h and infected with HAZV (m.o.i. 0.2). Cells were lysed and screened for HAZV-N and GAPDH as in C. J, densitometry analysis of I as in D. *, p < 0.05. K, cells were pretreated with MβCD for 1 h. Simultaneously, HAZV virions were treated with buffers (pH 7.35), with or without 140 mm KCl, for 2 h at 37 °C. The buffers were diluted into 2 ml of DMEM and immediately added to A549 cells. Cells were lysed at 18 hpi and immunoblotted for HAZV-N as in Fig. 1C. L, densitometry analysis of K as in Fig. 1D (H). *, p < 0.05.
Figure 6.
Figure 6.
Cholesterol depletion may perturb K+ accumulation in endosomes, preventing virus escape. A putative model for the potential role of cholesterol in the accumulation of endosomal K+ ions. A, endosomal pH and the K+ gradient provides the biochemical cue for virus fusion and endosomal escape. This process is likely to be mediated by endosomal K+ channels. B, cholesterol depletion may inactivate or impair the function of the K+ channel(s) in endosomal membranes, slowing or preventing K+ influx into BUNV-containing endosomes. Therefore, BUNV is able to penetrate cells and to be internalized into endosomes, but the K+ cue is inhibited, impairing endosomal escape and subsequent virus infection.

References

    1. Wolf Y., Krupovic M., Zhang Y Z, Maes P., Dolja V., Koonin E V, Kuhn J. (2018) Megataxonomy of negative-sense RNA viruses. Int. Comm. Taxon. Viruses [online] https://talk.ictvonline.org/taxonomy/ (accessed January 17, 2019)
    1. Soldan S. S., and González-Scarano F. (2005) Emerging infectious diseases: the Bunyaviridae. J. Neurovirol. 11, 412–423 10.1080/13550280591002496 - DOI - PubMed
    1. Elliott R. M. (1997) Emerging viruses: the Bunyaviridae. Mol. Med. 3, 572–577 10.1007/BF03401814 - DOI - PMC - PubMed
    1. Simons J. F., Hellman U., and Pettersson R. F. (1990) Uukuniemi virus S RNA segment: ambisense coding strategy, packaging of complementary strands into virions, and homology to members of the genus Phlebovirus. J. Virol. 64, 247–255 - PMC - PubMed
    1. Fuller F., Bhown A. S., and Bishop D. H. (1983) Bunyavirus nucleoprotein, N, and a non-structural protein, NSS, are coded by overlapping reading frames in the S RNA. J. Gen. Virol. 64, 1705–1714 10.1099/0022-1317-64-8-1705 - DOI - PubMed

Publication types