. 2019 Mar 1;33(5-6):310-332.
doi: 10.1101/gad.314633.118. Epub 2019 Feb 25.

BRN2 suppresses apoptosis, reprograms DNA damage repair, and is associated with a high somatic mutation burden in melanoma

Affiliations

BRN2 suppresses apoptosis, reprograms DNA damage repair, and is associated with a high somatic mutation burden in melanoma

Katharine Herbert et al. Genes Dev. .

Abstract

Whether cell types exposed to a high level of environmental insults possess cell type-specific prosurvival mechanisms or enhanced DNA damage repair capacity is not well understood. BRN2 is a tissue-restricted POU domain transcription factor implicated in neural development and several cancers. In melanoma, BRN2 plays a key role in promoting invasion and regulating proliferation. Here we found, surprisingly, that rather than interacting with transcription cofactors, BRN2 is instead associated with DNA damage response proteins and directly binds PARP1 and Ku70/Ku80. Rapid PARP1-dependent BRN2 association with sites of DNA damage facilitates recruitment of Ku80 and reprograms DNA damage repair by promoting Ku-dependent nonhomologous end-joining (NHEJ) at the expense of homologous recombination. BRN2 also suppresses an apoptosis-associated gene expression program to protect against UVB-, chemotherapy- and vemurafenib-induced apoptosis. Remarkably, BRN2 expression also correlates with a high single-nucleotide variation prevalence in human melanomas. By promoting error-prone DNA damage repair via NHEJ and suppressing apoptosis of damaged cells, our results suggest that BRN2 contributes to the generation of melanomas with a high mutation burden. Our findings highlight a novel role for a key transcription factor in reprogramming DNA damage repair and suggest that BRN2 may impact the response to DNA-damaging agents in BRN2-expressing cancers.

Keywords: BCL2; BRN2; Ku80; POU3F2; apoptosis; melanoma; nonhomologous end-joining; somatic mutation burden.


Figures

Figure 1.
Figure 1.
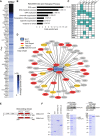
BRN2 binds proteins involved in the DNA damage response. (A) Heat map representing average spectral counts of proteins identified to copurify with BRN2 by AP-MS after SAINTexpress analysis. False discovery rate cutoff of ≤1%. (B) Gene ontology analysis of BRN2-binding partners. PANTHER GO-slim biological processes with greater than fourfold enrichment on overrepresentation analysis. Binomial test P-values in italics. (C) Table of DDR pathways in which BRN2 binding partners are involved. (HR) Homologous recombination; (NHEJ) nonhomologous end joining; (NER) nucleotide excision repair; (BER) base excision repair; (MMR) mismatch repair. (D) BRN2 binding partners arranged by Cytoscape edge-weighted spring-embedded layout, where the summed spectral count is inversely proportional to a prey distance from BRN2. GO annotation: DNA repair (red), Histones (yellow), and other (gray). (E) Diagram depicting BRN2 wild-type and N-terminal deletion mutant used in pull-down assays. Numbers indicate amino acid residues. The POU domain ([POUS] POU-specific domain; [POUH] POU homeodomain) is shown in red, and the glycine-rich (G) and glutamine-rich (Q) regions are indicated. (F) GST-pull down assays using purified bacterially expressed GST-BRN2 wild type together with purified recombinant HIS-tagged Ku70/Ku80 complex or PARP1. The purified proteins used are shown in the indicated Coomassie-stained gels. After pull-down using glutathione beads, samples were Western blotted for HIS-tagged Ku70 or PARP1 as indicated.
Figure 2.
Figure 2.
The N-terminal region of BRN2 inhibits DNA binding and can be phosphorylated by p38. (A) Diagram depicting BRN2 wild type and deletion mutants used DNA-binding assays. Numbers indicate amino acid residues. The POU domain is shown in red. (B) In vitro DNA-binding (EMSA) assay in duplicate using a radiolabeled MITF promoter probe and bacterially expressed and purified GST-BRN2 wild-type, ΔN mutant, or N-terminal region (amino acids 1–269). The Coomassie-stained gel (left) shows the purified proteins used, with the EMSA shown at the right. The unbound probe (bottom) and bound probe (top) are indicated. (C) Western blot using indicated antibodies of 501mel cells exposed to 150 J/m2 UVB (top) or 2.5 mM H2O2 (bottom) for the indicated times. (D) Western blot showing relative migration of BRN2 wild type transiently expressed in 501mel cells with or without cotransfected p38 and constitutively active MKK6(E) expression vectors. Samples were analyzed by SDS PAGE using a gel containing 50 µM Phos-tag reagent to efficiently separate phosphorylated forms. (E) Schematic showing wild-type BRN2 in which the POUS and POUH are indicated in red. The top numbers indicate amino acids at the N and C termini of BRN2, and the bottom numbers indicate the positions of S/TP motifs. (F) In vitro kinase assay using purified p38 and indicated wild-type and mutated GST-BRN2 fusion proteins. The in vitro kinase assay is shown in the top panel, and the Coomassie-stained purified BRN2 protein is shown in the bottom panel. The top and bottom parts of the kinase assay and Coomassie gel were run on the same gel but have been cropped to save space. An alignment of BRN2 showing amino acid conservation between species in the vicinity of S91 and S96 is shown below. (G) In vitro DNA-binding (EMSA) assay using a radiolabeled MITF promoter probe and bacterially expressed and purified GST-BRN2 wild-type or indicated mutants. The Coomassie-stained gel (bottom) shows the purified proteins used, with the EMSA shown above. The unbound probe (bottom) and bound probe (top) are indicated. Anti-GST antibody was used to confirm that the bound probe was recognized by GST-BRN2. (H) Model to explain the potential role of phosphorylation of the BRN2 N-terminal region. In the absence of phosphorylation on S91 and/or S96 BRN2 is in a closed conformation in which the N-terminal domain masks the POU domain, restricting DNA binding and interaction with cofactors. Phosphorylation of the N-terminal residues inhibits the intramolecular interaction to expose the POU domain, thereby enabling BRN2 to bind DNA and interact better with its cofactors.
Figure 3.
Figure 3.
BRN2 facilitates Ku recruitment to sites of DNA damage. (A) Immunofluorescence of 501mel cells 90 sec after LMI. Cells were stained with antibodies against γH2AX or Ku80 and BRN2. Cells were pretreated with DMSO (top panels) or 10 µM PARP inhibitor olaparib (bottom panels) for 3 h prior to irradiation. (B) Still images from live cell imaging of U-2 OS cells transiently transfected with GFP-BRN2 wild-type expression vector with or without PARP inhibitor treatment as above and subject to LMI as in A. (C) Quantification of live imaging shown in B. Data shown are the mean fluorescence intensity change of irradiated stripe versus background per cell expressed as mean ± SEM. DMSO, N = 11; PARPi, N = 15. (D) Still images from live cell imaging of U-2 OS cells transiently transfected with mCherry-BRN2 wild type or mCherry-BRN2 N406A expression vectors and subject to LMI. (E) Quantification of live imaging shown in D. Data shown are the mean fluorescence intensity change of irradiated stripe versus background per cell expressed as mean ± SEM. BRN2 wild type, N = 27; BRN2 N406A, N = 52. (F) Immunofluorescence images using anti-Flag or anti-γH2AX antibodies of U-2 OS cells expressing Flag-BRN2 wild-type or indicated mutants in cells after LMI or in nonirradiated (n.i.) cells. Quantification (below) of numbers of LMI treated cells with BRN2 colocalizing with the γH2AX stripe. (G,H) Results of live-cell imaging LMI of 501mel cells transfected with Ku80-GFP and depleted for BRN2 after LMI (G) or UVB microirradiation (H). Data shown are the mean fluorescence intensity change of irradiated stripe versus background per cell expressed as mean ± SEM. LMI: siControl, N = 8; siBRN2, N = 9. UV: siNT, N = 11; siBRN2 N = 7. (I,J) Results of live cell imaging of U-2 OS cells transfected with Ku80-GFP alone or together with indicated BRN2 expression vectors. The bottom panel in J is Western blot showing relative expression levels of indicated BRN2 and Ku80-GFP proteins. Data shown are the mean fluorescence intensity change of irradiated stripe versus background per cell expressed as mean ± SEM. (I) Flag N = 15; BRN2 wild type, N = 12; BRN2 N406A, N = 12. (J) Ku80-GFP alone, N = 196; +wild-type BRN2, N = 167; +S91E, S96E, N = 151; +S91A, S96A, N = 196. (K,L) Control U-2 OS cells or cells expressing BRN2 were treated with 2 Gy γ-irradiation to induce DSBs before being subject to immunofluorescence with anti-RAD51 (K) or anti-53BP1 (L) antibodies. Representative images from a 4-h time point are shown. Quantification is presented as foci per cell over time. (**) P < 0.01; (****) P < 0.0001. Analysis by unpaired Student's t-test.
Figure 4.
Figure 4.
BRN2 depletion causes persistence of γH2AX following UVB irradiation. (A) Immunofluorescence of 501mel cells treated with siControl or siBRN2#2 for 48 h prior to UVB irradiation time course as indicated, stained with antibodies against γH2AX and BRN2 with DAPI nuclear counterstain. (B) Box plot of quantification of immunofluorescence result shown in A using FIJI to analyze the intensity of γH2AX per nucleus. Seventy nine nuclei were analyzed per condition. Asterisks represent P-values of unpaired Student's t-test between siControl and siBRN2#2 at each time point. (***) P < 0.001. (C) Quantification of γH2AX intensity per nucleus in cells transfected with siBRN2#1. Seventy-nine nuclei were analyzed per condition. The experiment was performed and analyzed as in A. (***) P < 0.001. (D) Flow cytometry analysis of 501mel cells treated with siControl and two siBRN2 (#1 and #2) for 48 h prior to UVB irradiation. Cells were stained for γH2AX and DNA content 24 h after UVB treatment. The bottom red line delineates negative versus positive γH2AX staining, and the top red line indicates high positive staining in siControl. (E) Quantification of γH2AX-positive cells in D. Data represent fold change in percentage γH2AX positive cells compared with untreated siControl: mean ± SD of at least three biological replicates. Intersample comparison by unpaired Student's t-test. (*) P < 0.05; (**) P < 0.01.
Figure 5.
Figure 5.
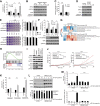
BRN2 protects from apoptosis following UVB- or chemotherapy-induced DNA damage. (A) Apoptosis assays using cleaved anti-caspase 3/7 antibody to identify the apoptotic population by flow cytometry 24 h after UVB treatment in 501mel cells transfected with indicated control or BRN2-specific siRNAs. Error bars indicate mean ± S.D. of three biological replicates. Analysis by paired Student's t-test. (*) P = <0.05; (**) P = <0.01. (B) Western blot of 501mel cells transfected with control or indicated siRNAs against BRN2 24 h after 150 J/m2 UVB irradiation as indicated. (C) Apoptosis assays using cleaved anti-caspase 3/7 antibody to identify the apoptotic population by flow cytometry 24 h after UVB treatment in control 501mel cells or cells stably expressing BRN2-Flag. Error bars indicate mean ± SD of three biological replicates. Analysis by paired Student's t-test. (***) P = <0.001. (D) Western blot corresponding to experiment presented in C using the indicated antibodies. (E) Clonogenic assay using indicated control 501mel cells (top) or 501mel cells stably expressing BRN2-Flag (bottom) transfected with control siRNA or siBRN2 as indicated. Cells were irradiated with 150 J/m2 UVB, immediately plated as indicated, and allowed to grow for 7 d. Numbers between panels indicate numbers of cells plated in each column. Colony formation was quantified and is shown as percentage relative to untreated control. Analysis by paired Student's t-test. (**) P = <0.005. (F) Cleaved caspase 3/7 flow cytometry assay in 501mel cells stably infected with lentivirus producing mCherry-P2A-Flag-BRN2 wild-type, mCherry-P2A-Flag-BRN2 N406A, or mCherry-P2A-Flag-Control vector as indicated. Western blot of cells probed with anti-Flag antibody, anti-ERK or anti-GAPDH is shown below. Data present mean ± SD of at least three biological replicates. Analysis by paired Student's t-test. (*) P = <0.05. (G) Heat map showing gene set variance analysis (GSVA) for gene sets related to apoptosis. Data from triplicate RNA sequencing (RNA-seq) of 501mel cells transfected with siControl or siBRN2 for 24 h prior to a time course following 150 J/m2 UVB irradiation as indicated. (H) Gene set enrichment analysis (GSEA) for HALLMARK_APOPTOSIS gene set plotted by enrichment of gene expression in siBRN2 transfected cells compared with siControl-treated cells after UVB irradiation. Cells were treated with siRNA 48 h prior to UVB irradiation. (I) Western blot showing expression of BRN2, BAX, and BAK in 501mel cells 48 h after transfection with siRNAs specific for each gene as indicated. (J) IncuCyte quantification of cell death determined by the ratio of SYTOX orange (dead cell count) to SYTO16 green (total cell count)-positive 501mel cells. Forty-eight hours after transfection with siRNAs specific for each gene as indicated, cells were UV-treated (150 J/m2), and cell death was determined over time. Mean and SD from three separate experiments are shown. Statistical analysis was performed using Wilcoxon matched-pairs signed rank test with two-tailed P-values. (***) P < 0.001; (****) P < 0.0001. (K) Flow cytometry assay showing cleaved caspase 3/7-positive cells in 501mel cells transfected with BRN2-specific siRNA for 24 h prior to treatment with 1 µM doxorubicin or 1.5 µM aphidicolin for 48 h. Analysis by paired Student's t-test. (**) P < 0.01. (L) Western blot of 501mel cells treated with the indicated concentration of vemurafenib for 48 h (top panel) and relative cell cycle distribution measured by flow cytometry (bottom panel). (M) Flow cytometry assay showing cleaved caspase 3/7-positive (top panel) and γH2AX-positive (bottom panel) 501mel cells treated with the indicated concentration of vemurafenib for 48 h. Error bars indicate mean ± SD of three biological replicates. Analysis by paired Student's t-test. (***) P = <0.001; (n.s.) nonsignificant.
Figure 6.
Figure 6.
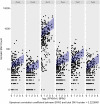
BRN2 expression in melanomas correlates positively with increased mutational burden. SNV counts are plotted against log2 (fragments per kilobase per million mapped fragment [FPKM] + 1) BRN2 values. For each SNV class, the blue dashed line (and ribbon) charts the predicted mean mutation burden (and 95% confidence interval) of a patient with the most common constellation of values for clinical variables (see the Materials and Methods) as the log2 (FPKM + 1) BRN2 level value increases from the minimum to the maximum observed in the TCGA data set, with all other clinical variables held fixed.
Figure 7.
Figure 7.
Schematic depicting the role of BRN2. (A) BRN2 has two roles: one in suppressing an apoptotic gene expression program, likely indirectly, and a second in promoting NHEJ via its ability to recruit Ku to sites of DNA damage. (B) Cells with low levels of BRN2 will be sensitive to apoptosis in response to DNA damage. If BRN2 expression is elevated in response to activation of MAPK, PI3K or β-catenin signaling, heightened resistance to apoptosis combined with the ability of BRN2 to promote error prone repair via NHEJ might explain the correlation between BRN2 expression and high mutation burden in melanoma.

References

    1. Alexandrov LB, Nik-Zainal S, Wedge DC, Aparicio SA, Behjati S, Biankin AV, Bignell GR, Bolli N, Borg A, Børresen-Dale AL, et al. 2013. Signatures of mutational processes in human cancer. Nature 500: 415–421. 10.1038/nature12477 - DOI - PMC - PubMed
    1. Ambasudhan R, Talantova M, Coleman R, Yuan X, Zhu S, Lipton SA, Ding S. 2011. Direct reprogramming of adult human fibroblasts to functional neurons under defined conditions. Cell Stem Cell 9: 113–118. 10.1016/j.stem.2011.07.002 - DOI - PMC - PubMed
    1. Andersen B, Rosenfeld MG. 2001. POU domain factors in the neuroendocrine system: lessons from developmental biology provide insights into human disease. Endocr Rev 22: 2–35. - PubMed
    1. Arozarena I, Sanchez-Laorden B, Packer L, Hidalgo-Carcedo C, Hayward R, Viros A, Sahai E, Marais R. 2011. Oncogenic BRAF induces melanoma cell invasion by downregulating the cGMP-specific phosphodiesterase PDE5A. Cancer Cell 19: 45–57. 10.1016/j.ccr.2010.10.029 - DOI - PubMed
    1. Berman HM, Westbrook J, Feng Z, Gilliland G, Bhat TN, Weissig H, Shindyalov IN, Bourne PE. 2000. The Protein Data Bank. Nucleic Acids Res 28: 235–242. 10.1093/nar/28.1.235 - DOI - PMC - PubMed

Publication types