. 2019 Mar 1;33(5-6):294-309.
doi: 10.1101/gad.322198.118. Epub 2019 Feb 25.

Tissue-specific BMAL1 cistromes reveal that rhythmic transcription is associated with rhythmic enhancer-enhancer interactions

Affiliations

Tissue-specific BMAL1 cistromes reveal that rhythmic transcription is associated with rhythmic enhancer-enhancer interactions

Joshua R Beytebiere et al. Genes Dev. .

Abstract

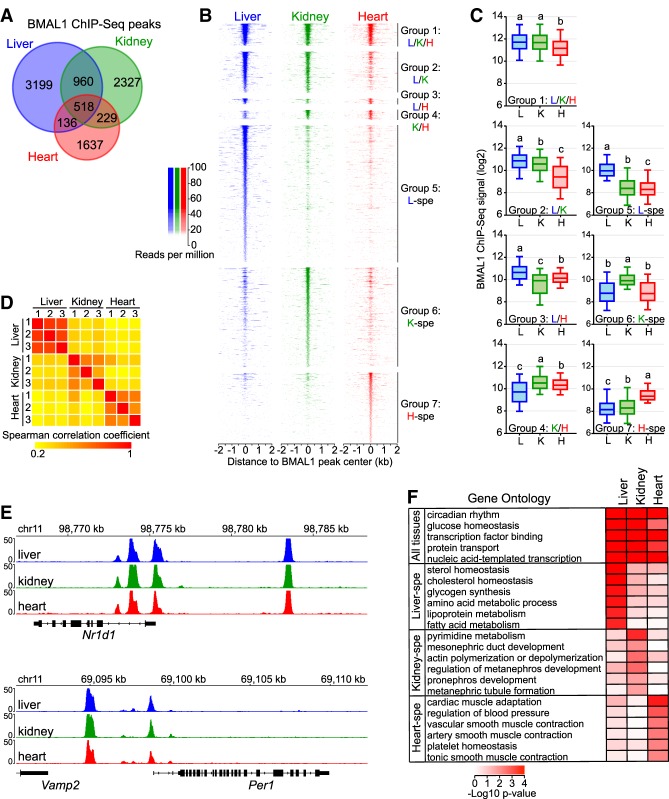
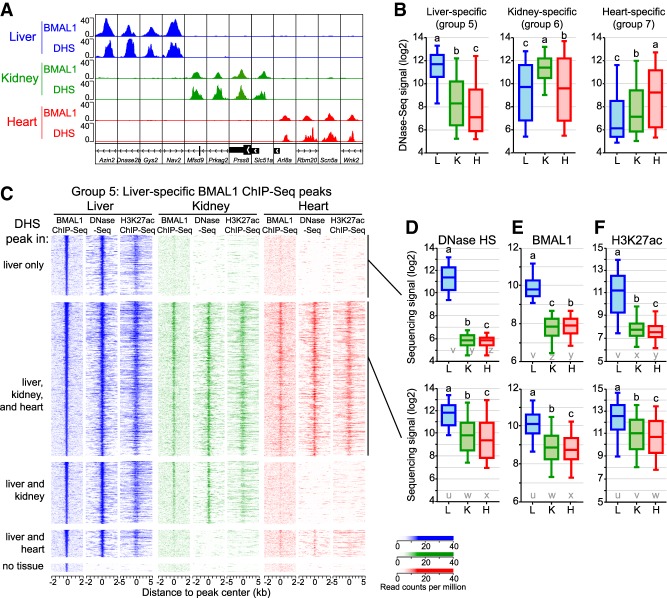
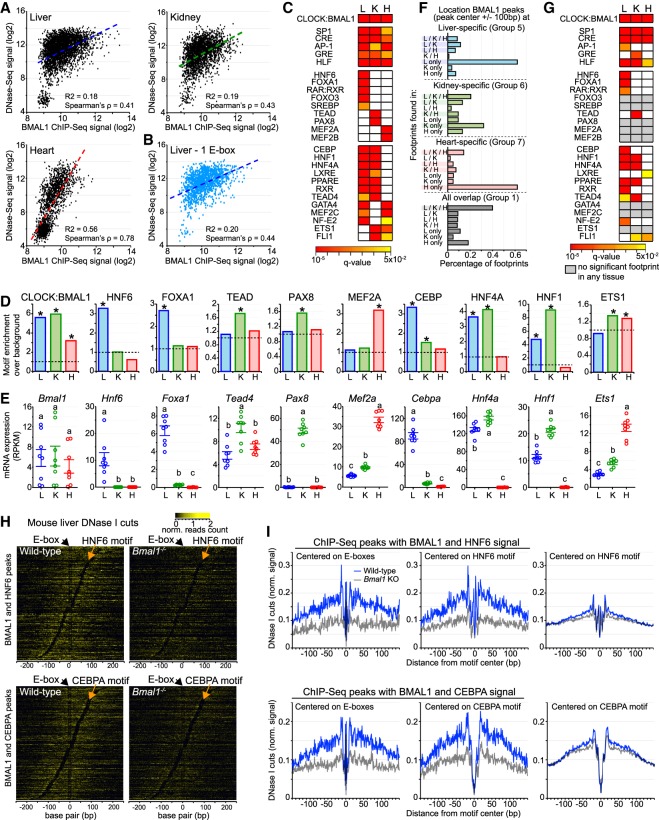
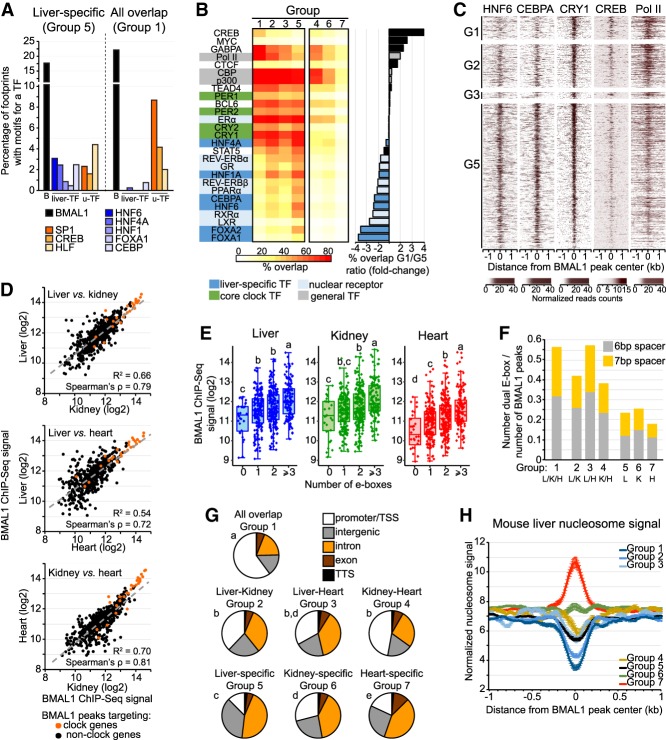
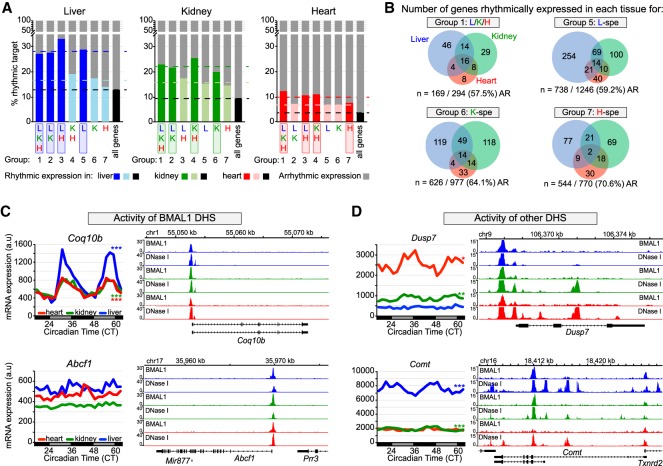
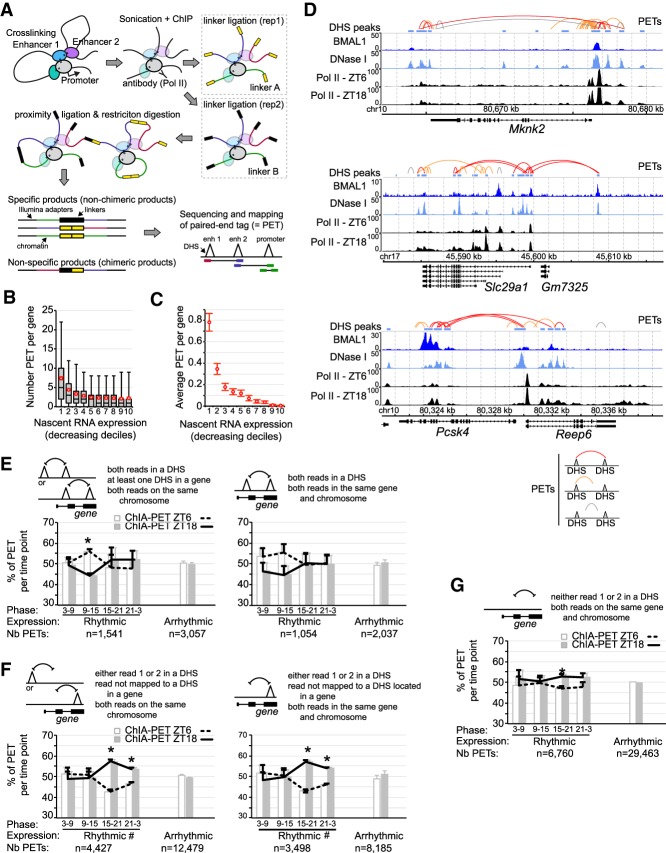
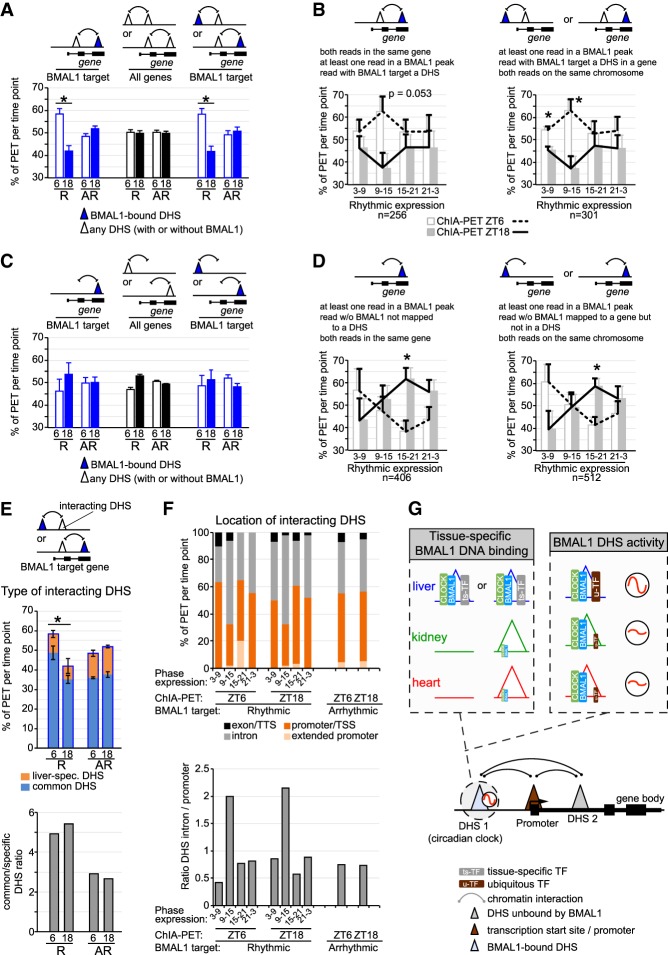
The mammalian circadian clock relies on the transcription factor CLOCK:BMAL1 to coordinate the rhythmic expression of thousands of genes. Consistent with the various biological functions under clock control, rhythmic gene expression is tissue-specific despite an identical clockwork mechanism in every cell. Here we show that BMAL1 DNA binding is largely tissue-specific, likely because of differences in chromatin accessibility between tissues and cobinding of tissue-specific transcription factors. Our results also indicate that BMAL1 ability to drive tissue-specific rhythmic transcription is associated with not only the activity of BMAL1-bound enhancers but also the activity of neighboring enhancers. Characterization of physical interactions between BMAL1 enhancers and other cis-regulatory regions by RNA polymerase II chromatin interaction analysis by paired-end tag (ChIA-PET) reveals that rhythmic BMAL1 target gene expression correlates with rhythmic chromatin interactions. These data thus support that much of BMAL1 target gene transcription depends on BMAL1 capacity to rhythmically regulate a network of enhancers.

Keywords: circadian clock; enhancer–enhancer interactions; tissue-specific cistromes; transcription.


Figures

Figure 1.
Figure 1.
BMAL1 cistromes are largely tissue specific. (A) Overlap of BMAL1 ChIP-seq peaks in the mouse liver, kidney, and heart. (B) BMAL1 ChIP-seq signal at BMAL1 peak center ±2 kb in the mouse liver, kidney, and heart, parsed based on tissues in which BMAL1 peaks were detected. (Group 1) Peaks common to all three tissues; (group 2) peaks common to the liver and kidney; (group 3) peaks common to the liver and heart; (group 4) peaks common to the kidney and heart; (group 5) liver-specific peaks; (group 6) kidney-specific peaks; (group 7) heart-specific peaks. (C) BMAL1 ChIP-seq signal calculated at peak center ±250 base pairs (bp) in the mouse liver, kidney, and heart. Groups with different letters are statistically different. P < 0.05, Kruskal-Wallis test. (D) Spearman correlation coefficients of BMAL1 ChIP-seq signal between each biological replicate (n = 3 per tissue), calculated at all 9006 BMAL1 ChIP-seq peaks. (E) Genome browser view of BMAL1 ChIP-seq signal at Nr1d1 and Per1 gene loci. (F) Gene ontology analysis performed using BMAL1 peaks detected in the liver, kidney, or heart, and reporting functions enriched across the three tissues or in only one tissue. P-value < 0.05.
Figure 2.
Figure 2.
The chromatin environment shapes tissue-specific BMAL1 binding. (A) Genome browser view of BMAL1 ChIP-seq and DNase-seq signals in the mouse liver, kidney, and heart at 12 BMAL1 tissue-specific peaks. (B) DNase-seq signal calculated at BMAL1 peak center ±250 bp in the mouse liver, kidney, and heart for tissue-specific BMAL1 peaks. Groups with different letters are statistically different. P < 0.05, Kruskal-Wallis test. (C) BMAL1 ChIP-seq, DNase-seq, and H3K27ac ChIP-seq signal at liver-specific BMAL1 peaks, parsed based on the presence of a DHS peak in the liver, kidney, and heart. BMAL1 ChIP-seq and DNase-seq signals are displayed with a window of ±2 kb, whereas H3K27ac ChIP-seq signal is displayed with a window of ±5 kb. (DF) Quantification of DNase-seq (D), BMAL1 ChIP-seq (E), and H3K27ac ChIP-seq (F) signals for liver-specific BMAL1 peaks located at (group 5A; top) liver-specific DHS or (group 5B; bottom) DHS peaks common to the liver, kidney, and heart. Groups with different letters are statistically different. P < 0.05, Kruskal-Wallis test. u–z denote the outcome of the statistical analysis performed using groups 5A and 5B together.
Figure 3.
Figure 3.
Motifs and footprints for ts-TFs are enriched at tissue-specific BMAL1 enhancers. (A) Correlation between DNase-seq and BMAL1 ChIP-seq signals (calculated at BMAL1 peak center ±250 bp) at liver-, kidney-, and heart-specific BMAL1 peaks. (B) Correlation between DNase-seq and BMAL1 ChIP-seq signal for liver-specific BMAL1 peaks harboring one E-box only. (C) Enrichment of TF motifs at liver-, kidney-, and heart-specific BMAL1 peaks, performed using HOMER at BMAL1 peak center ±100 bp. Enrichments are shown if q-value was <0.05. (D) Fold-enrichment of TF motif over background at tissue-specific BMAL1 peaks (BMAL1 peak center ±100 bp; q-value < 0.05). (E) mRNA expression in the mouse liver, kidney, and heart of Bmal1 and TFs whose motifs were enriched at BMAL1 ChIP-seq peaks. (RNA-seq data sets from Zhang et al. 2014). Groups with different letters are significantly different. P-value < 0.05, one-way ANOVA. (F) Distribution of DNase I footprints identified using pyDNase and detected at BMAL1 peak center ±100 bp, and parsed based on the tissues in which they were found. (G) Motif enrichment of TFs performed at DNase I footprints identified in liver-, kidney-, and heart-specific BMAL1 peaks (footprint center ±15 bp). Enrichments are displayed if q-value was <0.05, and colored in gray if no significant footprint is detected in any of the three tissues. (H) Heat map representing DNase I cuts at BMAL1 peaks containing an E-box and an HNF6 motif (top) or a CEBP (bottom). DNase I cut signal is centered on the E-box and sorted based on the distance between the E-box and the liver-specific TF motif. (I) Quantification of DNase I cut signal at BMAL1 peaks containing an E-box and an HNF6 motif (top) or a CEBP (bottom) in the liver of wild-type (left) or Bmal1−/− (right) mice. Quantification was performed using signal centered on E-boxes (left) or on the ts-TF motif (middle). As control, quantification was also performed at HNF6 or CEBPA peaks that do not harbor a BMAL1 ChIP-seq peak (right; signal corresponds to the average of 1000 decile-normalized iterations).
Figure 4.
Figure 4.
BMAL1 DNA-binding sites common to the mouse liver, kidney, and heart exhibit unique features. (A) Percentage of footprints for BMAL1 (black), liver-specific TFs (blue), and u-TFs (orange) identified at liver-specific BMAL1 peaks (group 5) or at BMAL1 peaks common to all three tissues (group 1). (B) Percentage overlap between BMAL1 peaks and ChIP-seq peaks for various TFs and Pol II in the mouse liver. Results are parsed based on tissues in which BMAL1 peaks were detected. (G1) Peaks common to all three tissues; (G2) peaks common to the liver and kidney; (G3) peaks common to the liver and heart; (G4) peaks common to the kidney and heart; (G5) liver-specific peaks; (G6) kidney-specific peaks; (G7) heart-specific peaks. (C) Heat map representation of mouse liver ChIP-seq signal for HNF6 (data set from Faure et al. 2012), CEBPA (data set from Faure et al. 2012) CRY1 (CT04) (data set from Koike et al. 2012), CREB (from Everett et al. 2013), and Pol II (ZT06) (data set from Sobel et al. 2017) at BMAL1 peaks ordered based on BMAL1 ChIP-seq signal (as in Fig. 1B) for groups 1–3, and 5. (D) Correlation of BMAL1 ChIP-seq signal between the mouse liver, kidney, and heart for BMAL1 peaks common to all three tissues (group 1). (E) BMAL1 ChIP-seq signal for BMAL1 peaks common to all tissues parsed based on the number of E-boxes (canonical E-box CACGTG and degenerated E-boxes CACGTT and CACGNG). (F) Fraction of BMAL1 peaks harboring a dual E-box motif (two E-boxes separated with 6 or 7 bp). (G) Location of BMAL1 peaks for each of the seven groups. Statistical analysis was performed using a χ2 test, and post-hoc analysis was performed with Fisher's exact test. Groups with different letters are statistically different. P < 0.01. (H) Nucleosome signal at BMAL1 DNA-binding sites parsed based on tissues in which BMAL1 peaks were detected (groups 1–7; see above). Nucleosome signal was retrieved from mouse liver MNase-seq (micrococcal nuclease [MNase] digestion of chromatin followed by deep sequencing) data sets (Menet et al. 2014), which consists of six time points, each separated by 4 h with n = 4 mice for each time point, and is displayed as the average of the 24 data sets ± S.E.M.
Figure 5.
Figure 5.
Transcriptional activities of BMAL1 DHS and other DHS contribute to BMAL1-mediated rhythmic transcription. (A) Percentage of rhythmically expressed gene for the seven groups of BMAL1-binding sites. Gene expression data originate from public microarray data sets (Zhang et al. 2014) and is considered rhythmic if q-value was <0.05 using JTK-cycle. (B) Overlap of rhythmic expression for peaks common to all three tissues (group 1), and for liver-, kidney-, and heart-specific BMAL1 peaks (groups 5, 6, and 7, respectively). The number of genes that are rhythmically expressed for the mouse liver (blue), kidney (green), and heart (red) is displayed, along with the number and percentage of nonrhythmically expressed genes (AR). (C,D) mRNA expression (left) and genome browser view (right) of BMAL1 ChIP-seq and DNase-seq signals in the mouse liver (blue), kidney (green), and heart (red). Rhythmic expression determined by JTK cycle is defined as three asterisks if q-value was <0.001, two asterisks if q-value was <0.01, and one asterisk if q-value was <0.05. The genes Coq10b and Abcf1 (C) represent two examples for which the activity of BMAL1 DHS likely contributes to the differences in mRNA expression, where the genes Dusp7 and Comt (D) represent two examples for which the activity of other DHS likely contributes to BMAL1-mediated rhythmic transcription.
Figure 6.
Figure 6.
Analysis of chromatin interactions by RNA Pol II ChIA-PET in the mouse liver. (A) Illustration of the ChIA-PET technique. (B) Number of PETs with both reads mapped to the same gene and parsed based on gene nascent RNA expression in the mouse liver. Red circles represent the average PET number for each decile ±95% confidence intervals. (C) Average number of PETs per gene in the mouse liver with both reads located in different DHS and mapped to the same gene, parsed based on gene nascent RNA expression. Error bars represent the 95% confidence intervals. (D) Genome browser view of mouse liver BMAL1 ChIP-seq (this study), DNase-seq (ENCODE), and Pol II ChIP-seq (Sobel et al. 2017). PETs with both reads mapped to DHS are in red, while PETs with one read mapped to a DHS are in orange and those not mapped to a DHS are in gray. (EG) Percentage of PETs detected at ZT6 (white bar and dashed black line) or ZT18 (gray bar and solid black line), displayed as the average ± S.E.M. of three independent experiments based on the type of PETs, the rhythmicity of gene expression, and the phase of expression. (*) P < 0.05 between ZT6 and ZT18; (#) an interaction found in the two-way ANOVA (P < 0.05) between the phase of expression and the time of the ChIA-PET experiment (ZT6 or ZT18). Triangles represent DHSs and may be located within a gene or not.
Figure 7.
Figure 7.
Rhythmic chromatin interactions are more prevalent for rhythmically expressed genes. (AD) Percentage of PETs detected at ZT6 (empty/white bar and dashed black line) or ZT18 (solid bar and solid black line) are displayed as the average ± S.E.M. of three independent experiments based on the type of PET, the rhythmicity of gene expression, the presence of a BMAL1-bound DHS, and the phase of gene expression. R = rhythmic expression; AR = arrhythmic expression. Triangles represent DHSs, and may be located within a gene or not. (*) P < 0.05 between ZT6 and ZT18. (E) Type of DHS (liver-specific DHS or DHS common to the liver, kidney, and heart) interacting with a BMAL1 DHS is displayed based on the transcriptional output of BMAL1 target genes (rhythmic or nonrhythmic) and the time at which the ChIA-PET experiment was performed (ZT6 or ZT18). Results are shown as percentage of PETs per ChIA-PET time point (as in A; top) or as the ratio of common DHS over liver-specific DHS (bottom). (F) Genomic location of DHSs interacting with BMAL1-bound DHS is displayed based on the transcriptional output of BMAL1 target genes (phase of expression, and rhythmic or nonrhythmic) and the time at which the ChIA-PET experiment was performed (ZT6 or ZT18). The locations of DHSs consist of exon and transcription termination site (TTS; in black), introns (in gray), promoter and TSS (−1 kb to +100 bp from TSS; in dark orange), and extended promoter (−10 kb to −1 kb from TSS; in light orange). (G) Hypothetical model illustrating how CLOCK:BMAL1 generates tissue-specific rhythmic transcriptional programs. This model incorporates mechanisms on how BMAL1 binds to DNA in a tissue-specific manner (chromatin accessibility and cobinding with ts-TFs) and how u-TFs might contribute to BMAL1 DHS rhythmic transcriptional activity. It also illustrates how functional interaction between BMAL1 DHSs and other DHSs (including tissue-specific DHS) may contribute to rhythmic transcription.

Comment in

References

    1. Aguilar-Arnal L, Hakim O, Patel VR, Baldi P, Hager GL, Sassone-Corsi P. 2013. Cycles in spatial and temporal chromosomal organization driven by the circadian clock. Nat Struct Mol Biol 20: 1206–1213. 10.1038/nsmb.2667 - DOI - PMC - PubMed
    1. Bunger MK, Wilsbacher LD, Moran SM, Clendenin C, Radcliffe LA, Hogenesch JB, Simon MC, Takahashi JS, Bradfield CA. 2000. Mop3 is an essential component of the master circadian pacemaker in mammals. Cell 103: 1009–1017. 10.1016/S0092-8674(00)00205-1 - DOI - PMC - PubMed
    1. Cusanovich DA, Hill AJ, Aghamirzaie D, Daza RM, Pliner HA, Berletch JB, Filippova GN, Huang X, Christiansen L, DeWitt WS, et al. 2018. A single-cell atlas of in vivo mammalian chromatin accessibility. Cell 174: 1309–1324.e18. 10.1016/j.cell.2018.06.052 - DOI - PMC - PubMed
    1. Doi R, Oishi K, Ishida N. 2010. CLOCK regulates circadian rhythms of hepatic glycogen synthesis through transcriptional activation of Gys2. J. Biol Chem 285: 22114–22121. 10.1074/jbc.M110.110361 - DOI - PMC - PubMed
    1. Eckel-Mahan KL, Patel VR, de Mateo S, Orozco-Solis R, Ceglia NJ, Sahar S, Dilag-Penilla SA, Dyar KA, Baldi P, Sassone-Corsi P. 2013. Reprogramming of the circadian clock by nutritional challenge. Cell 155: 1464–1478. 10.1016/j.cell.2013.11.034 - DOI - PMC - PubMed

Publication types

LinkOut - more resources