

Longitudinal quantitative electroencephalographic study in mono-hemispheric stroke patients
- PMID: 30804255
- PMCID: PMC6425833
- DOI: 10.4103/1673-5374.251331
Longitudinal quantitative electroencephalographic study in mono-hemispheric stroke patients
Abstract
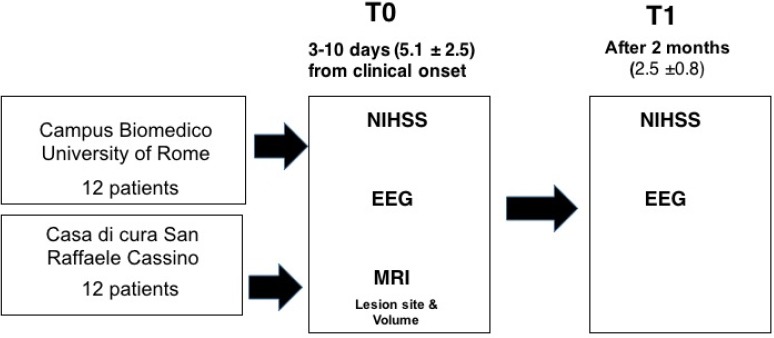
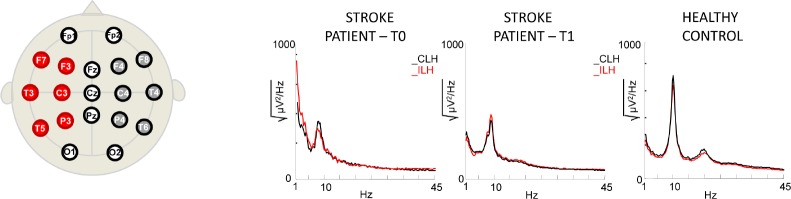
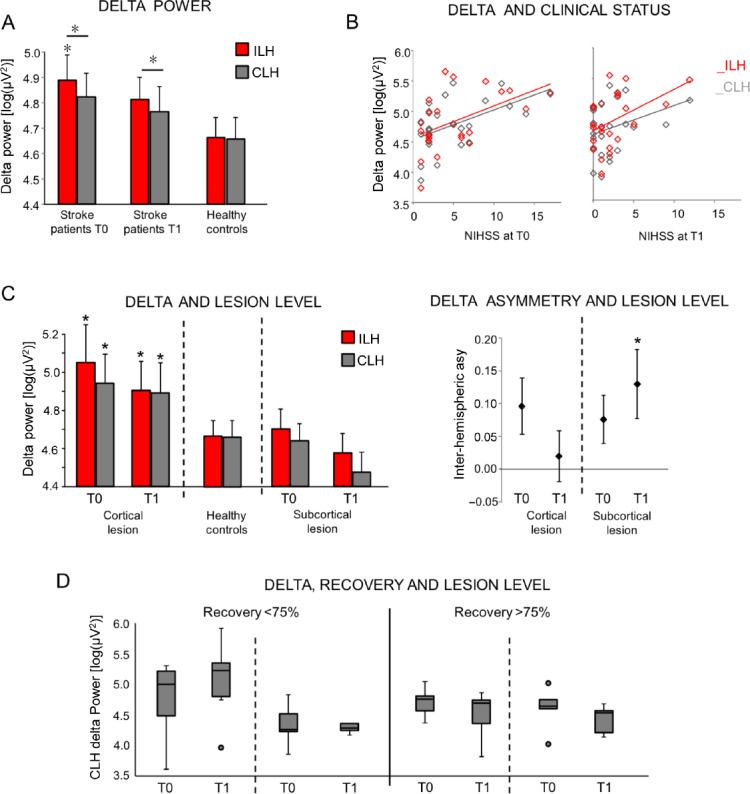
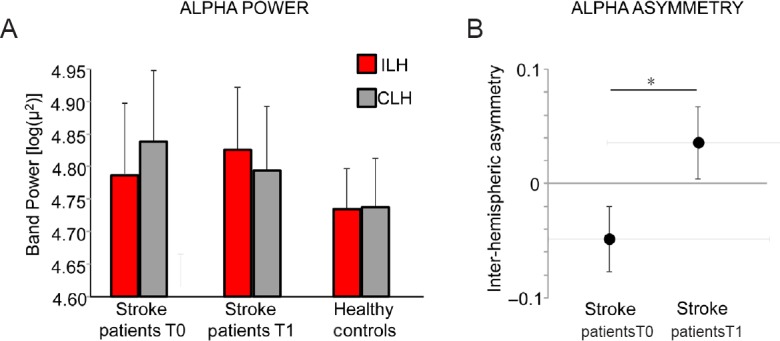
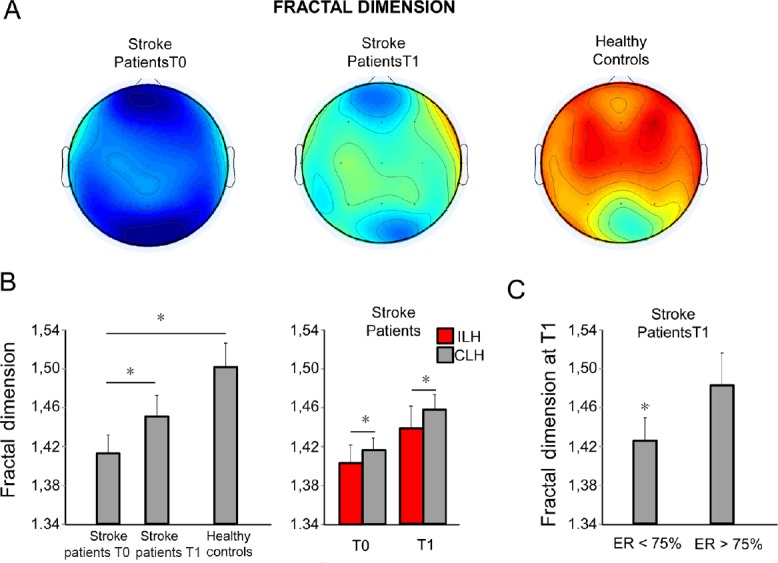
The identification of individual factors modulating clinical recovery after a stroke is fundamental to personalize the therapeutic intervention to enhance the final clinical outcome. In this framework, electrophysiological factors are promising since are more directly related to neuroplasticity, which supports recovery in stroke patients, than neurovascular factors. In this retrospective observational study, we investigated brain neuronal activity assessed via spectral features and Higuchi's fractal dimension (HFD) of electroencephalographic signals in acute phase (2-10 days from symptom onset, T0) and sub-acute phase (2.5 months, T1) in 24 patients affected by unilateral middle cerebral artery stroke. Longitudinal assessment of the clinical deficits was performed using the National Institutes of Health Stroke Scale (NIHSS), together with the effective recovery calculated as the ratio between difference of NIHSS at T0 and T1 over the NIHSS value at T0. We observed that delta and alpha band electroencephalographic signal power changed between the two phases in both the hemispheres ipsilateral (ILH) and contralateral (CHL) to the lesion. Moreover, at T0, bilateral higher delta band power correlated with worse clinical conditions (Spearman's rs = 0.460, P = 0.027 for ILH and rs = 0.508, P = 0.013 for CLH), whereas at T1 this occurred only for delta power in ILH (rs = 0.411, P = 0.046) and not for CHL. Inter-hemispheric difference (ILH vs. CLH) of alpha power in patients was lower at T0 than at T1 (P = 0.020). HFD at T0 was lower than at T1 (P = 0.005), and at both phases, ILH HFD was lower than CLH HFD (P = 0.020). These data suggest that inter-hemispheric low band asymmetry and fractal dimension changes from the acute to the sub-acute phase are sensitive to neuroplasticity processes which subtend clinical recovery. The study protocol was approved by the Bioethical Committee of Ospedale San Giovanni Calibita Fatebenefretelli (No. 40/2011) on July 14, 2011.
Keywords: EEG; delta band; fractal dimension; inter-hemispheric asymmetries; mono-hemispheric stroke; plasticity.
Conflict of interest statement
None
Figures
Similar articles
-
EEG spectral exponent as a synthetic index for the longitudinal assessment of stroke recovery.Clin Neurophysiol. 2022 May;137:92-101. doi: 10.1016/j.clinph.2022.02.022. Epub 2022 Mar 8. Clin Neurophysiol. 2022. PMID: 35303540 Free PMC article.
-
Acute Phase Neuronal Activity for the Prognosis of Stroke Recovery.Neural Plast. 2019 Sep 8;2019:1971875. doi: 10.1155/2019/1971875. eCollection 2019. Neural Plast. 2019. PMID: 31611914 Free PMC article.
-
Fractal dimension of EEG activity senses neuronal impairment in acute stroke.PLoS One. 2014 Jun 26;9(6):e100199. doi: 10.1371/journal.pone.0100199. eCollection 2014. PLoS One. 2014. PMID: 24967904 Free PMC article.
-
Prognostic Value of EEG Microstates in Acute Stroke.Brain Topogr. 2017 Sep;30(5):698-710. doi: 10.1007/s10548-017-0572-0. Epub 2017 May 25. Brain Topogr. 2017. PMID: 28547185
-
Application of Higuchi's fractal dimension from basic to clinical neurophysiology: A review.Comput Methods Programs Biomed. 2016 Sep;133:55-70. doi: 10.1016/j.cmpb.2016.05.014. Epub 2016 May 30. Comput Methods Programs Biomed. 2016. PMID: 27393800 Review.
Cited by
-
Clinical Sensitivity of Fractal Neurodynamics.Adv Neurobiol. 2024;36:285-312. doi: 10.1007/978-3-031-47606-8_15. Adv Neurobiol. 2024. PMID: 38468039
-
Repetitive transcranial magnetic stimulation for lower extremity motor function in patients with stroke: a systematic review and network meta-analysis.Neural Regen Res. 2021 Jun;16(6):1168-1176. doi: 10.4103/1673-5374.300341. Neural Regen Res. 2021. PMID: 33269766 Free PMC article. Review.
-
Region-specific complexity of the intracranial EEG in the sleeping human brain.Sci Rep. 2022 Jan 10;12(1):451. doi: 10.1038/s41598-021-04213-8. Sci Rep. 2022. PMID: 35013431 Free PMC article.
-
EEG spectral exponent as a synthetic index for the longitudinal assessment of stroke recovery.Clin Neurophysiol. 2022 May;137:92-101. doi: 10.1016/j.clinph.2022.02.022. Epub 2022 Mar 8. Clin Neurophysiol. 2022. PMID: 35303540 Free PMC article.
-
EEG Fractal Analysis Reflects Brain Impairment after Stroke.Entropy (Basel). 2021 May 11;23(5):592. doi: 10.3390/e23050592. Entropy (Basel). 2021. PMID: 34064732 Free PMC article.
References
-
- Ahmed I. Predictive value of the electroencephalogram in acute hemispheric lesions. Clin Electroencephalogr. 1988;19:205–209. - PubMed
-
- Assenza G, Zappasodi F, Squitti R, Altamura C, Ventriglia M, Ercolani M, Quattrocchi CC, Lupoi D, Passarelli F, Vernieri F, Rossini PM, Tecchio F. Neuronal functionality assessed by magnetoencephalography is related to oxidative stress system in acute ischemic stroke. NeuroImage. 2009;44:1267–1273. - PubMed
-
- Assenza G, Zappasodi F, Pasqualetti P, Vernieri F, Tecchio F. A contralesional EEG power increase mediated by interhemispheric disconnection provides negative prognosis in acute stroke. Restor Neurol Neurosci. 2013;31:177–188. - PubMed
LinkOut - more resources
Full Text Sources
Molecular Biology Databases
