. 2019 Feb 25;10(1):930.
doi: 10.1038/s41467-019-08892-w.

Assembly and functionality of the ribosome with tethered subunits

Affiliations

Assembly and functionality of the ribosome with tethered subunits

Nikolay A Aleksashin et al. Nat Commun. .

Abstract

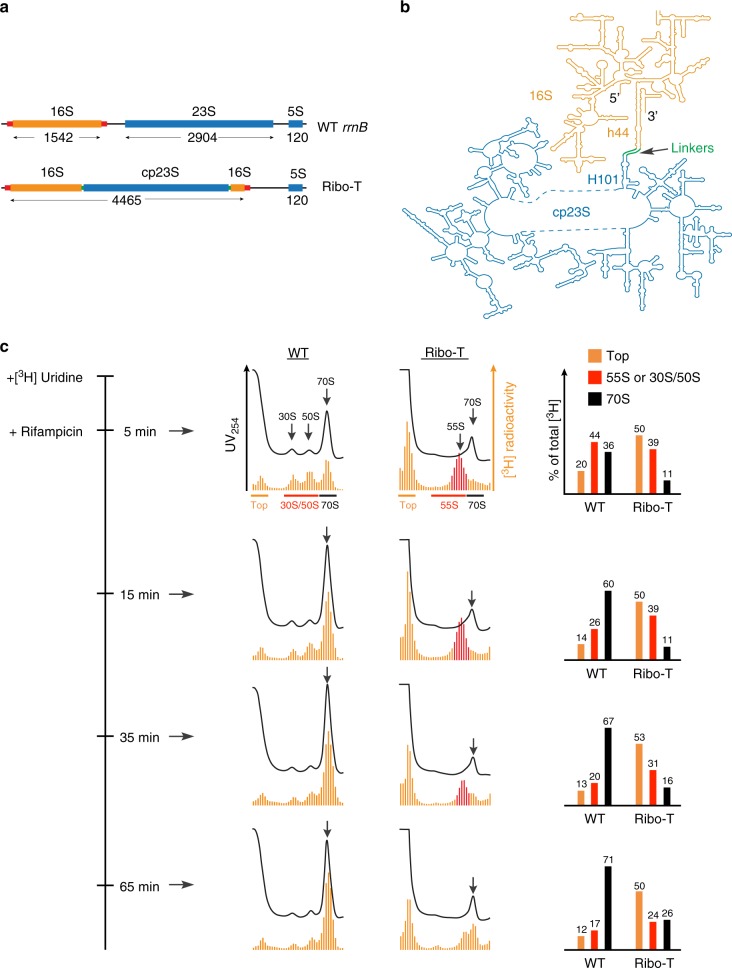
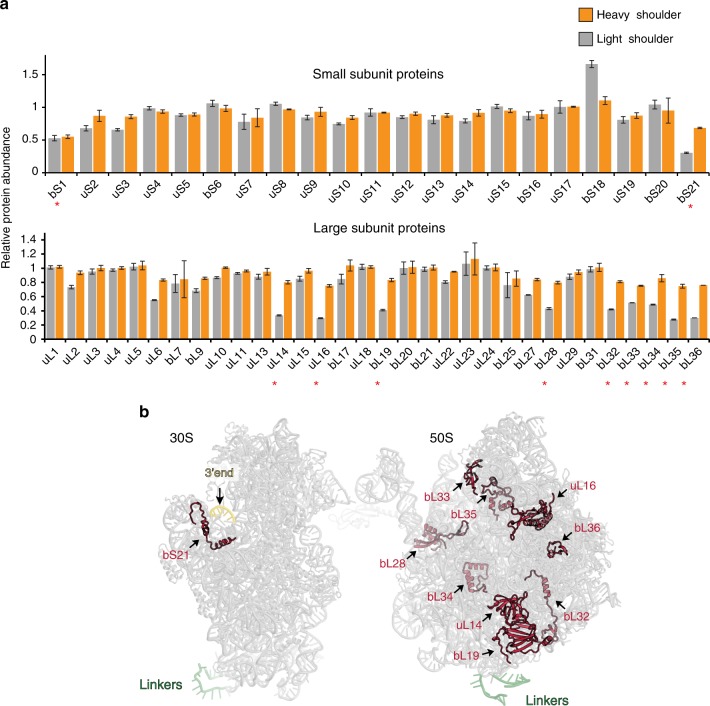
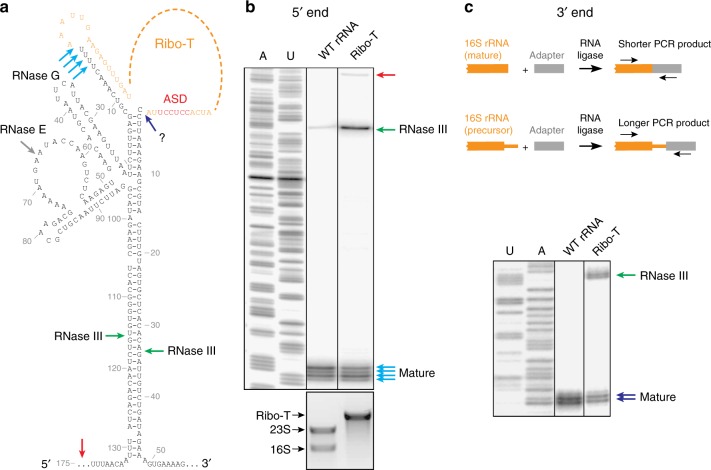
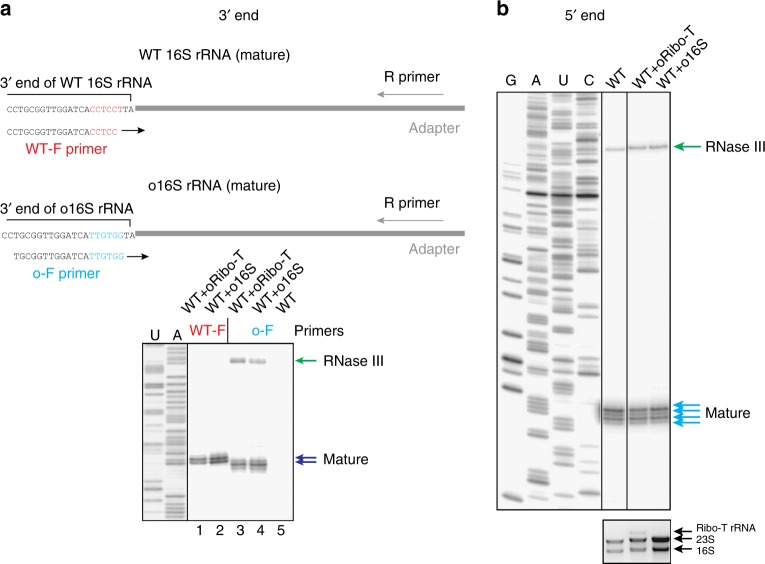
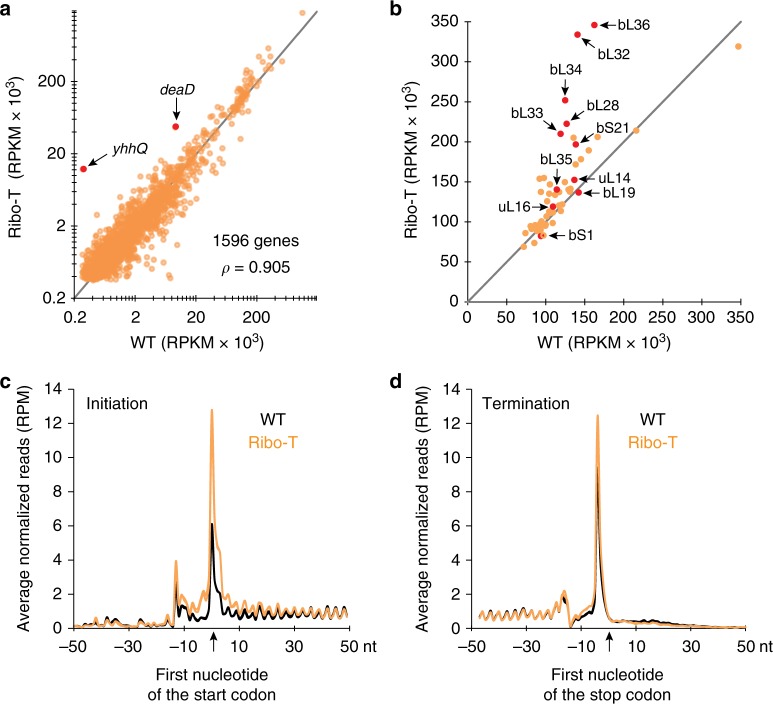
Ribo-T is an engineered ribosome whose small and large subunits are tethered together by linking 16S rRNA and 23S rRNA in a single molecule. Although Ribo-T can support cell proliferation in the absence of wild type ribosomes, Ribo-T cells grow slower than those with wild type ribosomes. Here, we show that cell growth defect is likely explained primarily by slow Ribo-T assembly rather than its imperfect functionality. Ribo-T maturation is stalled at a late assembly stage. Several post-transcriptional rRNA modifications and some ribosomal proteins are underrepresented in the accumulated assembly intermediates and rRNA ends are incompletely trimmed. Ribosome profiling of Ribo-T cells shows no defects in translation elongation but reveals somewhat higher occupancy by Ribo-T of the start codons and to a lesser extent stop codons, suggesting that subunit tethering mildly affects the initiation and termination stages of translation. Understanding limitations of Ribo-T system offers ways for its future development.


Conflict of interest statement

The authors declare no competing interests.

Figures

Fig. 1
Fig. 1
The Ribo-T biogenesis is stalled at a specific stage of assembly. a The structures of the E. coli wt rRNA operon and Ribo-T (tRNA genes in the 16S/23S rRNA spacer are not shown). The 16S rRNA flanking segments that form the processing hairpin are indicated with red bars. Length of each rRNA in nt is indicated. b The schematics of the Ribo-T rRNA shown in the secondary structure diagram depicting the insertion of circularly-permuted 23S rRNA (cp23S) into loop of helix 44 (h44) of the 16S rRNA. The linkers connecting h44 in the 16S rRNA to H101 in the 23S rRNA are indicated. The mature 5′ and 3′ and of the Ribo-T rRNA are marked. c Sucrose gradient analysis of Ribo-T and wt ribosomes prepared from cells pulse-labeled with [3H] uridine and then treated with rifampicin. The time course of the experiment is indicated on the left. Black traces: the UV254 absorbance (the UV peaks representing mature 70S ribosomes are marked by arrows). Orange bars—radioactivity (the 55S Ribo-T assembly intermediates are indicated as red bars). Bar graphs on the right indicate the relative amounts of radioactivity (% of the total radioactivity) on the top of the gradients (orange), in Ribo-T 55S assembly intermediates or 30S/50S subunits (red) or in 70S ribosomes (black). The fractions used for calculation of the corresponding radioactivity values are indicated at the “5 min” gradients. Source data for panel c can be found in the Source Data file
Fig. 2
Fig. 2
Specific posttranscriptional modifications are underrepresented in Ribo-T assembly intermediates. a Sedimentation profiles (A254) of wt ribosomes and Ribo-T. The light shoulder (gray) and heavy shoulder (orange) material of the Ribo-T peak were collected and analyzed separately. b The presence of PTMs in Ribo-T rRNA relative to the wt rRNA. The small subunit PTMs are marked in red, the large subunit PTMs are shown in blue. PTMs present in the LS material at a ≤0.6 level in comparison with the mature wt ribosomes are indicated with the asterisks. Error bars represent deviation from the mean (n = 4). c The location of the under-modified residues in the small (left) and large (right) subunits of Ribo-T. P-site tRNA (P-tRNA) is blue, A-site tRNA (A-tRNA) is green, and mRNA is colored magenta. Source data for panel b are provided in the Source Data file
Fig. 3
Fig. 3
Specific ribosomal proteins are lacking in the Ribo-T precursor. a The results of the quantitative proteomics analysis of the presence of individual r-proteins in mature Ribo-T (the heavy shoulder material) and assembly intermediates (the light shoulder material) from the Ribo-T peak. Red asterisks indicate those r-proteins that are reproducibly underrepresented in the Ribo-T assembly intermediates (less than 60% of the wt 70S ribosome control). Source data are provided in the Source Data file. Error bars represent deviation from the mean (n = 2). b Location of the underrepresented proteins (red) in the small and large ribosomal subunits
Fig. 4
Fig. 4
Processing of the Ribo-T rRNA ends is delayed. a Putative secondary structure of the 16S rRNA (and Ribo-T rRNA) flanking regions. The rRNA processing cleavage sites and the corresponding known nucleases are indicated. The nuclease responsible for the final steps of the 3′ end processing is unknown (a question mark). The wt ASD is indicated in red. b Analysis of the 5′ end processing by primer extension. The primer extension product representing rRNA template generated by RNase III cleavage is indicated with the green arrow. Red arrow indicates the cDNA product generated on the template that remains uncleaved by RNase III. The U- and A-specific sequencing reaction were generated using pAM552 plasmid carrying rrnB operon as a template. The agarose gel at the bottom shows the long rRNA species present in the cells from which the corresponding rRNA was prepared for the analysis. c Top: the scheme of the 3′ RACE experiment. Bottom panel: analysis of the 3′ RACE PCR products in the sequencing gel. The DNA bands representing mature rRNA and the rRNA species generated by the RNase III cleavage are indicated by the blue and green arrows, respectively. The U- and A-specific sequencing reactions, used as a ruler, were generated using pAM552 plasmid as a template. Source data are provided in the Source Data file
Fig. 5
Fig. 5
The ends of orthogonal Ribo-T and 16S rRNA are properly trimmed. a Top: the scheme of the ASD-specific 3′ RACE experiment. Forward PCR primers specific for wt ASD (wt-F) or oASD (o-F) were used at the PCR step of the 3′ RACE procedure to distinguish the processing of the corresponding rRNA species. The wt SD sequence is shown in red and orthogonal SD sequence is shown in blue. Bottom: Analysis of the 3′ RACE PCR products in the sequencing gel. Note that all the cells used for the preparation of rRNA contained wt ribosomes in addition to oRibo-T or o16S rRNA. PCR products generated using the wt-F/R primer combination reveal the processing of wt 16S rRNA; PCR products generated using the o-F/R primer combination reveal the processing of oRibo-T or o16S rRNA. Lanes 1 and 2: analysis of wt 16S rRNA processing; lanes 3 and 4: analysis of oRibo-T or o16S rRNA processing. The lack of the DNA bands in lane 5, where the sample did not contain orthogonal rRNA, confirms specificity of the o-F PCR primer for the o-rRNA. The difference in migration of the PCR products generated on the wt or orthogonal templates is due to the different lengths of the WT-F and o-F primers. b Analysis of the 5′ end processing of a mixture of wt and orthogonal rRNA by primer extension. Note, that the DNA primer used to prime cDNA synthesis does not discriminate between wt and orthogonal rRNA species (see Supplementary Fig. 1a). In b, the agarose gel representing long RNA species is shown below the sequencing gel. Source data are provided in the Source Data file
Fig. 6
Fig. 6
Ribo-seq analysis of translation in the Ribo-T cells. a Expression of the genes in the Ribo-T and wt cells calculated via average RPKM (reads per kilobase per million mapped reads) values across the biological replicates (n = 2) for Ribo-seq data. The dots representing the yhhQ and deaD genes are highlighted. b Expression of r-proteins in cells expressing Ribo-T or wt ribosomes calculated from Ribo-seq data as in panel a. Red dots indicate proteins that are underrepresented in the stalled Ribo-T assembly intermediates. Note that many of the underrepresented proteins are apparently overexpressed in the Ribo-T cells, indicating that their diminished presence in the intermediates is not caused by a low level of expression. c, d Metagene analysis illustrating the difference in the c start- and d stop-codon occupancy in the Ribo-T and wt cells

References

    1. Shine J, Dalgarno L. Determinant of cistron specificity in bacterial ribosomes. Nature. 1975;254:34–38. doi: 10.1038/254034a0. - DOI - PubMed
    1. Hui A, de Boer HA. Specialized ribosome system: preferential translation of a single mRNA species by a subpopulation of mutated ribosomes in Escherichia coli. Proc. Natl Acad. Sci. USA. 1987;84:4762–4766. doi: 10.1073/pnas.84.14.4762. - DOI - PMC - PubMed
    1. Rackham O, Chin JW. A network of orthogonal ribosome × mRNA pairs. Nat. Chem. Biol. 2005;1:159–166. doi: 10.1038/nchembio719. - DOI - PubMed
    1. d’Aquino AE, Kim DS, Jewett MC. Engineered ribosomes for basic science and synthetic biology. Annu. Rev. Chem. Biomol. Eng. 2018;9:311–340. doi: 10.1146/annurev-chembioeng-060817-084129. - DOI - PubMed
    1. Arranz-Gibert P, Vanderschuren K, Isaacs FJ. Next-generation genetic code expansion. Curr. Opin. Chem. Biol. 2018;46:203–211. doi: 10.1016/j.cbpa.2018.07.020. - DOI - PMC - PubMed

Publication types

MeSH terms