. 2019 Feb 25;9(1):2650.
doi: 10.1038/s41598-018-37072-x.

Isothermal Analysis of ThermoFluor Data can readily provide Quantitative Binding Affinities

Affiliations

Isothermal Analysis of ThermoFluor Data can readily provide Quantitative Binding Affinities

Nan Bai et al. Sci Rep. .

Abstract

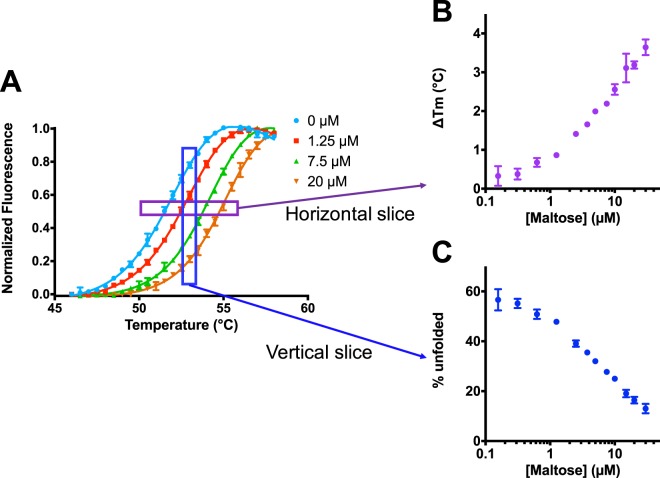
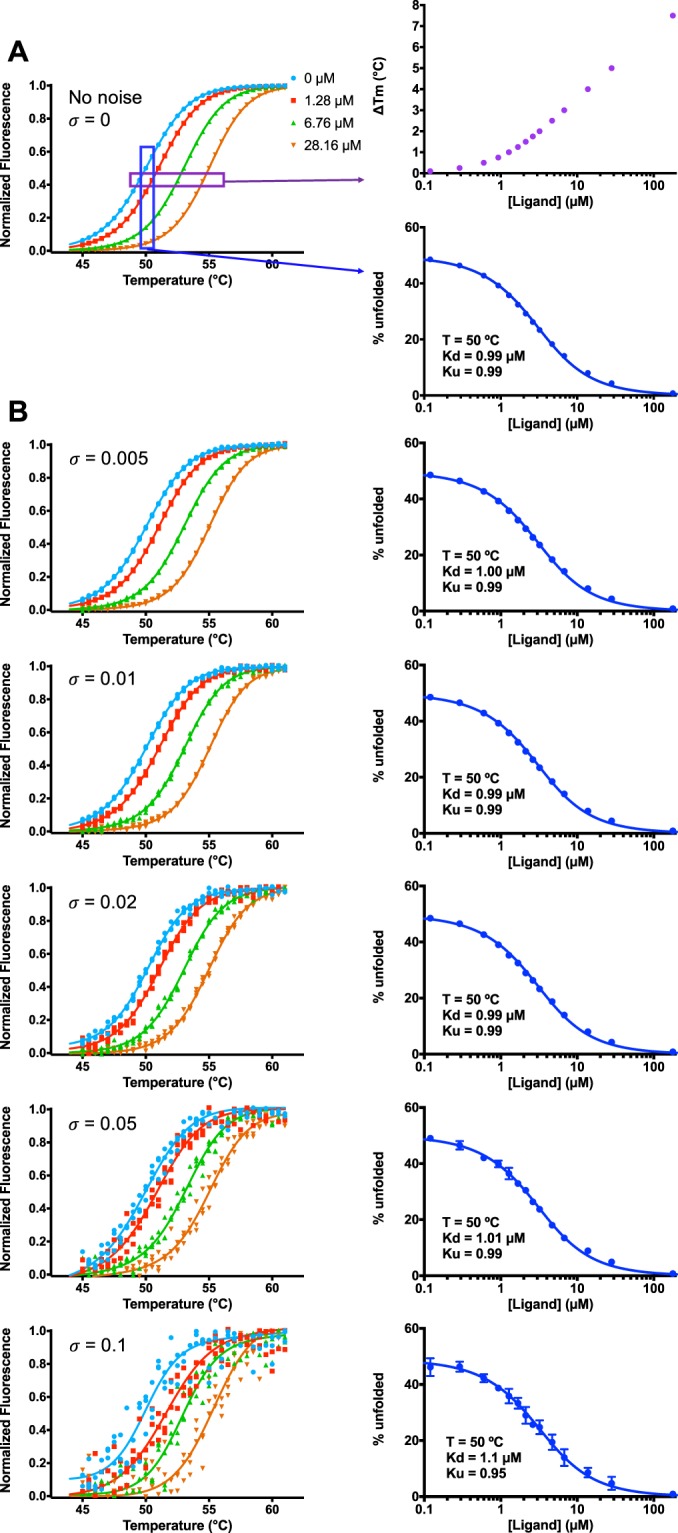
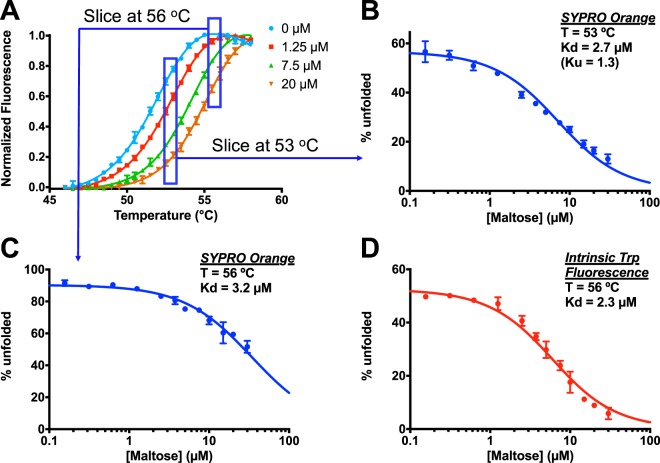
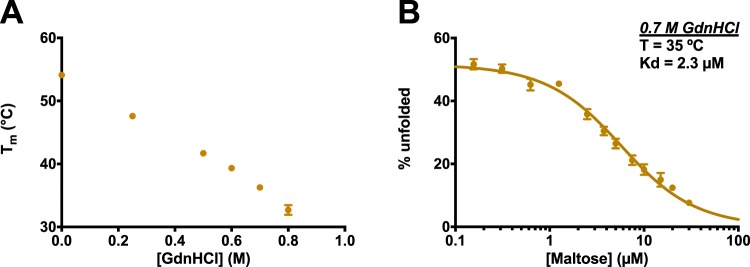
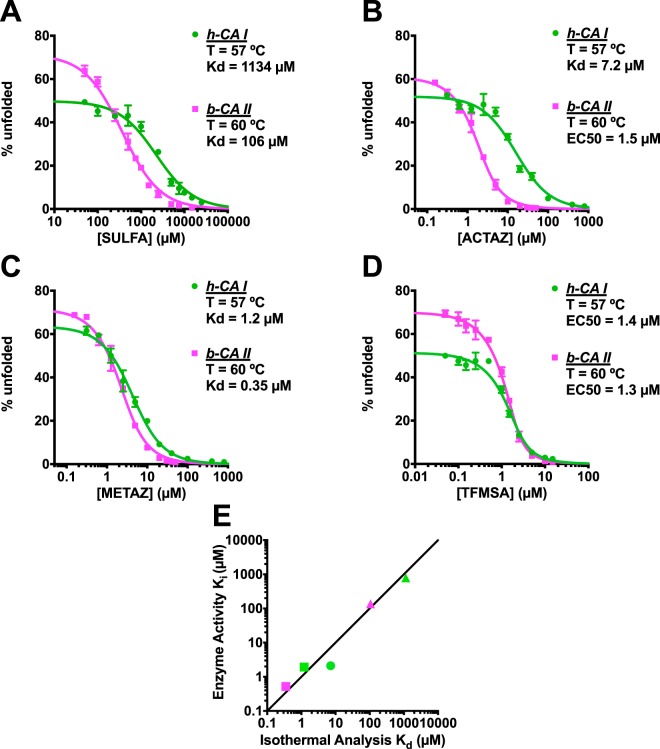
Differential scanning fluorimetry (DSF), also known as ThermoFluor or Thermal Shift Assay, has become a commonly-used approach for detecting protein-ligand interactions, particularly in the context of fragment screening. Upon binding to a folded protein, most ligands stabilize the protein; thus, observing an increase in the temperature at which the protein unfolds as a function of ligand concentration can serve as evidence of a direct interaction. While experimental protocols for this assay are well-developed, it is not straightforward to extract binding constants from the resulting data. Because of this, DSF is often used to probe for an interaction, but not to quantify the corresponding binding constant (Kd). Here, we propose a new approach for analyzing DSF data. Using unfolding curves at varying ligand concentrations, our "isothermal" approach collects from these the fraction of protein that is folded at a single temperature (chosen to be temperature near the unfolding transition). This greatly simplifies the subsequent analysis, because it circumvents the complicating temperature dependence of the binding constant; the resulting constant-temperature system can then be described as a pair of coupled equilibria (protein folding/unfolding and ligand binding/unbinding). The temperature at which the binding constants are determined can also be tuned, by adding chemical denaturants that shift the protein unfolding temperature. We demonstrate the application of this isothermal analysis using experimental data for maltose binding protein binding to maltose, and for two carbonic anhydrase isoforms binding to each of four inhibitors. To facilitate adoption of this new approach, we provide a free and easy-to-use Python program that analyzes thermal unfolding data and implements the isothermal approach described herein ( https://sourceforge.net/projects/dsf-fitting ).


Conflict of interest statement

The authors declare no competing interests.

Figures

Figure 1
Figure 1
Maltose binding to MBP, as probed via DSF. (A) Thermal unfolding of MBP is monitored using SYPRO Orange. Data were collected in the presence of increasing maltose concentrations, leading to a rightward shift in the unfolding transition. (B) The Tm-shift (∆Tm) is determined by plotting the increase in temperature at which each curve has 50% relative fluorescence, corresponding to a horizontal “slice” of the original data. However, this analysis does not provide the binding affinity of the protein/ligand pair. (C) Instead, here we use vertical “slices” of the original data. By plotting – at a single temperature – the fraction of protein that is unfolded as a function of ligand concentration (here at 53 °C), the binding affinity can then be easily determined. All data are collected in triplicate, and error bars correspond to the standard error of the mean (some are too small to be seen).
Figure 2
Figure 2
Simulations to explore the consistency and robustness of isothermal analysis. (A) Simulated thermal unfolding curves were generated using a thermodynamic model for unfolding and binding. Parameters were set as follows: Tm = 50 °C, KdTm = 1 µM, ΔHUTm = 120 kcal mol−1, ΔHbTm = −10 kcal mol−1, ΔCpUTm = 4 kcal mol−1 K−1, ΔCpbTm = −0.5 kcal mol−1 K−1, and total protein concentration = 2 µM. By definition, KUTm = 1. Fitting this simulated data using the simpler isothermal approach yields KUTm = 0.99, and KdTm = 0.99 µM. (B) Upon addition of increasing random noise to the simulated unfolding data, the isothermal approach still leads to accurate estimates of KUTm and KdTm, up to values exceeding the noise typically present in real experimental data.
Figure 3
Figure 3
Determination of maltose/MBP binding affinity using isothermal analysis of thermal unfolding data. (A) Thermal unfolding of MBP is monitored using SYPRO Orange. Data were collected using 12 increasing maltose concentrations, each in triplicate; 4 representative unfolding curves are shown, after normalization using the Boltzmann equation. (B) The fraction of unfolded protein is calculated at 53 °C for each maltose concentration. Fitting using Equations 6 and 8 yields a Kd value of 2.7 µM and a Ku value of 1.3. (C) Extracting instead the fraction of unfolded protein at 56 °C yields a Kd value of 3.2 µM. (D) The thermal unfolding transition was instead monitored using MBP’s intrinsic tryptophan fluorescence, and the fraction of unfolded protein was calculated at 56 °C for each maltose concentration. Two replicates were carried out for each maltose concentration. Fitting this complementary experimental data using Equations 6 and 8 yields a Kd value of 2.3 µM.
Figure 4
Figure 4
Denaturant effect of MBP unfolding and MBP-maltose binding. (A) Tm of MBP decreases with increasing GdnHCl concentration. (B) MBP-maltose binding with 0.7 M GdnHCl at 35 °C. The value of Kd is 2.3 µM. All the experiments were carried out in triplicate. The protein concentration in all the assays was fixed to 2 µM. All assays were taken in the buffer: 120 mM NaCl, 20 mM NaH2PO4/Na2HPO4, pH 7.4 with 1% DMSO and the melting program was set to 0.5 °C/min.
Figure 5
Figure 5
Determination of binding affinities for carbonic anhydrase inhibitors using isothermal analysis of thermal unfolding data. Each inhibitor was characterized with two carbonic anhydrase isoforms, h-CA I (green) and b-CA II (pink). (A) Analysis of SULFA yielded binding constants of 1.1 mM and 0.1 mM for isoforms h-CA I and b-CA II. (B) ACTAZ gave binding constants of 7.2 µM for h-CA I and 1.5 µM as EC50 for b-CA II. (C) METAZ gave binding constants of 1.2 µM and 0.35 µM for the two isoforms. (D) TFMSA gave EC50 of 1.4 µM and 1.3 µM for the two isoforms. (E) Comparison of the binding constants obtained from isothermal analysis of thermal unfolding data versus inhibition constants obtained in an enzyme inhibition activity. The TFMSA/h-CA I, TFMSA/b-CA II and ACTAZ/b-CA II pairs are not included here, because they all have less than 2 µM EC50. All experiments were carried out in triplicate.

References

    1. Pantoliano MW, et al. High-density miniaturized thermal shift assays as a general strategy for drug discovery. J Biomol Screen. 2001;6:429–440. doi: 10.1177/108705710100600609. - DOI - PubMed
    1. Carver TE, et al. Decrypting the biochemical function of an essential gene from Streptococcus pneumoniae using ThermoFluor technology. J Biol Chem. 2005;280:11704–11712. doi: 10.1074/jbc.M413278200. - DOI - PubMed
    1. Zhang R, Monsma F. Fluorescence-based thermal shift assays. Curr Opin Drug Discov Devel. 2010;13:389–402. - PubMed
    1. Holdgate GA, Anderson M, Edfeldt F, Geschwindner S. Affinity-based, biophysical methods to detect and analyze ligand binding to recombinant proteins: matching high information content with high throughput. J Struct Biol. 2010;172:142–157. doi: 10.1016/j.jsb.2010.06.024. - DOI - PubMed
    1. Brandts JF, Lin LN. Study of strong to ultratight protein interactions using differential scanning calorimetry. Biochemistry. 1990;29:6927–6940. doi: 10.1021/bi00481a024. - DOI - PubMed

Publication types