. 2019 Feb 25;10(1):923.
doi: 10.1038/s41467-019-08809-7.

Hybridization is a recurrent evolutionary stimulus in wild yeast speciation

Affiliations

Hybridization is a recurrent evolutionary stimulus in wild yeast speciation

Chris Eberlein et al. Nat Commun. .

Erratum in

Abstract

Hybridization can result in reproductively isolated and phenotypically distinct lineages that evolve as independent hybrid species. How frequently hybridization leads to speciation remains largely unknown. Here we examine the potential recurrence of hybrid speciation in the wild yeast Saccharomyces paradoxus in North America, which comprises two endemic lineages SpB and SpC, and an incipient hybrid species, SpC*. Using whole-genome sequences from more than 300 strains, we uncover the hybrid origin of another group, SpD, that emerged from hybridization between SpC* and one of its parental species, the widespread SpB. We show that SpD has the potential to evolve as a novel hybrid species, because it displays phenotypic novelties that include an intermediate transcriptome profile, and partial reproductive isolation with its most abundant sympatric parental species, SpB. Our findings show that repetitive cycles of divergence and hybridization quickly generate diversity and reproductive isolation, providing the raw material for speciation by hybridization.


Conflict of interest statement

The authors declare no competing interests.

Figures

Fig. 1
Fig. 1
Population structure of Saccharomyces paradoxus in North America. a Sampling locations (circles) of 316 whole-genome sequenced strains from five distinct groups: SpA, SpB, SpC, SpC*, and SpD. The map was drawn with R v3.3.3 using the package maps (version 3.3.0). Detailed strain information can be found in Supplementary Data 1. b Genetic relationship among isolates from a maximum likelihood phylogenetic tree built from 25,280 variable positions. SpD splits into the two sub-clades SpD1 and SpD2 as previously suggested by Hénault et al.. c Grouping of strains by principal component analysis showing the relationship among lineages. PC1 to PC3 separate SpA, SpB, SpC, SpC*, and SpD as independent genetic clusters (For color code, see Fig. 1a). The spread of strains (median and the 20th to 80th percentile range) in each PC (x-axis) is shown. d The two models (M01, M02) from the f4 statistics explain admixed ancestry of SpC* and SpD. Dotted arrows indicate admixture events. e Ranking of the 15 models based on their fit to the data. Filled squares on the top indicate if the models assume admixed ancestry of SpD and SpC*. The five best models indicate hybrid origin of SpD. The two best models matching all f4 statistics (filled dots) suggest a hybrid origin for SpD resulting from a cross between SpB and the hybrid SpC* (model M01), or hybrid origin of SpD resulting from a cross between SpB and SpC, occurring before the origin of a SpC* hybrid (model M02)
Fig. 2
Fig. 2
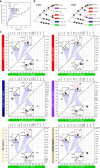
Genome rearrangements support that SpD results from the backcross of the hybrid species SpC* with its parent SpB. a The average pairwise distance (in number of rearrangements) between genomes for each of the 945 tree topologies tested. Topologies are ranked according to a maximum parsimony criterion, the best topologies involving the least rearrangements. The five best topologies (blue shaded area and inset) are highlighted. b Two bifurcating tree topologies (T300 and T284) best describe the evolutionary relationships among North American S. paradoxus according to the maximum parsimony criterion from a. Both show that SpD is more closely related to SpC* and SpB than to SpC. Edges are labelled with the corresponding rearrangements, “iX” denoting inversions and “tX” denoting translocations. Red dotted lines connect conflicting rearrangements, i.e. rearrangements that occur on two or more branches. c Pairwise synteny across seven North American S. paradoxus genomes using SpA as a reference. Insets highlight examples of genomic rearrangements. Inversion i3 on chromosome V and translocation t1 (VItXIII) support the SpC*-SpD close relationship; inversion i5 on chromosome VI supports the SpB-SpC*-SpD relationship; inversion i1 on chromosome X supports the SpB-SpD relationship; inversion i4 on chromosome X is specific to SpC; and inversion i2 on chromosome X is an example of conflicting rearrangement, being shared by SpA, one SpB strain and one SpD strain. Red segments represent inversions. Alignments longer than 1 kb are shown
Fig. 3
Fig. 3
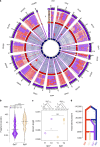
Genome-wide pattern of introgression in the young and old hybrids. a Shared ancestry in 17 SpC* and 13 SpD strains. Genomic positions are colored according to parental genotypes. (i) 51 genes contain partially or completely introgressed genes from SpB (white bar) and are fixed in SpC*. (ii) Fragments of SpB or SpC* ancestry in 13 SpD strains. 12 SpD strains show large ancestral fragments shared with SpB or SpC* (ring 1–2; orientation: from inside to outside). Strain WX21 (ring 13) has many heterozygous regions across the genome, where the separation between SpB and SpC*-like ancestral was not possible (blank elements) (Supplementary Figure 12). Rendered by white bars (chrV, VI, and XII) are nine genes that SpC* inherited from SpB and that are shared between all SpD strains with SpC*. Length distribution of introgressions from SpB shows shorter blocks on average in SpC* than in SpD, supporting a more recent origin of the latter (median of 1.1 kb in SpC* and 12.2 kb in SpD respectively; Mann-Whitney U-test, P-value < 2.2e−16). The genome-wide proportion of regions with SpB-ancestry in SpC* is 3.1% on average, while it is 44.7% on average for SpD. c Relative time of origin of SpD and SpC* (T1) estimated from the divergence of SpB-like regions in each admixed lineage (SpD or SpC*) with corresponding regions in SpB. T2—divergence time of SpB-like regions in admixed lineages with corresponding regions in SpC. Times were estimated for one strain of SpC* and all 13 strains of SpD from the same sampling location. Diamonds depict mean estimates of divergence time across all contiguous SpB-like regions with more than 1000 informative sites. In all SpD strains, SpB-like regions are significantly younger than in SpC* (mean T1, Mann-Whitney test, P-value < 2.3E−05), but divergence time of SpB-like regions with SpC remains the same in two admixed lineages (mean T2, Mann-Whitney U-test, P-value > 0.23). d Dating the hybridization events. The lineage SpD emerged only recently (~2500 years ago) from the crosses between SpB and SpC*. Arrows indicate initial backcrosses between SpC* and SpC
Fig. 4
Fig. 4
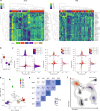
Phenotypic divergence and reproductive isolation of SpD. a Hierarchical clustering of normalized colony growth profiles in 24 conditions based on AUC or MS. The heatmaps correspond to z-score normalization of the rows (conditions) excluding outliers. CSM: complete synthetic medium, Me-α-DGP: methyl-α-D-glucopyranoside, MSM: minimal synthetic medium. b Value normalization used to compare hybrids with their parental lineages across conditions. The difference d of a given strain’s value (white star) to the mid-parent value (green star) is divided by the half-difference a between the parental distributions medians. c Distributions of normalized AUC and MS for the three hybrid lineages SpC*, SpD1, and SpD2 and their parental lineages. P-values of one-sided Mann-Whitney U-tests are detailed in the tables. d PCA on genome-wide gene expression levels. The two first dimensions cumulatively explain 27.8% of the total variance. The 20 genes most contributing to these dimensions are shown. SpC and SpC* are grouping together, while SpD strains show an intermediate transcription profile between SpC/SpC* and SpB. e Reproductive isolation measured from spore viability tests of intra- and inter-lineage crosses from four lineages (SpD is separated into SpD1 and SpD2). High spore viability was detected for all intra-lineage crosses. Inter-lineage crosses generally suffer from low viability. However, inter-lineage crosses between recently emerged or close related lineages (SpC*-SpD) indicate higher fertility than crosses between older lineages (SpB-SpC). The number of crosses in each case is shown in brackets. f Conceptual framework adapted from Mallet to illustrate how hybrids may explore genotypic and phenotypic spaces and fitness peaks. In this framework, SpD may be a group of individuals that need to exploit further genotypic and phenotypic space to gain higher fitness and to potentially occupy novel ecological niches. The color gradient corresponds to variation in fitness with darker colors representing higher fitness. This shows several potential unoccupied and potential niches (dark gray) with fitness peaks that could lead, if reached, to the persistence for SpD

Similar articles

Cited by

References

    1. Anderson E, Stebbins GL. Hybridization as an evolutionary stimulus. Evolution. 1954;8:378–388. doi: 10.1111/j.1558-5646.1954.tb01504.x. - DOI
    1. Kleindorfer S, et al. Species collapse via hybridization in Darwin’s tree finches. Am. Nat. 2014;183:325–341. doi: 10.1086/674899. - DOI - PubMed
    1. Abbott R, et al. Hybridization and speciation. J. Evol. Biol. 2013;26:229–246. doi: 10.1111/j.1420-9101.2012.02599.x. - DOI - PubMed
    1. Nice CC, et al. Hybrid speciation and independent evolution in lineages of alpine butterflies. Evolution. 2013;67:1055–1068. doi: 10.1111/evo.12019. - DOI - PubMed
    1. Rieseberg LH, et al. Major ecological transitions in wild sunflowers facilitated by hybridization. Science. 2003;301:1211–1216. doi: 10.1126/science.1086949. - DOI - PubMed

Publication types

MeSH terms