. 2019 Feb 25;9(1):2638.
doi: 10.1038/s41598-019-38788-0.

How peptide/MHC presence affects the dynamics of the LC13 T-cell receptor

Affiliations

How peptide/MHC presence affects the dynamics of the LC13 T-cell receptor

Jose Luis Dominguez et al. Sci Rep. .

Abstract

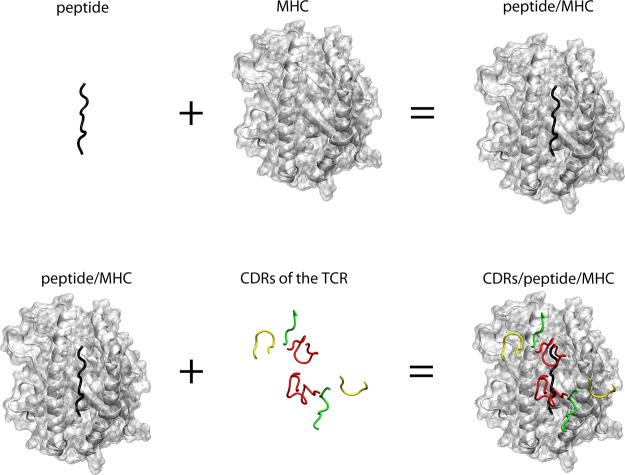
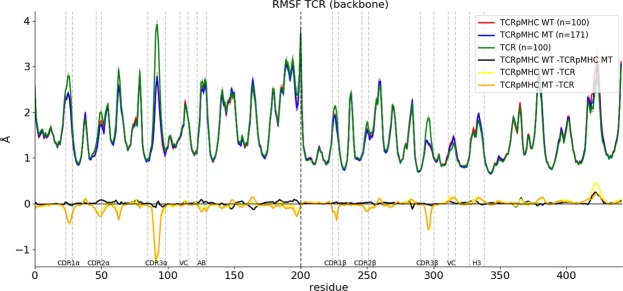
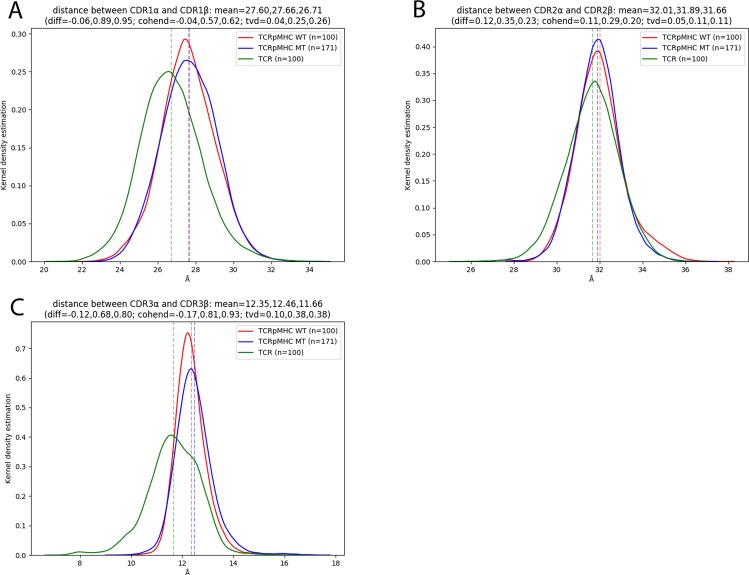
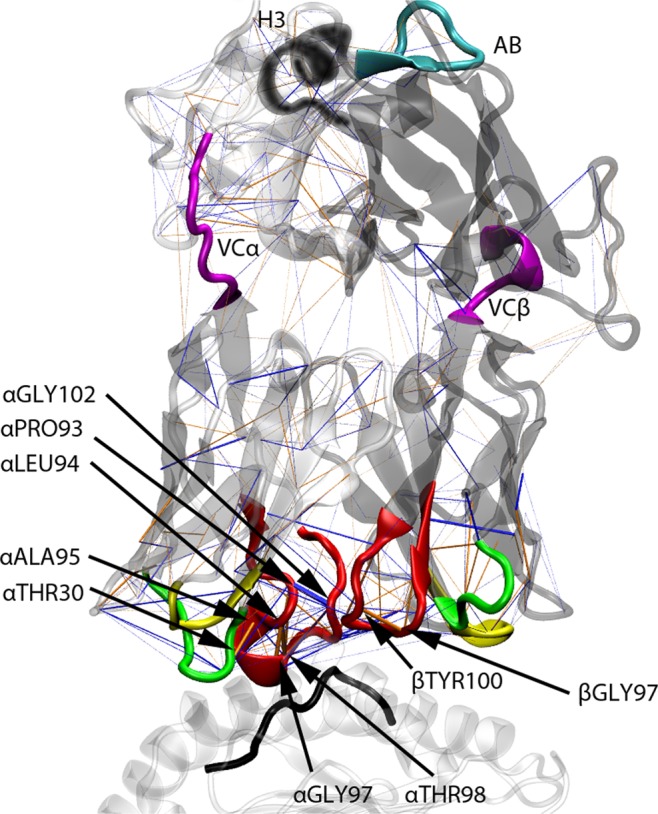
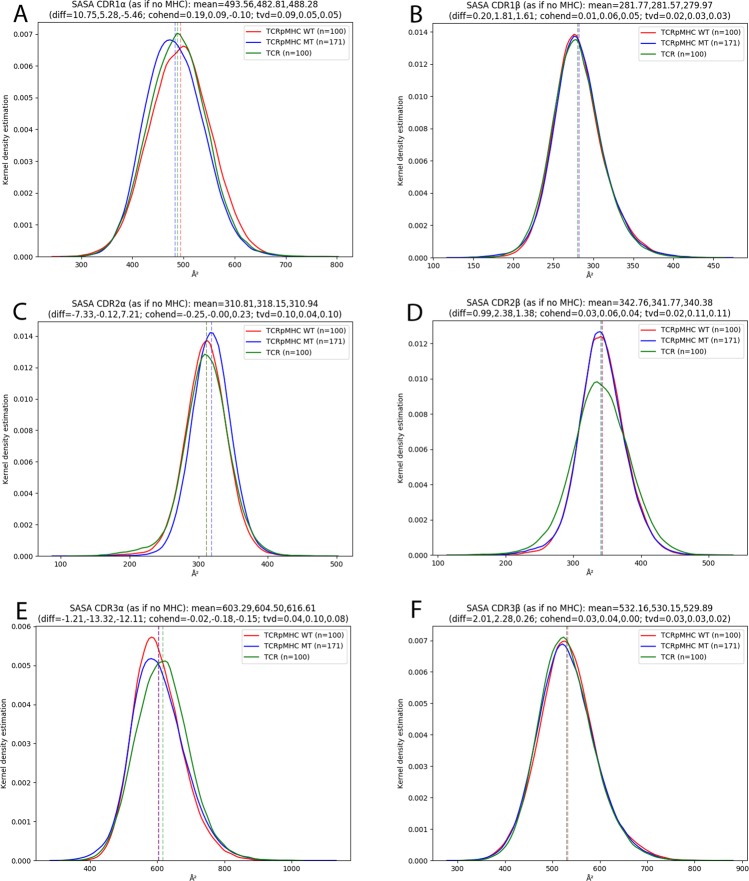
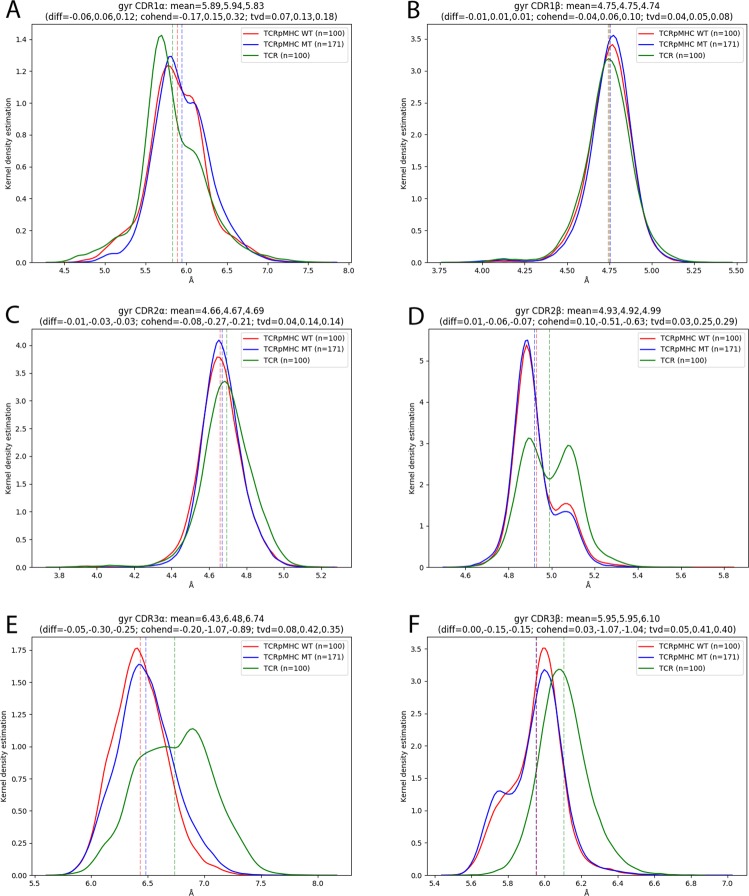
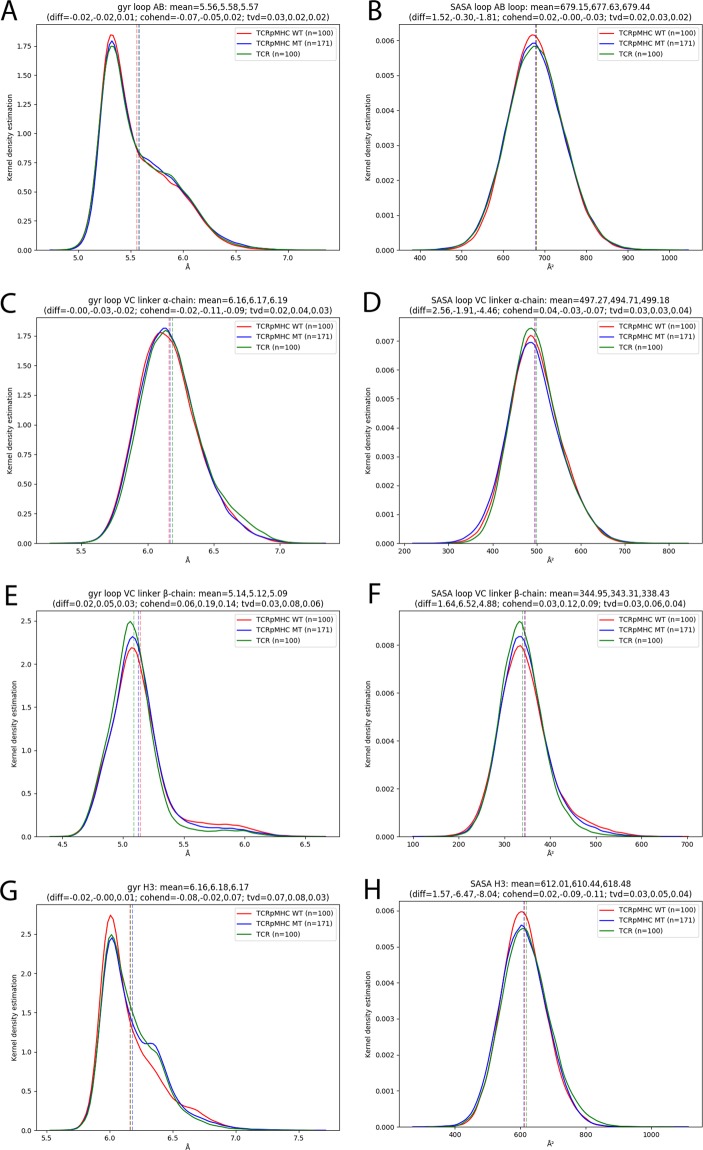
The interaction between T-cell receptors (TCRs) of T-cells and potentially immunogenic peptides presented by MHCs of antigen presenting cells is one of the most important mechanisms of the adaptive human immune system. A large number of structural simulations of the TCR/peptide/MHC system have been carried out. However, to date no study has investigated the differences of the dynamics between free TCRs and pMHC bound TCRs on a large scale. Here we present a study totalling 37 100 ns investigating the LC13 TCR in its free form as well as in complex with HLA-B*08:01 and different peptides. Our results show that the dynamics of the bound and unbound LC13 TCR differ significantly. This is reflected in (a) expected results such as an increased flexibility and increased solvent accessible surface of the CDRs of unbound TCR simulations but also in (b) less expected results such as lower CDR distances and compactness as well as alteration in the hydrogen bond network around CDR3α of unbound TCR simulations. Our study further emphasises the structural flexibility of TCRs and confirms the importance of the CDR3 loops for the adoption to MHC.


Conflict of interest statement

The authors declare no competing interests.

Figures

Figure 1
Figure 1
Top view on the TCR(CDR)/peptide/MHC interface. Black sticks: peptide; Grey cartoon and transparent surface: MHC; Green tubes: CDR1; Yellow tubes: CDR2; Red tubes: CDR3.
Figure 2
Figure 2
Mean RMSF values for the TCRpMHC WT (red), TCRpMHC MT (blue) and unbound TCR (green) simulations. Thin dashed lines of the same colour indicate +/− standard error of mean (very small as n is high). For easier interpretation the differences between the mean values are shown at the bottom in black, yellow, and orange. The thick vertical dashed line indicates the border between the TCR alpha and beta chain.
Figure 3
Figure 3
Distributions of the distances between the CDR loops for TCRpMHC, unbound TCR, and TCRpMHC mutants. Top left: CDR1. Top right: CDR2. Bottom: CDR3.
Figure 4
Figure 4
3D visualisation of the H-bond network difference between TCR and TCRpMHC WT simulations using pyHVis3D. Orange lines indicate more H-bonds in TCRpMHC simulations while blue lines indicate more H-Bonds in TCR simulations. The thickness of the line is proportional to the magnitude of difference. Black tube: peptide; White transparent cartoon on the bottom: MHC; White transparent cartoon top left: TCR α-chain; Grey transparent cartoon top right: TCR β-chain. Green tubes: CDR1; Yellow tubes: CDR2; Red tubes: CDR3; Magenta tubes: linking regions between variable and constant regions of the TCR; Cyan tube: AB-loop; Black tube: H3 region.
Figure 5
Figure 5
Theoretical SASA of the six CDR loops not taking into account the presence of the MHC for the SASA calculation. The original SASA values are shown in Fig. S2. (A) CDR1α. (B) CDR1β. (C) CDR2α. (D) CDR2β. (E) CDR3α. (F) CDR3β.
Figure 6
Figure 6
Radius of gyration of the six CDR loops. (A) CDR1α. (B) CDR1β. Cleft: CDR2α. Middle Right: CDR2β. Bottom left: CDR3α. Bottom Right: CDR3β.
Figure 7
Figure 7
Analysis of non-CDR loops of interest. The analysis includes linking regions between the variable and constant domain (VC) and the previously described AB-linker and H3 region. (A) Radius of gyration of the AB-loop, (B) SASA of the AB-loop, (C) Radius of gyration of the VCalinker, (D) SASA of the VCa-linker, (E) Radius of gyration of the VCb-linker, (F) SASA of the VCb-linker, (G) Radius of gyration of the H3 region, (H) SASA of the H3 region.

Similar articles

Cited by

References

    1. Hospital A, Goni JR, Orozco M, Gelpi JL. Molecular dynamics simulations: advances and applications. Adv. Appl. Bioinform. Chem. 2015;8:37–47. - PMC - PubMed
    1. Dodson GG, Lane DP, Verma CS. Molecular simulations of protein dynamics: new windows on mechanisms in biology. EMBO Rep. 2008;9(2):144–150. - PMC - PubMed
    1. Kalyaanamoorthy S, Chen YP. Modelling and enhanced molecular dynamics to steer structure-based drug discovery. Prog. Biophys. Mol. Biol. 2014;114(3):123–136. - PubMed
    1. Sledz P, Caflisch A. Protein structure-based drug design: from docking to molecular dynamics. Curr. Opin. Struct. Biol. 2018;48:93–102. - PubMed
    1. Kappel K, Miao Y, McCammon JA. Accelerated molecular dynamics simulations of ligand binding to a muscarinic G-protein-coupled receptor. Q. Rev. Biophys. 2015;48(4):479–487. - PMC - PubMed

Publication types

MeSH terms