. 2019 Feb 25;10(1):936.
doi: 10.1038/s41467-019-08840-8.

Dynamic network coding of working-memory domains and working-memory processes

Affiliations

Dynamic network coding of working-memory domains and working-memory processes

Eyal Soreq et al. Nat Commun. .

Abstract

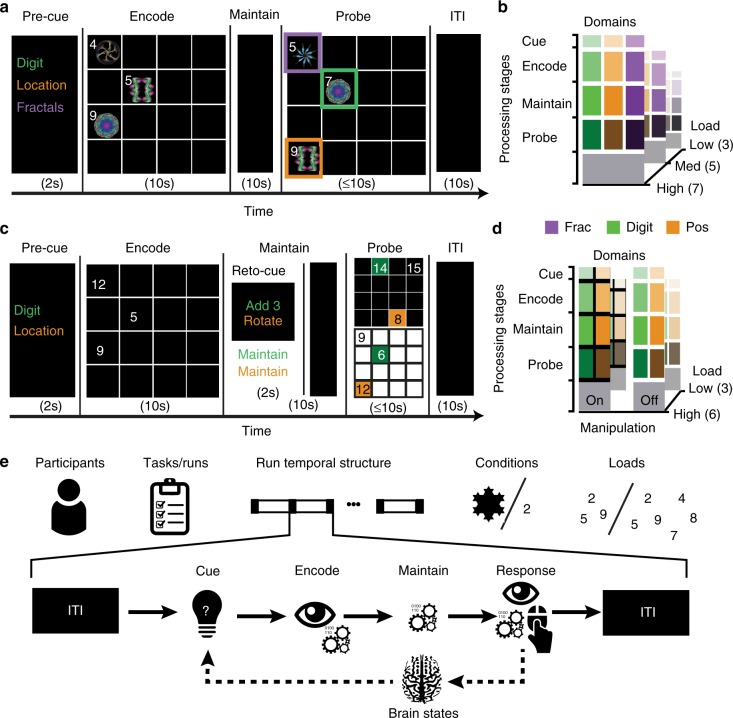
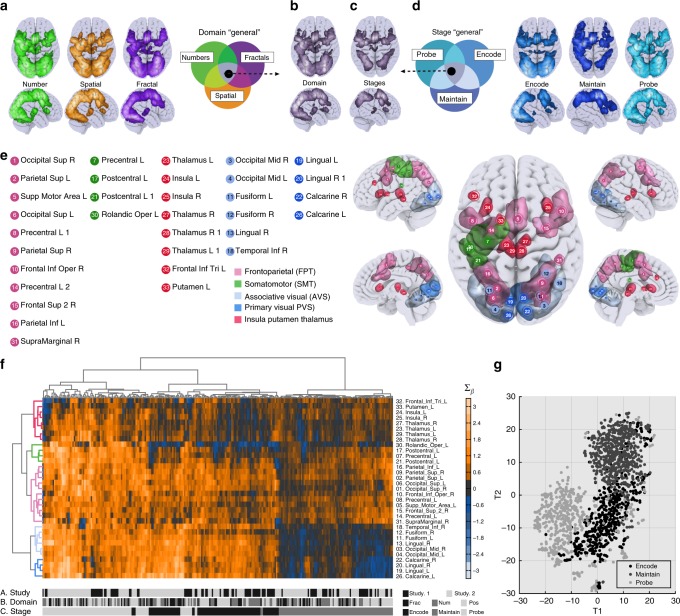
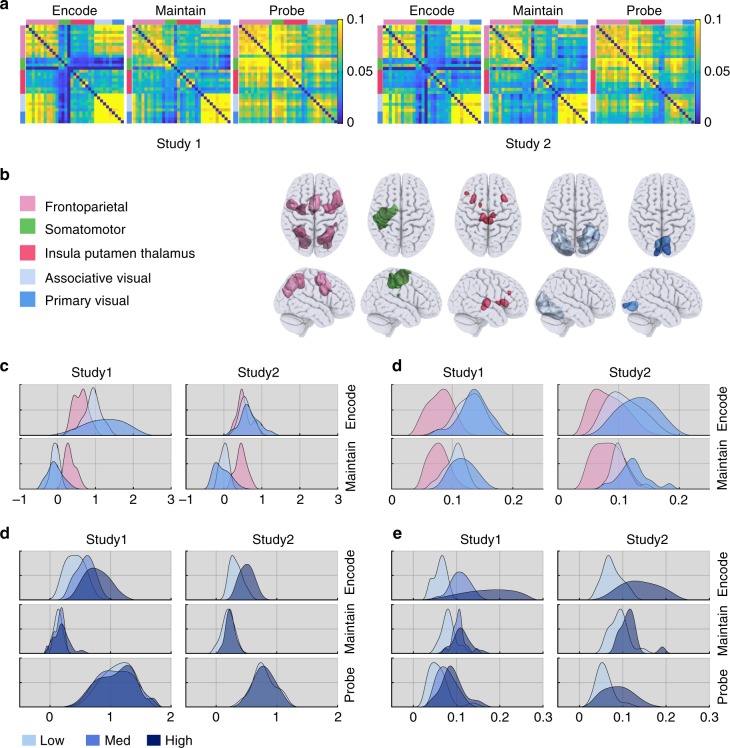
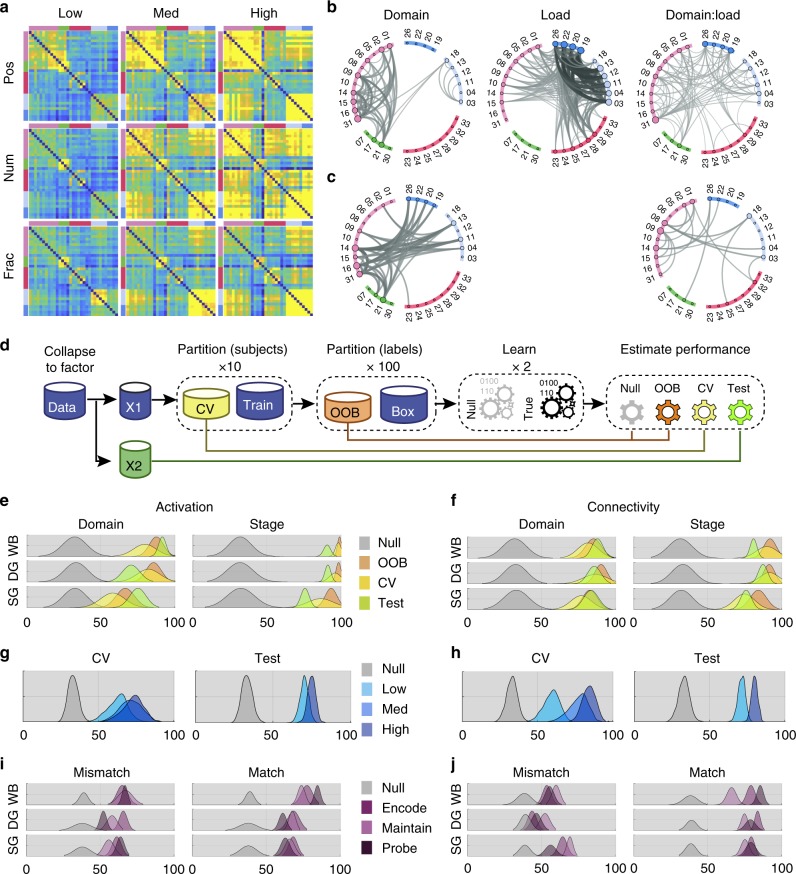
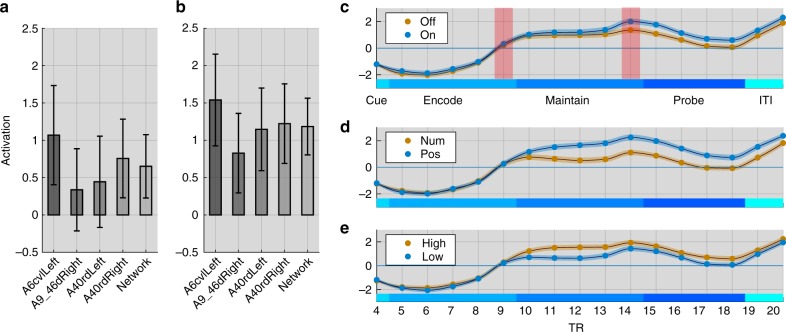
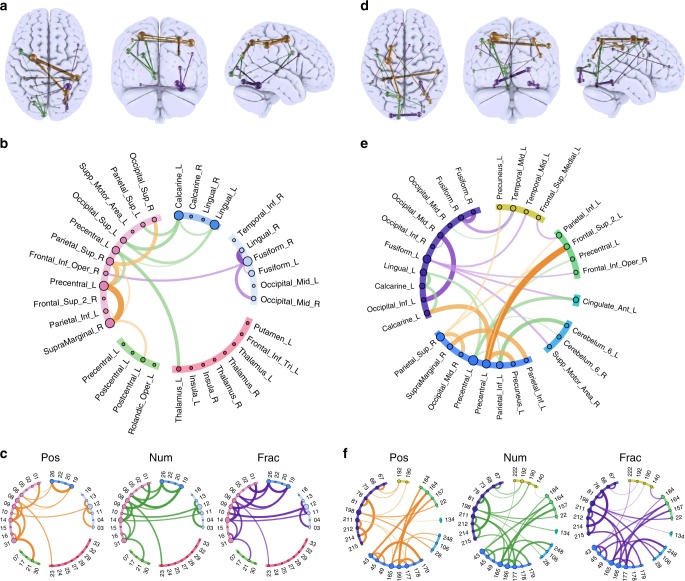
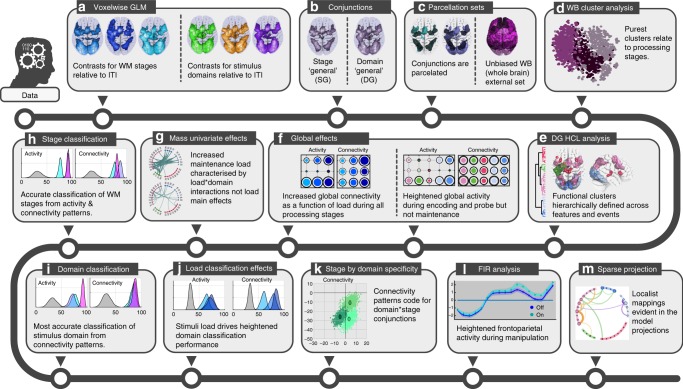
The classic mapping of distinct aspects of working memory (WM) to mutually exclusive brain areas is at odds with the distributed processing mechanisms proposed by contemporary network science theory. Here, we use machine-learning to determine how aspects of WM are dynamically coded in the human brain. Using cross-validation across independent fMRI studies, we demonstrate that stimulus domains (spatial, number and fractal) and WM processes (encode, maintain, probe) are classifiable with high accuracy from the patterns of network activity and connectivity that they evoke. This is the case even when focusing on 'multiple demands' brain regions, which are active across all WM conditions. Contrary to early neuropsychological perspectives, these aspects of WM do not map exclusively to brain areas or processing streams; however, the mappings from that literature form salient features within the corresponding multivariate connectivity patterns. Furthermore, connectivity patterns provide the most precise basis for classification and become fine-tuned as maintenance load increases. These results accord with a network-coding mechanism, where the same brain regions support diverse WM demands by adopting different connectivity states.


Conflict of interest statement

The authors declare no competing interests.

Figures

Fig. 1
Fig. 1
Study and task design. Participants undertook three runs of the task consisting of contiguous sequences of WM trials presented in pseudo-randomised order. a Each trial in Study 1 had four processing stages. (1) A pre-cue informed the participant to encode either numbers, fractals or spatial locations. (2) An array was displayed containing numbers and fractal patterns co-located within a 4 × 4 grid. The participant had 10 s to encode the stimuli from the cued domain. (3) The stimuli were replaced with a fixation cross that was displayed for 10 s. The participant maintained the encoded information in WM during this delay. (4) The stimulus array reappeared with one item from each domain (number, fractal and location) changed. The participant tried to identify the cell that contained the changed item from the maintained domain. b The trials differed according to cued stimulus domain and number of items (3, 5 or 7) per domain (load) in a 3 × 3 factorial design. c Study 2 differed in three ways. (1) There were two stimulus domains—numbers and spatial locations. (2) There were two levels of WM load (3 vs. 6). (3) A retro-cue was displayed at the start of the maintenance period. On 50% of trials this informed the participants to maintain the encoded information. On the other 50% it instructed them to manipulate that information, i.e., by mentally rotating the encoded spatial positions 90 degrees clockwise or adding 3 to encoded numbers. d The trials differed according to cued stimulus domain, number of items per domain and requirement to manipulate in a 2 × 2 × 2 factorial design. e The trials were separated by a 10 s inter-trial-interval (ITI). Measures of activity and connectivity were calculated separately for each trial, stage and participant; these data formed the input to the machine-learning pipeline
Fig. 2
Fig. 2
Inspecting activation commonalities across experiments. To examine the similarity in voxelwise activations across the two studies, we performed two-independent conjunction analyses focusing on WM processing stages and domains. Analysing the T-statistics maps for the three stimulus domains compared to ITI period (a) a minimal statistics intersection produced (b) the domain general (DG) map. Conducting a further intersection analysis on T-statistics maps for the processing stages (d) produced (c) the subset of DG voxels that were ‘state general’, i.e., being active for all stages of the WM task (SG). e Clustering of ROIs (rows) produced an interpretable functional separation consisting of frontoparietal, somatomotor, associative visual, and primary visual areas, and insular plus striatal areas. f Hierarchical clustering analysis was applied to brain activation data with WM stages per domain separately on the X-axis and DG ROIs on the Y-axis. Clustering (represented by similar coloured sections of the dendrogram) of these mini-blocks (columns) corresponded to the WM stages not stimulus domains and had high purity (94.63%). g Applying dimension reduction to a whole-brain regions of interest further supported that WM stages formed the purest clustering of ROI activation patterns
Fig. 3
Fig. 3
Comparing bold activity and functional connectivity across experiments. a Mean functional connectivity matrices during encoding, maintenance and probe for the two studies. Connectivity matrices were sorted based on the previously defined functional clusters. Distributions across participants of mean DG ROI activity (b) and intra-cluster functional connectivity (c) during encoding and maintenance relative to the ITI. Colours represent frontal and visual clusters (FPT, AVS and PVS). All clusters were active during encoding but only the FPT cluster was active during maintenance. All clusters showed significant FC during both encoding and maintenance. Distributions across participants of DG ROI activity (d) and intra-cluster functional connectivity (e) averaged across ROI cluster and broken down by load. Activity was increased at higher loads during encoding but not during maintenance or probe. In contrast, intra-cluster FC was upregulated at higher WM load during all three stages
Fig. 4
Fig. 4
Decoding domains across experimental factors. a Mean functional connectivity matrices for the WM domains and loads collapsed across stages in Study 1. Visual inspection of these plots indicated upregulation of connectivity as a function of load. b Mass univariate analyses including data from both studies and collapsed across WM stage showed connections with significant main effects of load and domain, and significant load × domain interactions. Note, the significant effects of load centre on intra- and inter-connectivity of the visual ROIs. Repeating this analysis for the maintenance stage only (c) showed significant main effects of domain and domain × load interactions. Critically, when the effects of visual input were controlled in this manner, there were no main effects of load. Significant interactions centred on the intra and inter-connectivity of frontoparieal ROIs. (FDR corrected at p < 0.01). d Machine-learning pipeline. Data from Study 1 were partitioned into ten different cross-validation subsets. Training data were bootstrapped with replication 100 times to form training and validation sub-partitions. These data were used to form both true and null models across participants (i.e., scrambling the training labels). All data from Study 2 were assessed across studies. performance histograms for both activity (e) and connectivity (f) for decoding domains, and stages showed high accuracy for real (yellow, green and orange) vs null (grey) models. gh Classification of domains based on DG ROI activation (g) and connectivity (h) was significantly better at high relative to low WM load. ij Domain classification models trained using events from all stages generalised well for both activity and functional connectivity. Notably though, training models using a specific stage a significant reduction in classification accuracy when testing events from stages that mismatched the model for connectivity but not activity. This accorded with some stage-specific coding of domains in the dynamic connectivity state of the network
Fig. 5
Fig. 5
Time series analyses. a ROI activity at the end of the encoding phase (TR9) for the manipulation minus maintenance trials. There were no significant differences in activity for these conditions prior to the retro-cue. Error bars represent standard error of the mean. b ROI activity just prior to the probe (TR14). There were significant increases in activity for the manipulation vs. maintenance trials in all ROIs. ce Plotting the entire BOLD time series averaged across all four ROIs showed that in addition to the effects of manipulation there were also effects of both domain and load. Therefore, the set of brain regions associated with manipulation demands is also sensitive to other aspects of WM
Fig. 6
Fig. 6
Sparse model’s anatomical projection. Projections (a) and schemaballs (b) of weightings for the sparsified classification model of stimulus domain, generated from whole-trial data of the DG ROI set. GLMnet identified the minimal subset of connections required for accurate classification of each stimulus domain along with weightings and bias terms. Lines represent the weightings of connections for each WM domains as follows: orange = position, green = number and purple = fractal. c Schemaball of t-values for maintenance of each domain relative to the ISI. Thresholded at p < 0.05 with FDR correction for multiple comparisons. Note, none of these connections, which contributed the most information for classification of the stimulus domains, was active for a single stimulus domain exclusively. d Repeating the sparsification analysis with the whole-brain ROI set generated comparable results in terms of the gross topography of position, number and fractal connectivity patterns (e). f As per the DG ROI set, the connections within the whole-brain that contributed the most information for classification of domains were generally active for multiple domains during maintenance
Fig. 7
Fig. 7
Effects overview. a Voxelwise statistical parametric maps were calculated with general linear models for processing stages (in blue) and stimulus domains (number, spatial and fractal pattern). b Conjunctions were calculated between the statistical maps to generate DG and SG maps. These accorded with previously reported Multiple Demand Cortex. c Conjunction maps were sub-divided into discrete ROIs using a 3D watershed algorithm. d Hierarchical clustering showed that the purest stratification of ROI activation patterns related to WM processing stages as opposed to stimulus domains. e Hierarchical clustering also generated interpretable functional clusters of DG ROIs. f Effects of task conditions on ROI clusters showed heightened global activity and connectivity during encoding, and heightened connectivity only during maintenance. g Mass univariate analyses showed increased maintenance load was characterised by domain-load interactions as opposed to load main effects, with these being focused on frontoparietal connectivity. h WM stages were classified with high accuracy from ROI activity and connectivity patterns. i Stimulus domain was classified but with superior accuracy for connectivity patterns. j Stimulus domain classification was superior at heightened load. k Classification of domains generalised across WM stages but was superior within stage when based on connectivity patterns, indicating coding of domain × stage conjunctions. I Heightened activation for WM manipulation was evident within the expected ROI set; however, the same ROIs showed greater sensitivity to WM domains and stages. m Anatomical projections of sparse classification models corresponded well with the mappings expected based on the classic localist literature

References

    1. Baddeley A. Working memory: theories, models, and controversies. Annu. Rev. Psychol. 2012;63:1–29. doi: 10.1146/annurev-psych-120710-100422. - DOI - PubMed
    1. Owen AM, Evans AC, Petrides M. Evidence for a two-stage model of spatial working memory processing within the lateral frontal cortex: a positron emission tomography study. Cereb. Cortex. 1996;6:31–38. doi: 10.1093/cercor/6.1.31. - DOI - PubMed
    1. Postle BR. The cognitive neuroscience of visual short-term memory. Curr. Opin. Behav. Sci. 2015;1:40–46. doi: 10.1016/j.cobeha.2014.08.004. - DOI - PMC - PubMed
    1. Stokes MG. ‘Activity-silent’working memory in prefrontal cortex: a dynamic coding framework. Trends Cogn. Sci. 2015;19:394–405. doi: 10.1016/j.tics.2015.05.004. - DOI - PMC - PubMed
    1. Fletcher PC, Henson RNA. Frontal lobes and human memory: insights from functional neuroimaging. Brain. 2001;124:849–881. doi: 10.1093/brain/124.5.849. - DOI - PubMed

Publication types