. 2019 Feb 25;9(1):2676.
doi: 10.1038/s41598-019-39276-1.

Insights into the antigenic advancement of influenza A(H3N2) viruses, 2011-2018

Affiliations

Insights into the antigenic advancement of influenza A(H3N2) viruses, 2011-2018

Patricia A Jorquera et al. Sci Rep. .

Abstract

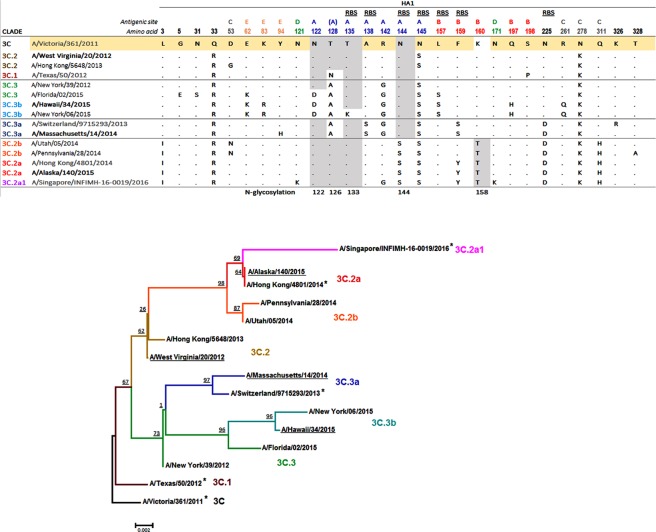
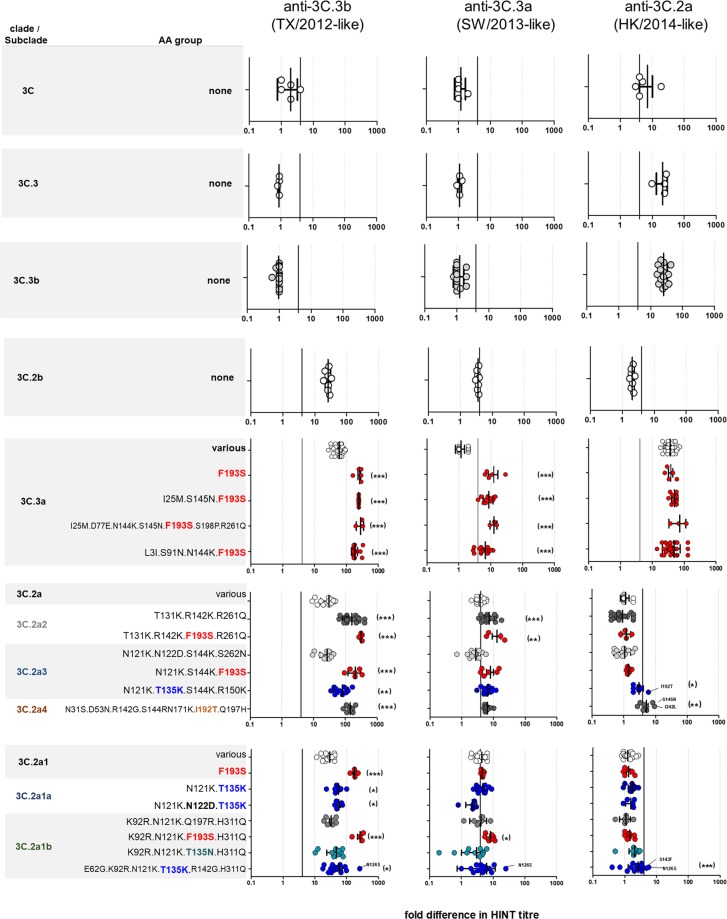
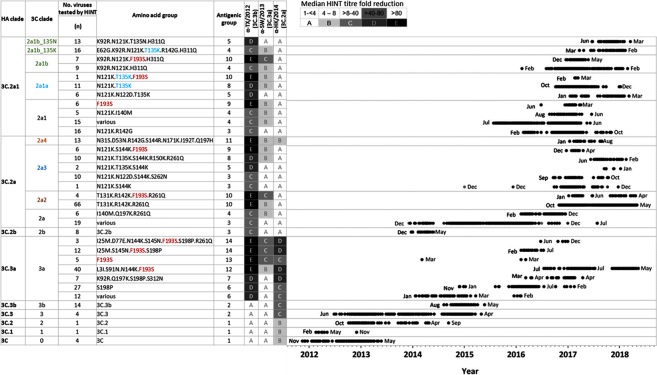
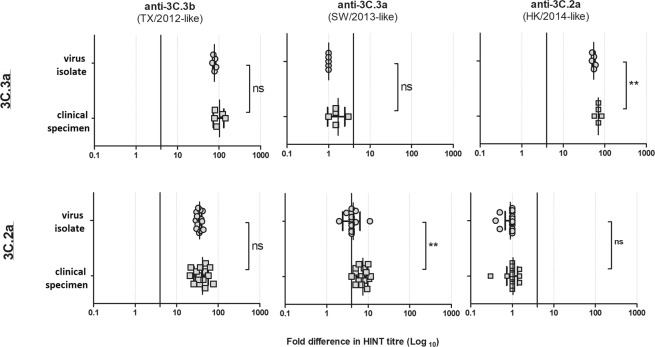
Influenza A(H3N2) viruses evade human immunity primarily by acquiring antigenic changes in the haemagglutinin (HA). HA receptor-binding features of contemporary A(H3N2) viruses hinder traditional antigenic characterization using haemagglutination inhibition and promote selection of HA mutants. Thus, alternative approaches are needed to reliably assess antigenic relatedness between circulating viruses and vaccines. We developed a high content imaging-based neutralization test (HINT) to reduce antigenic mischaracterization resulting from virus adaptation to cell culture. Ferret reference antisera were raised using clinical specimens containing viruses representing recent vaccine strains. Analysis of viruses circulating during 2011-2018 showed that gain of an N158-linked glycosylation in HA was a molecular determinant of antigenic distancing between A/Hong Kong/4801/2014-like (clade 3C.2a) and A/Texas/50/2012-like viruses (clade 3C.1), while multiple evolutionary HA F193S substitution were linked to antigenic distancing from A/Switzerland/97152963/2013-like (clade 3C.3a) and further antigenic distancing from A/Texas/50/2012-like viruses. Additionally, a few viruses carrying HA T135K and/or I192T showed reduced neutralization by A/Hong Kong/4801/2014-like antiserum. Notably, this technique elucidated the antigenic characteristics of clinical specimens, enabling direct characterization of viruses produced in vivo, and eliminating in vitro culture, which rapidly alters the genotype/phenotype. HINT is a valuable new antigenic analysis tool for vaccine strain selection.


Conflict of interest statement

The authors declare no competing interests.

Figures

Figure 1
Figure 1
Representative A(H3N2) viruses utilized to generate HINT reference material. (A) HA1 sequences of human respiratory specimens selected to produce reference material (shown in bold) and cell-grown counterparts of viruses recommended as A(H3N2) vaccine strains during 2012–2017 (shown in grey). A/Victoria/361/2011 (M1: EPI ISL 101506), A/Texas/50/2012 (M1,C1: EPI ISL 101506), A/Switzerland/9715293/2013 (S1: EPI ISL 162149), A/Hong Kong/4801/2014 (S1: EPI ISL 165554); A/Singapore/INFIMH-16-0019/2016 (original: EPI ISL 225834) was recommended for the SH 2018 season. All viruses listed share sequons of N-glycosylation at residues 8, 22, 38, 45, 63, 165, 246, 246, 285 in HA1 and 154 in HA2. AA 128 belong to antigenic site B, however substitution T128N/A results in loss of glycosylation on N126 (antigenic site A). RBS: Receptor binding site. (B) Phylogenetic relationship among representative influenza A(H3N2) HA genes. Clinical specimens used in this study are underlined, and vaccines are marked with an asterisk. Branching patterns are color-coded by A(H3N2) HA genetic clade. Bootstraps per parent node and the scale bar (in nucleotide mutations per site) are indicated.
Figure 2
Figure 2
HINT neutralization profile of A(H3N2) viruses circulating during 2011–2018. HA clades (A) 3C, (B) 3C.3, (C) 3C.3b, (D) 3C.2b, (E) 3C.3a, (F) 3C.2a and (G) subclade 3C.2a1. HA1 AA changes compared to each HA clade consensus sequence are shown on the Y-axis. “Various” correspond to viruses that had a HA sequence identical to the clade-specific consensus sequence or viruses carrying AA substitutions that could not be assigned to any group. Genetic groups encoding substitutions at positions 135 and/or 193 are highlighted in bold blue and bold red, respectively. The vertical black line indicates a 4-fold reduction in HINT titre. Error bar indicates the population mean ± standard deviation of the mean. The p values were calculated using the nonparametric Kruskal-Wallis test with Dunns post-test. *p < 0.05, **p < 0.005, ***p < 0.0005 compared to group “various”.
Figure 3
Figure 3
Antigenic Landscape using NGS and HINT data, 2011–2018. Neutralization profiles shown in Fig. 2 were separated in different antigenic groups according to HINT titre fold reduction as: (A) 1- to <4-fold, (B) 4- to 8-fold, (C) >8- to 40-fold, (D) >40- to 80-fold and (E) >80-fold. Based on this criteria, all viruses collected during 2011–2018 and tested using HINT fell into one of 14 antigenic groups (1–14). New nomenclature for clade 3C.2a subclades in shown next to the old nomenclature. To visualize the period of circulation of the different antigenic groups in U.S., the dates of virus collection were retrieved and plotted.
Figure 4
Figure 4
Modelling antigenic trends in the A(H3N2) virus HINT landscape. Genetic identities at positions 135, 192, 193, and 261 in the HA protein are overlaid on antigenic maps for (A) 3C.2a/2a1 and (B) 3C.3a strains with mean (±SD) antigenic distance relative to (C) α-3C.2a (AK/140), α-3C.3a (MA/14), and α-3C.3b (HI/34) antisera. Dashed lines in Panels A and B, highlighted 3C.2a/2a1 and 3C.3a protein sequences which encode the F193S substitution (bold red in Panel C). Dots in Panel C, no sequence difference from the 3C.2a consensus. Light gray icons, strains which encode (A) non-3C.2a/2a1 and (B) non-3C.3a protein sequences. 3C.3 (N = 4), 3C.2b (N = 8), and 3C.3b (N = 14) strain comparisons are not shown. Antigenic map parameters are as detailed in Fig. S4.
Figure 5
Figure 5
Effect of glycosylation sequon 158–160 loss on HINT neutralization patterns for 3C.2a and 3C.2a1 viruses. HA (A) clade 3C.2a and (B) subclade 3C.2a1. HA1 AA changes compared to each HA clade consensus sequence are shown on the Y-axis. Genetic groups which encode the F193S substitution are indicated in bold red. The vertical black lines indicate a 4-fold reduction in HINT titer. The bar indicates the mean ± standard deviation of the mean. The p values were calculated using a Paired t test. Ns = no significant; *p < 0.05, **p < 0.005, ***p < 0.0005.
Figure 6
Figure 6
HINT neutralization profile of clinical specimens and matching virus isolates collected in the 2014–2015 season. HA clades (A) 3C.3a and (B) 3C.2a. The vertical black lines indicate a 4-fold reduction in HINT titre. The bar indicates the mean ± standard deviation of the mean. The p values were calculated using a Paired t test. ns = no significant; *p < 0.05, **p < 0.005, ***p < 0.0005.

References

    1. Doud MB, Hensley SE, Bloom JD. Complete mapping of viral escape from neutralizing antibodies. PLoS Pathog. 2017;13(3):e1006271. doi: 10.1371/journal.ppat.1006271. - DOI - PMC - PubMed
    1. Garten R, et al. Update: Influenza Activity in the United States During the 2017–18 Season and Composition of the 2018–19 Influenza Vaccine. MMWR Morb Mortal Wkly Rep. 2018;67(22):634–642. doi: 10.15585/mmwr.mm6722a4. - DOI - PMC - PubMed
    1. Bedford, T. N. R. Seasonal influenza circulation patterns and projections for Feb 2018 to Feb 2019. bioRxiv (2018).
    1. WHO. Worldwide Influenza Centre- The Francis Crick Instititute. February 2017 Interim Report. Available from, https://www.crick.ac.uk/sites/default/files/2018-07/crick_sh2017_vcm_rep... (2017).
    1. Smith DJ, et al. Mapping the antigenic and genetic evolution of influenza virus. Science. 2004;305(5682):371–6. doi: 10.1126/science.1097211. - DOI - PubMed

Publication types

MeSH terms