. 2019 Mar;21(3):359-371.
doi: 10.1038/s41556-019-0291-8. Epub 2019 Feb 25.

Apical-basal polarity inhibits epithelial-mesenchymal transition and tumour metastasis by PAR-complex-mediated SNAI1 degradation

Affiliations

Apical-basal polarity inhibits epithelial-mesenchymal transition and tumour metastasis by PAR-complex-mediated SNAI1 degradation

Hae-Yun Jung et al. Nat Cell Biol. 2019 Mar.

Erratum in

Abstract

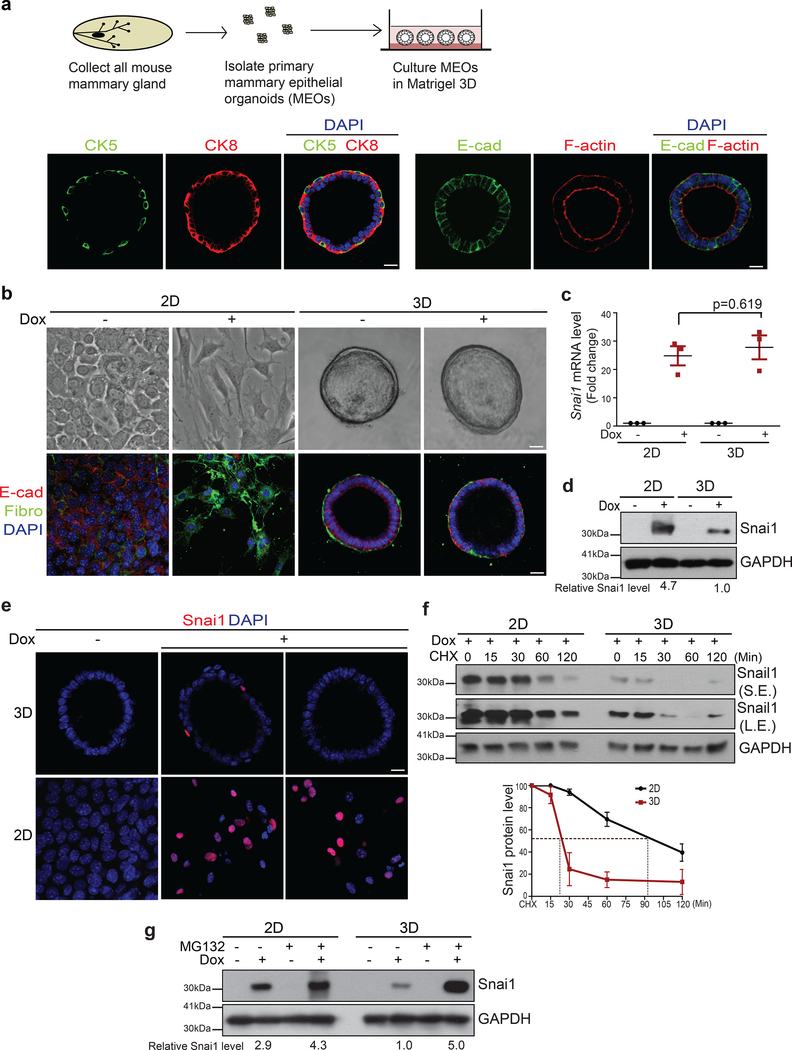
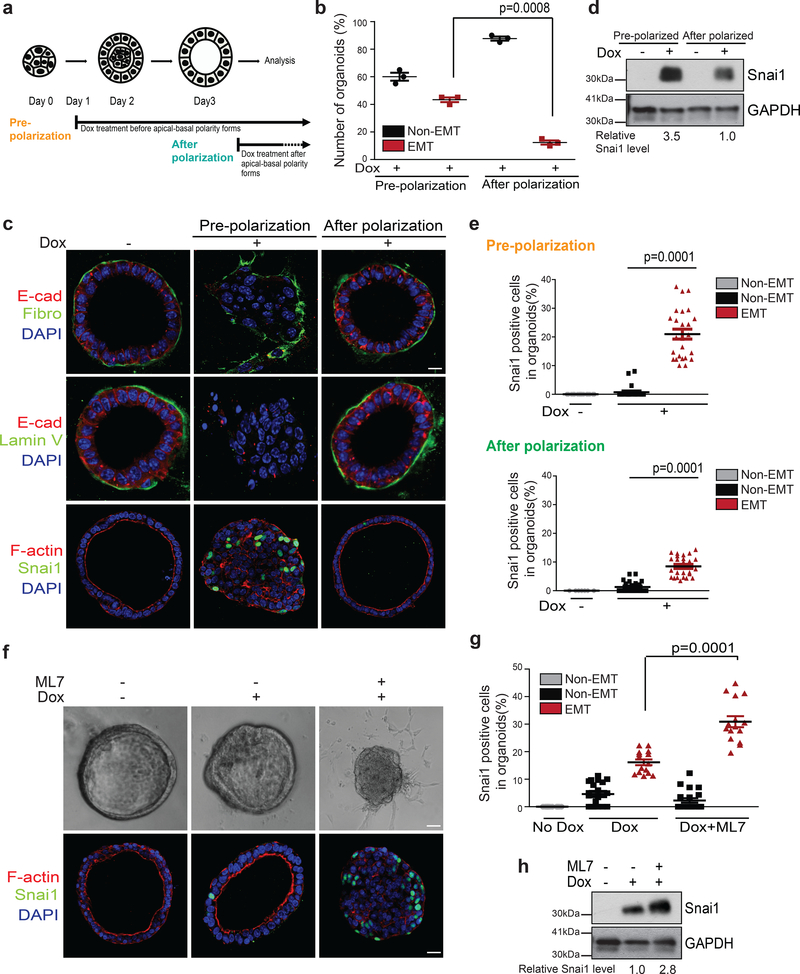
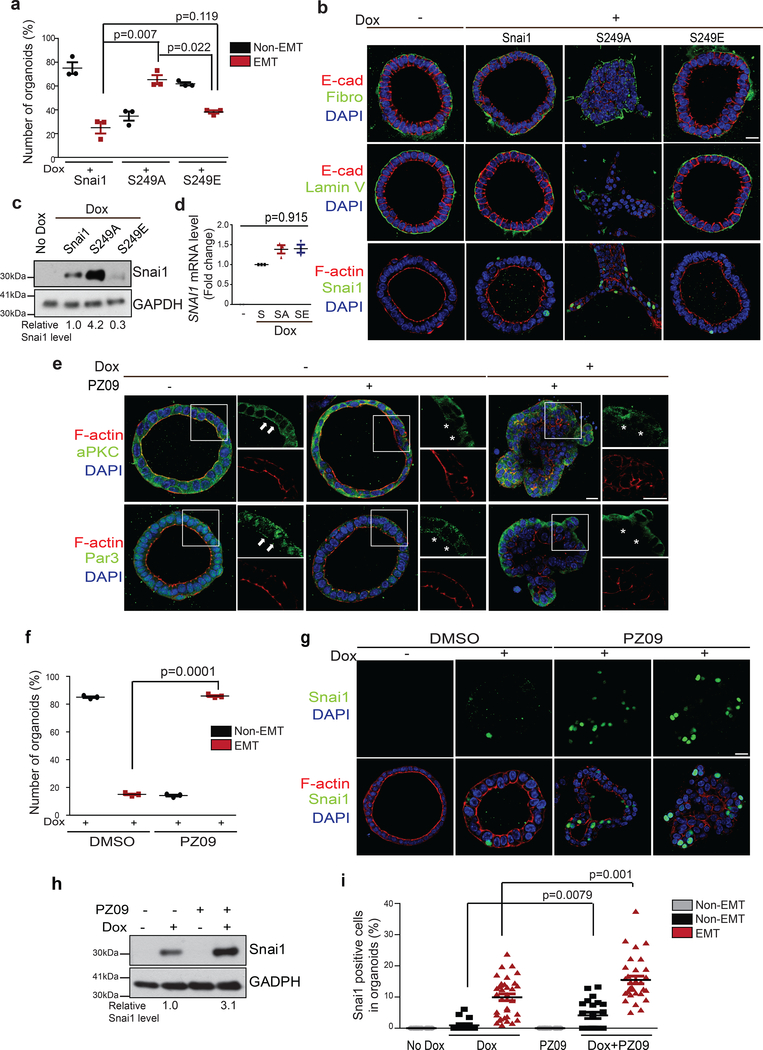
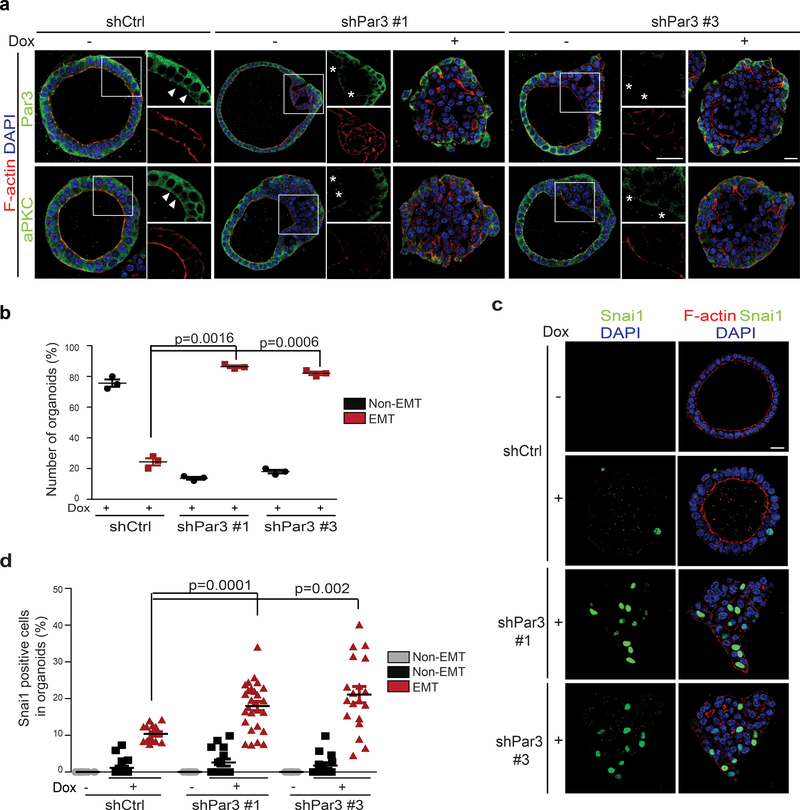
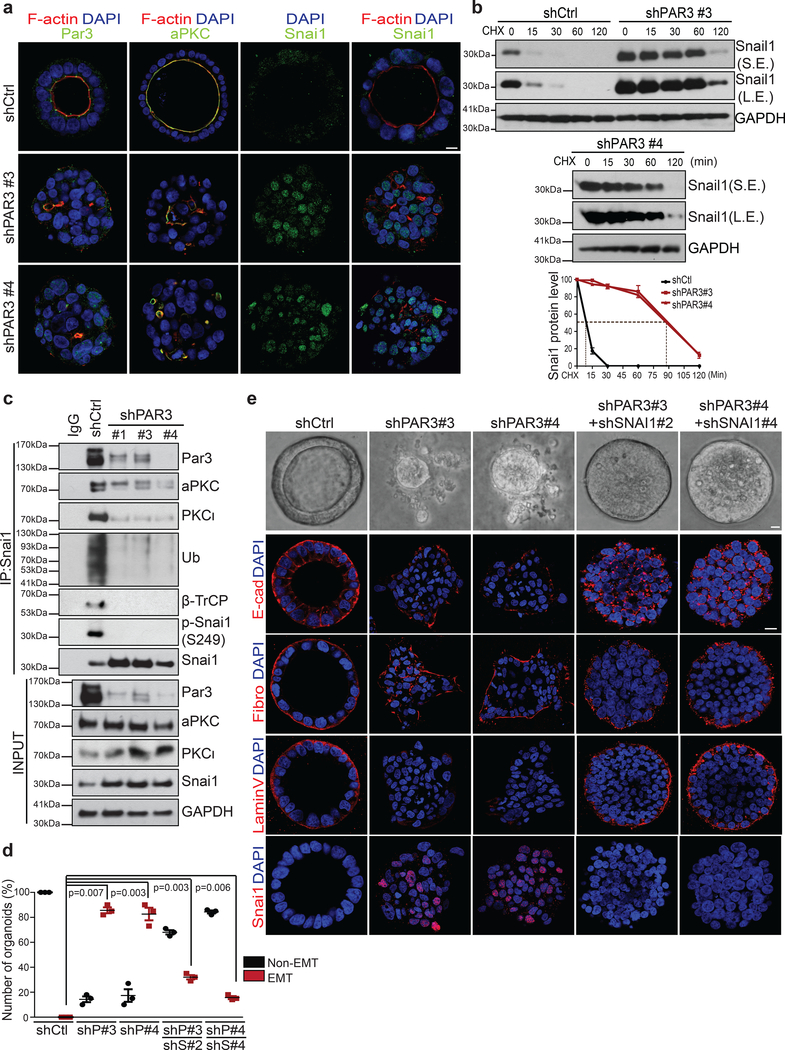
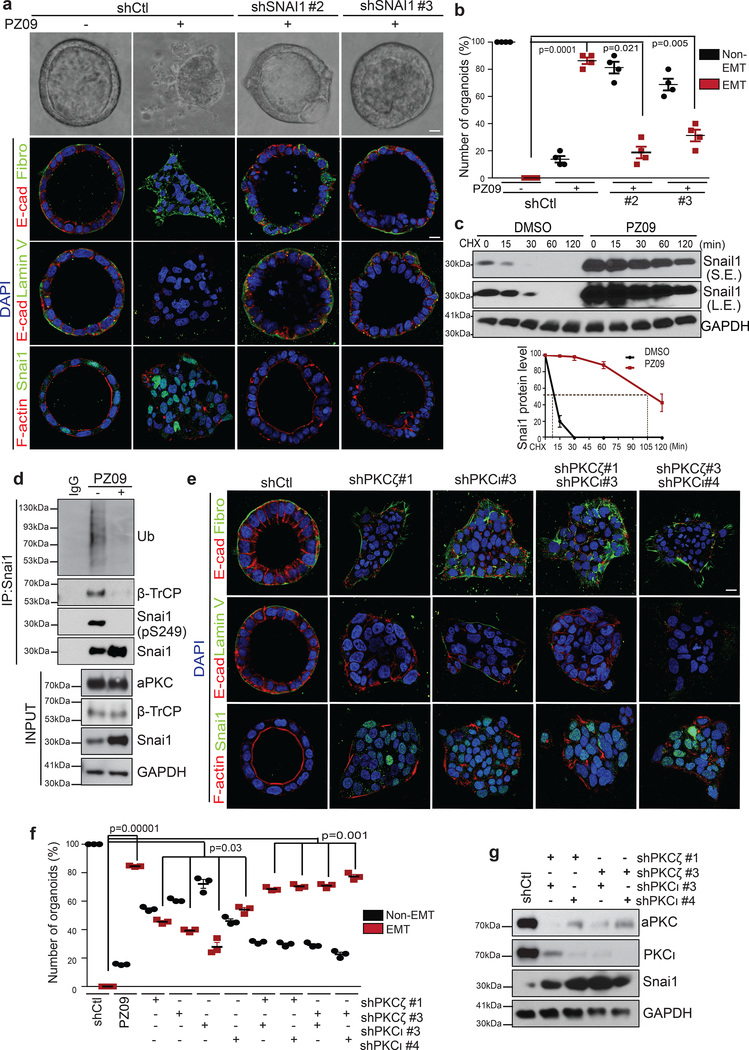
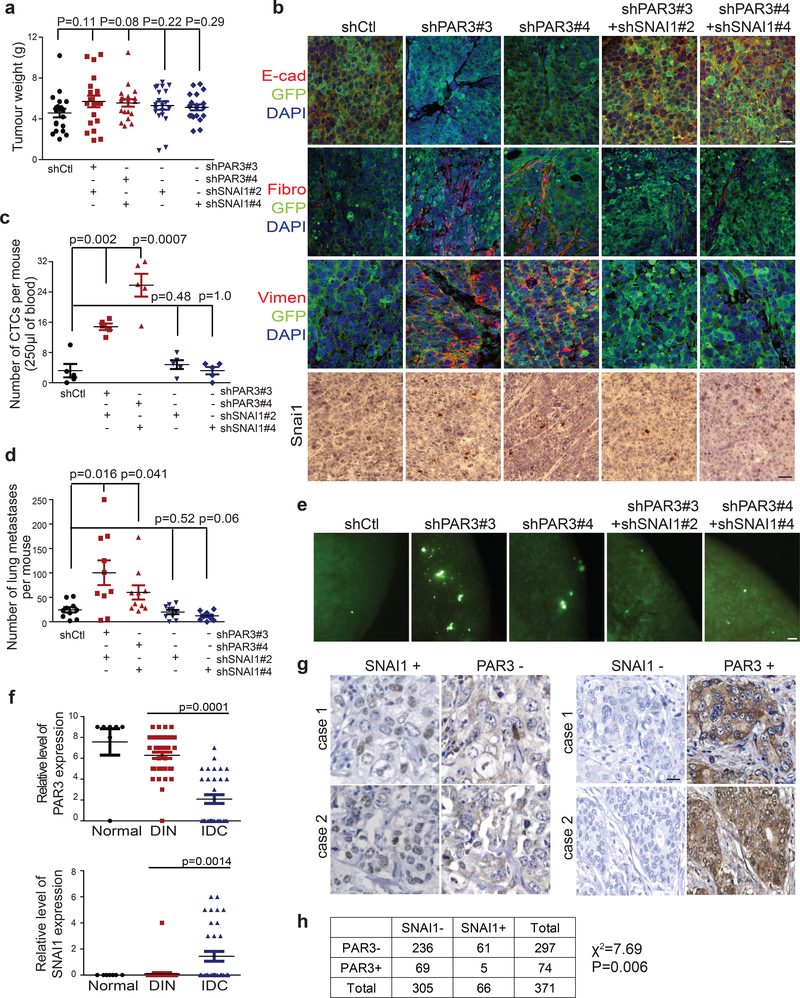
Loss of apical-basal polarity and activation of epithelial-mesenchymal transition (EMT) both contribute to carcinoma progression and metastasis. Here, we report that apical-basal polarity inhibits EMT to suppress metastatic dissemination. Using mouse and human epithelial three-dimensional organoid cultures, we show that the PAR-atypical protein kinase C (aPKC) polarity complex inhibits EMT and invasion by promoting degradation of the SNAIL family protein SNAI1. Under intact apical-basal polarity, aPKC kinases phosphorylate S249 of SNAI1, which leads to protein degradation. Loss of apical-basal polarity prevents aPKC-mediated SNAI1 phosphorylation and stabilizes the SNAI1 protein to promote EMT and invasion. In human breast tumour xenografts, inhibition of the PAR-complex-mediated SNAI1 degradation mechanism promotes tumour invasion and metastasis. Analyses of human breast tissue samples reveal negative correlations between PAR3 and SNAI1 protein levels. Our results demonstrate that apical-basal polarity functions as a critical checkpoint of EMT to precisely control epithelial-mesenchymal plasticity during tumour metastasis.


Conflict of interest statement

COMPETING FINANCIAL INTERESTS

The authors declare no financial and non-financial competing interests.

Figures

Figure 1.
Figure 1.
SNAI1 protein is unstable and fails to induce EMT in MEOs with intact apical-basal polarity. (a) The experimental scheme for isolating and culturing primary mouse epithelial organoids (MEOs). Immunofluorescence images for CK8 (cytokeratin 8), CK5 (cytokeratin 5), E-cadherin (E-cad), and F-actin in MEOs after 4 days of cultures. Scale bar, 25μm. (b) Bright-field images (top) and immunofluorescence images for E-cadherin and Fibronectin (Fibro) (bottom) in TetON-SNAI1 3D MEOs and 2D MECs cultures before and after doxycycline treatment for 4 days. Scale bar, 25μm. (c) qPCR analysis of relative SNAI1 mRNA levels normalized to GAPDH in TetON-SNAI1 MECs and MEOs before and after doxycycline induction. n=3 independent experiments, error bars represent standard deviation; unpaired two-tailed t-test with Welch’s correction. (d) Immunoblots for SNAI1 and GAPDH in lysate from TetON-SNAI1 MECs and MEOs before and after 4 days of doxycycline treatment. The values indicate relative signal intensities of SNAI1/GAPDH. (e) Immunofluorescence images for SNAI1 in TetON-SNAI1 MEOs and MECs before and after 4 days of doxycycline induction. Scale bar, 25μm. (f) TetON-SNAI1 MECs and MEOs were treated with doxycycline for 4 days and then treated with 10μM cycloheximide (CHX) following the time points indicated and analysed for SNAI1 and GAPDH by immunoblotting. S.E. indicates short exposure, L.E. indicates long exposure. The graph represents the quantification of relative SNAI1 proteins levels vs. GAPDH. n=3 independent experiments, error bars represent standard deviation. (g) TetON-SNAI1 MECs and MEOs were treated with doxycycline for 4 days and then treated with 10μM MG132 for 4hrs and analysed for SNAI1 and GAPDH by immunoblotting. The values indicate the relative signal intensity of SNAI1/GAPDH. All immunofluorescence images and Western Blots shown represent one out of three independent experiments. Source data for graphs can be found in Supplementary Table 3 and unprocessed blots in Supplementary Figure 7.
Figure 2.
Figure 2.
Disruption of apical-basal polarity increases SNAI1 protein stability in MEOs. (a) The experimental scheme for inducing SNAI1 in organoids before polarization and after polarization. (b) Quantification of the percentage of MEOs undergoing EMT under pre-polarization and after polarization conditions. n=3 independent experiments with 50 organoids/condition in each experiment, unpaired two-tailed t-test with Welch’s correction. Error bars represent standard deviation. (c) Immunofluorescence images for E-cadherin, Fibronectin, Laminin V (Lamin V), SNAI1 and F-actin in TetON-SNAI1 MEOs under pre-polarization and after polarization conditions as indicated. Scale bar, 25μm. (d) Immunoblot for SNAI1 and GAPDH from TetON-SNAI1 MEOs under pre-polarization and after polarization conditions as indicated. Values indicate relative signal intensities of SNAI1/GAPDH. (e) Quantification of the percentages of SNAI1-positive cells in TetON-SNAI1 MEOs under pre-polarization (Dox-; n=20 cells, Dox+; n=25 cells) and after polarization (Dox-; n= 20 cells, Dox+ non-EMT; n=25 cells, Dox+ EMT; n=20 cells), conditions as indicated. Data represent one out of three independent experiments. Unpaired two-tailed t-test with Welch’s correction. (f) Bright-field images (top) and immunofluorescence images for SNAI1 and F-actin (bottom) of TetON-SNAI1 MEOs treated with doxycycline and 10μM ML7 for 4 days. Scale bar, 25μm. (g) Quantification of the percentages of SNAI1-positive cells in non-EMT and EMT TetON-SNAI1 MEOs under different treatment conditions as indicated. (Dox-; n=20 cells, Dox+ non-EMT; n=20 cells, Dox+EMT; n=15 cells, Dox+ML7 non-EMT; n=20 cells, Dox+ML7 EMT; n=15 cells). Data represent one out of three independent experiments. Unpaired two-tailed t-test with Welch’s correction. (h) Immunoblot for SNAI1 and GAPDH from TetON-SNAI1 MEOs under different treatment conditions as indicated. The values indicate relative signal intensities of SNAI1/GAPDH. All immunofluorescence images and Western Blots shown represent one out of three independent experiments. Source data for graphs can be found in Supplementary Table 3 and unprocessed blots in Supplementary Figure 7.
Figure 3.
Figure 3.
Phosphorylation of Serine 249 on SNAI1 promotes SNAI1 degradation. (a) Alignment of the putative aPKC phosphorylation site in SNAI1 homologs. The alignment was generated by Clustal Omega. (b) Immunoblot for SNAI1 and GAPDH in MCF10A cells expressing wild-type, phospho-deficient S249A SNAI1 mutant, and phospho-mimetic S249E SNAI1 mutant. Values indicate relative signal intensity of SNAI1/GAPDH. Three independent experiments. (c) qPCR analysis of relative SNAI1 mRNA levels normalized to GAPDH in MCF10A cells expressing wild-type, phospho-deficient S249A SNAI1 mutant, and phospho-mimetic S249E SNAI1 mutant. n=3 independent experiments, error bars represent standard deviation, unpaired two-tailed t-test with Welch’s correction. (d) MCF10A cells expressing indicated SNAI1 constructs were treated with 10μM cycloheximide (CHX) following the time points indicated and analysed for SNAI1 and GAPDH by immunoblotting. The graph represents the quantification of relative SNAI1 proteins levels. n=3 independent experiments, error bars represent standard deviation. (e) MCF10A cells expressing indicated SNAI1 constructs were treated with 10μM MG132 for 4hrs and analysed for SNAI1 protein levels by immunoblotting. Values indicate relative signal intensities of SNAI1/GAPDH. (f) qPCR analysis of relative SNAI1 mRNA levels normalized to GAPDH in MCF10A cells expressing indicated SNAI1 constructs in the presence of MG132. n=3 independent experiments, error bars represent standard deviation, paired two-tailed t-test. (g) SNAI1 proteins were immunoprecipitated from MCF10A cells expressing indicated SNAI1 constructs with or without MG132 treatment and probed for SNAI1 and Ubiquitin. (h) in vitro kinase assay for phospho-SNAI1(S249) with purified WT and S249A SNAI1, and aPKC with or without PZ09 treatment. (i) 293T cells overexpressing SNAI1, aPKC and β-TrCP in the indicated combination were treated with 5uM PZ09 or DMSO. SNAI1 proteins were immunoprecipitated from 293T cells and probed for Ub, phospho-SNAI1(S249), SNAI1, and GAPDH. All immunofluorescence images and Western Blots shown represent one out of three independent experiments. Source data for graphs can be found in Supplementary Table 3 and unprocessed blots in Supplementary Figure 7.
Figure 4.
Figure 4.
Inhibition of aPKC promotes SNAI1 protein stability and synergizes with SNAI1 induction to promote EMT in MEOs. (a) Quantification of the percentage of non-EMT and EMT MEOs expressing TetON-SNAI1 WT and mutants. n=3 independent experiments with 50 organoids/condition in each experiment, unpaired two-tailed t-test with Welch’s correction. Error bars represent standard deviation. (b) Immunofluorescence images for E-cadherin, Fibronectin, Laminin V, SNAI1 and F-actin in MEOs expressing TetON-SNAI1 WT and mutants. Scale bars, 25μm. (c) Immunoblot for SNAI1 and GAPDH in MEOs expressing TetON-SNAI1 WT and mutants. Values indicate relative signal intensities of SNAI1/GAPDH. (d) qPCR analysis of relative SNAI1 mRNA levels normalized to GAPDH in MEOs expressing TetON-SNAI1 WT and mutants. unpaired two-tailed t-test with Welch’s correction. Error bars represent standard deviation. (e) Immunofluorescence images for aPKC, Par3 and F-actin in TetON-SNAI1 MEOs under different treatment conditions as indicated. Arrowheads point to the presence of aPKC and F-actin at the apical membrane and Par3 at the apical/lateral region. Stars mark the loss of these proteins at the corresponding areas. Scale bars, 25μm and 50μm. (f) Quantification of the percentage of non-ENT and EMT TetON-SNAI1 MEOs in response to PZ09 treatment. n=3 independent experiments with 50 organoids/condition in each experiment, unpaired two-tailed t-test with Welch’s correction. Error bars represent standard deviation. (g) Immunofluorescence images for SNAI1 and F-actin in TetON-SNAI1 MEOs in response to PZ09 treatment. Scale bar, 25μm. (h) Immunoblot for SNAI1 and GAPDH in TetON-SNAI1 MEOs in response to PZ09 treatment. Values indicate relative signal intensities of SNAI1/GAPDH. (i) Quantification of the percentage of SNAI1-positive cells in non-EMT and EMT TetON-SNAI1 MEOs in response to PZ09 treatment. Dox-; n=20 cells, Dox+ non-EMT; n=15 cells,, PZ09; n=20 cells, Dox+ PZ09 non-EMT; n=22 cells, Dox+PZ09 EMT; n=32 cells. Error bars represent standard deviation. Unpaired two-tailed t-test with Welch’s correction. All immunofluorescence images and Western Blots shown represent one out of three independent experiments. Source data for graphs can be found in Supplementary Table 3 and unprocessed blots in Supplementary Figure 7.
Figure 5.
Figure 5.
Knockdown of Par3 promotes SNAI1 protein stability and induces EMT in MEOs. (a) Representative immunofluorescence images for Par3, aPKC, and F-actin in TetON-SNAI1 MEOs expressing control shRFP or shPar3#1 and #3. Arrowheads point to the presence of aPKC at the apical membrane and Par3 at the apical/lateral region. Stars mark the loss of these proteins at the corresponding areas. Scale bars, 25μm and 50μm. Three independent experiments. (b) Quantification of the percentage of non-EMT and EMT TetON-SNAI1 MEOs expressing shRFP or shPar3#1 and #3. n=3 independent experiments with 50 organoids/condition in each experiment, unpaired two-tailed t-test with Welch’s correction. Error bars represent standard deviation. (c) Immunofluorescence images for SNAI1 and F-actin in TetON-SNAI1 MEOs expressing shRFP or shPar3#1 and #3 before and after doxycycline treatment. Scale bars, 25μm. Three independent experiments. (d) Quantification of the percentage of SNAI1-positive cells in non-EMT and EMT TetON-SNAI1 MEOs expressing shRFP or shPar3#1 and #3 before and after doxycycline treatment. n values from left to right: 20, 20, 15, 20, 15, 27, 20, 15 and 19 cells, respectively. Data represent one out of three independent experiments Unpaired two-tailed t-test with Welch’s correction. Error bars represent standard deviation. All immunofluorescence images represent one out of three independent experiments. Source data for graphs can be found in Supplementary Table 3.
Figure 6.
Figure 6.
Loss of PAR3 stabilizes endogenous SNAI1 protein and induced EMT in 3D Caco2 organoids. (a) Immunofluorescence images for PAR3, aPKC, SNAI1 and F-actin in Caco2 organoids expressing shRFP or shPAR3#3 and #4. Scale bar, 25μm. (b) Caco2 organoids expressing shRFP, shPAR3#3 and #4 were treated with 10μM cycloheximide (CHX) following the time points indicated and analysed for SNAI1 and GAPDH by immunoblotting. S.E. indicates short exposure, L.E. indicates long exposure. The graph represents the quantification of relative SNAI1 proteins levels vs. GAPDH. n=3 independent experiments, error bars represent standard deviation. (c) Endogenous SNAI1 proteins were immunoprecipitated from Caco2 organoids expressing shRFP or shPAR3#1, #3, and #4 and probed for PAR3, aPKC, PKCι, Ubiquitin (Ub), β-TrCP, phospho-SNAI1 (S249) and SNAI1. Immunoblot for PAR3, aPKC, PKCι, SNAI1, and GAPDH in Caco2 organoids expressing shRFP or shPAR3#1, #3, and #4. (d) Quantification of the percentage of non-EMT and EMT TetON-SNAI1 MEOs expressing indicated shRNA constructs. n=50 organoids/condition in each experiment, data from three independent experiments are represented, paired two-tailed t-test, Error bars represent standard deviation. (e) Representative bright-field images (top) and immunofluorescence images for GFP, E-cadherin, Fibronectin, Laminin V, and SNAI1 (bottom) of Caco2 organoids expressing the indicated shRNA constructs. Scale bar, 25μm.
Figure 7.
Figure 7.
Suppression of aPKCs increases endogenous SNAI1 stability and promotes EMT in 3D Caco2 organoids. (a) Representative immunofluorescence images for E-cadherin, Fibronectin, Laminin V, SNAI1 and F-actin in Caco2 organoids expressing shRFP or shSNAI1 #2, and shSNAI1 #3 with or without PZ09 treatment. Scale bar, 25μm. Three independent experiments. (b) Quantification of the percentage of non-ENT and EMT Caco2 organoids expressing shRFP or shSNAI1 #2 and #3 with or without PZ09 treatment. n=3 independent experiments with 50 organoids/condition in each experiment paired two-tailed t-test Error bars represent standard deviation. (c) Caco2 organoids were treated with DMSO or PZ09 and then treated with 10μM cycloheximide (CHX) following the time points indicated and analysed for SNAI1 and GAPDH by immunoblotting. S.E. indicates short exposure, L.E. indicates long exposure. The graph represents the quantification of relative SNAI1 proteins levels vs. GAPDH. n=3 independent experiments, error bars represent standard deviation. (d) Endogenous SNAI1 proteins were immunoprecipitated from Caco2 organoids with or without PZ09 treatment and probed for Ubiquitin (Ub), β-TrCP, phospho-SNAI1(S249) and SNAI1. Immunoblot for aPKC, β-TrCP, SNAI1, and GAPDH in Caco2 organoids with or without PZ09 treatment. (e) Representative immunofluorescence images for E-cadherin, Fibronectin, Laminin V, SNAI1 and F-actin in Caco2 organoids expressing the indicated shRNA constructs. Scale bar, 25μm. (f) Quantification of the percentage of non-EMT and EMT Caco2 organoids expressing the indicated shRNA constructs. n=3 independent experiments with50 organoids/condition in each experiment, paired two-tailed t-test, error bars represent standard deviation. (g) Immunoblot for aPKC, PKCι, SNAI1 and GAPDH in lysate from Caco2 organoids expressing the indicated shRNA constructs. All immunofluorescence images and Western Blots shown represent one out of three independent experiments. Source data for graphs can be found in Supplementary Table 3 and unprocessed blots in Supplementary Figure 7.
Figure 8.
Figure 8.
The epithelial polarity-regulated SNAI1 degradation mechanism impacts tumour invasion and metastasis in vivo and is associated with human breast cancer progression. (a) Primary tumour weight of GFP-tagged Caco2 xenograft tumours expressing shRFP, shPAR3, and shPAR3-shSNAI1 after subcutaneous injection for 6 weeks. n=20 tumours per group, unpaired two-tailed t-test with Welch’s correction, Error bars represent standard deviation. (b) Immunofluorescence images for GFP, E-cadherin, and human Vimentin (Vim), and immunohistochemistry images for SNAI1 in Caco2 xenograft tumours expressing shRFP, shPAR3 and shPAR3-shSNAI1. Scale bars, 50μm for SNAI1 staining and 25μm for all other markers. (c) Quantification of the number of circulating tumour cells (CTCs) isolated from mice carrying Caco2 tumours expressing shRFP, shPAR3 and shPAR3-shSNAI1. n=10 mice per group, unpaired two-tailed t-test with Welch’s correction, Error bars represent standard deviation. (d) Quantification of GFP-positive metastatic events in the lung of mice carrying Caco2 tumours expressing shRFP, shPAR3 and shPAR3-shSNAI1. n=10 mice per group, unpaired two-tailed t-test with Welch’s correction Error bars represent standard deviation (e) Fluorescent images of GFP-positive metastatic lesions in the lung of mice carrying Caco2 tumours expressing shRFP, shPAR3 and shPAR3-shSNAI1. GFP signal indicates disseminated tumour cells in the lung. Scale bars, 100μm. (f) Quantification of the relative PAR3, and SNAI1 signals in human breast tumour tissue samples (n=48 patients, two sections from each patient were analysed). Unpaired two-tailed t-test with Welch’s correction, Error bars represent standard deviation. (g) Representative immunohisto-chemistry images for SNAI1 and PAR3 in human breast tumour samples. Scale bars, 25μm. (h) Correlation analysis of SNAI1 and PAR3 in human stage-2 breast tumour tissue microarray. All data panels represent one out of three independent experiments. Source data for graphs can be found in Supplementary Table 3.

Comment in

  • Epithelial polarity limits EMT.
    Persa OD, Niessen CM. Persa OD, et al. Nat Cell Biol. 2019 Mar;21(3):299-300. doi: 10.1038/s41556-019-0284-7. Nat Cell Biol. 2019. PMID: 30824839 No abstract available.

Similar articles

Cited by

References

    1. Royer C & Lu X Epithelial cell polarity: a major gatekeeper against cancer? Cell Death Differ 18, 1470–1477 (2011). - PMC - PubMed
    1. Zen K et al. Defective expression of polarity protein PAR-3 gene (PARD3) in esophageal squamous cell carcinoma. Oncogene 28, 2910–2918 (2009). - PubMed
    1. Assemat E, Bazellieres E, Pallesi-Pocachard E, Le Bivic A & Massey-Harroche D Polarity complex proteins. Biochim Biophys Acta 1778, 614–630 (2008). - PubMed
    1. Lee M & Vasioukhin V Cell polarity and cancer--cell and tissue polarity as a non-canonical tumor suppressor. J Cell Sci 121, 1141–1150 (2008). - PubMed
    1. Ngok SP, Lin WH & Anastasiadis PZ Establishment of epithelial polarity--GEF who’s minding the GAP? J Cell Sci 127, 3205–3215 (2014). - PMC - PubMed

Publication types

MeSH terms