. 2019 May;18(5):510-517.
doi: 10.1038/s41563-019-0292-9. Epub 2019 Feb 25.

Bioinspired neuron-like electronics

Affiliations

Bioinspired neuron-like electronics

Xiao Yang et al. Nat Mater. 2019 May.

Abstract

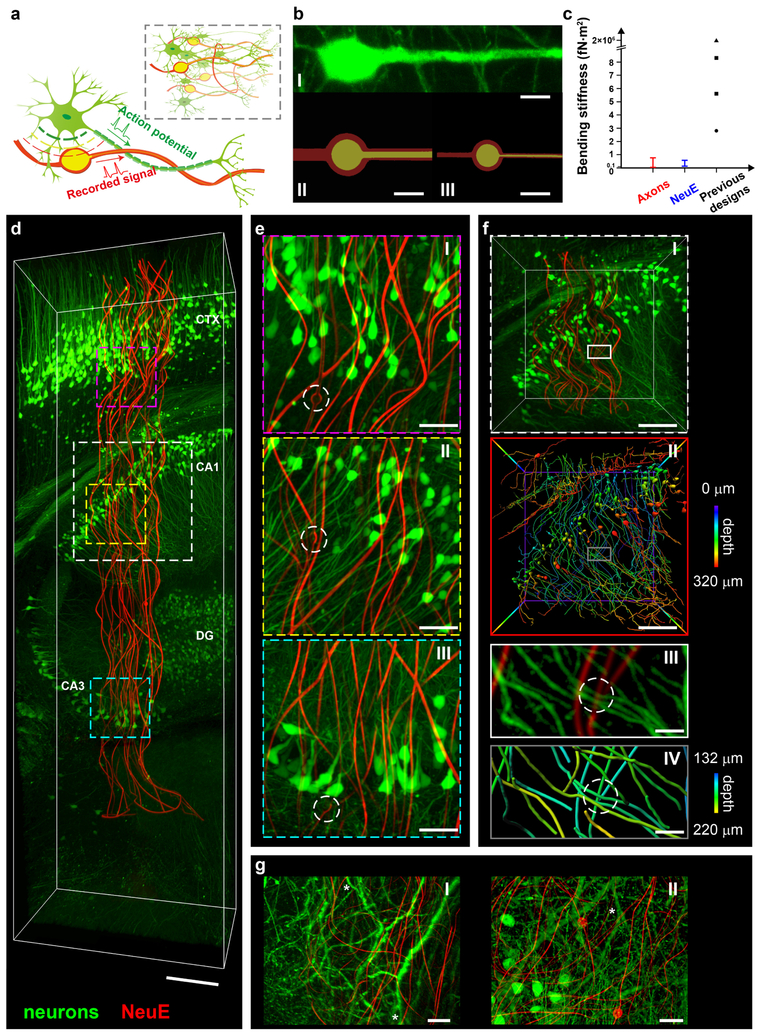
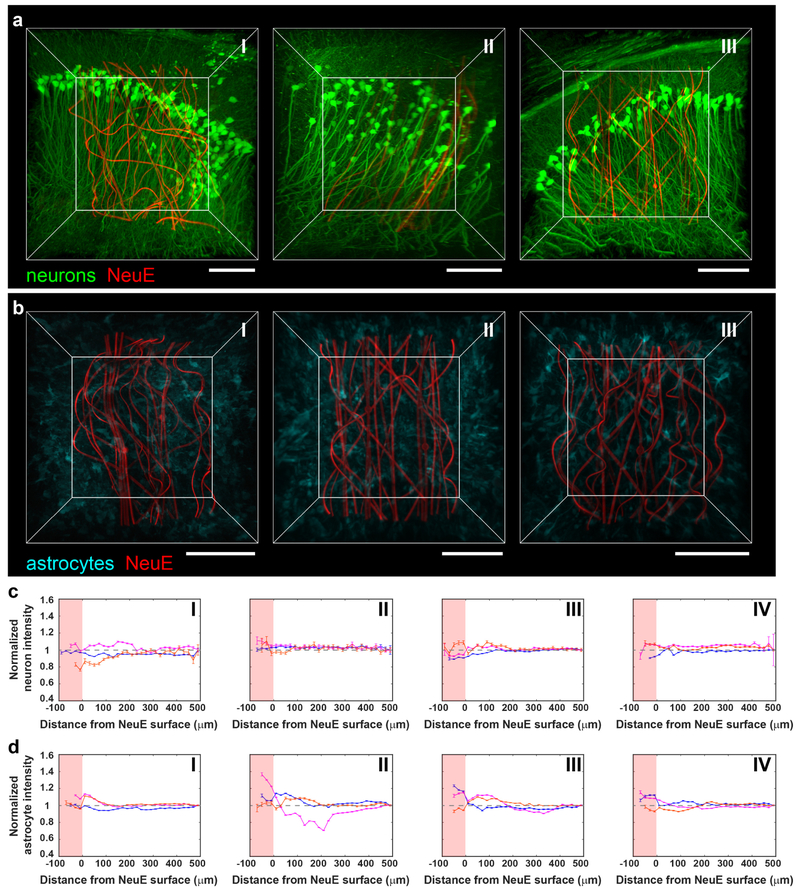
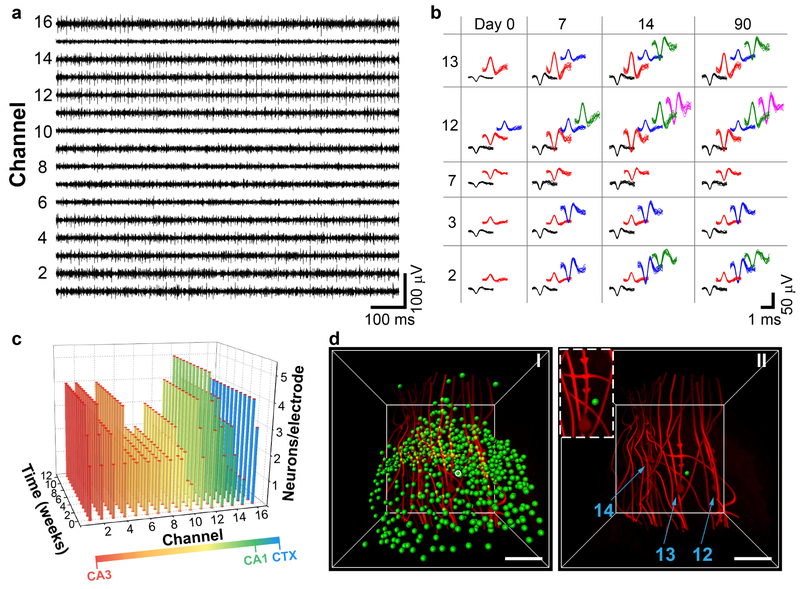
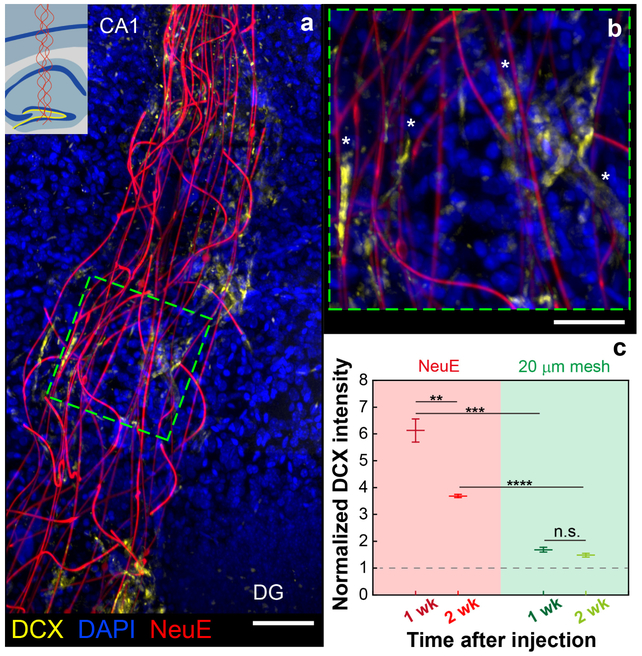
As an important application of functional biomaterials, neural probes have contributed substantially to studying the brain. Bioinspired and biomimetic strategies have begun to be applied to the development of neural probes, although these and previous generations of probes have had structural and mechanical dissimilarities from their neuron targets that lead to neuronal loss, neuroinflammatory responses and measurement instabilities. Here, we present a bioinspired design for neural probes-neuron-like electronics (NeuE)-where the key building blocks mimic the subcellular structural features and mechanical properties of neurons. Full three-dimensional mapping of implanted NeuE-brain interfaces highlights the structural indistinguishability and intimate interpenetration of NeuE and neurons. Time-dependent histology and electrophysiology studies further reveal a structurally and functionally stable interface with the neuronal and glial networks shortly following implantation, thus opening opportunities for next-generation brain-machine interfaces. Finally, the NeuE subcellular structural features are shown to facilitate migration of endogenous neural progenitor cells, thus holding promise as an electrically active platform for transplantation-free regenerative medicine.


Conflict of interest statement

Competing interests

The authors declare no competing interests.

Figures

Fig. 1 |
Fig. 1 |. Design and characterization of NeuE, and 3D mapping of its neural interface.
a, Schematics showing the structural similarity between NeuE and neurons from the subcellular level to the network level (inset). Neurons, green; electrodes and interconnects, yellow; polymer layers, red. b, Fluorescence microscope image of a neuron (I) and false-colored scanning electron microscope (SEM) images of two NeuE designs (II and III). Raw SEM images are shown in Supplementary Fig. 2. Scale bars, 10 μm. c, Bending stiffness of axons, NeuE and examples of previously reported state-of-the-art mesh (circle), fiber, (triangle) and thread probes (squares). d, 3D reconstructed interface between neurons (green) and NeuE (red) at 6 weeks post-implantation. Scale bar, 200 μm. 3D mapping was repeated on N=3 independent samples. Additional fluorescence images and quantitative analyses are shown in Supplementary Figs. 6 and 7. e, High-resolution images of the volumes highlighted by magenta (I), yellow (II) and cyan (III) dashed boxes in d. Electrodes are indicated by white dashed circles. Scale bars, 50 μm. f, Close up images of the white dashed box in d. I and II correspond to standard fluorescence and depth-coded images, respectively. III and IV are close-up views indicated by the white and gray boxes in I and II, respectively, highlighting the junction between neurites and the NeuE neurite-like interconnect (white dashed circles). Color codes for depth are shown in the frame in II and the color bars to the right. Scale bars, 100 μm (I and II), 20 μm (III and IV). g, Close-up 3D neural interface of the smaller NeuE (b, III) in additional independent samples near cornu ammonis 1 (CA1) (I) and dentate gyrus (DG) (II) at 2 weeks post-injection. White asterisks indicate dendritic branches. Scale bars, 20 μm.
Fig. 2 |
Fig. 2 |. Time-dependent 3D histology studies of NeuE/brain interfaces.
a, 3D interfaces between NeuE (red) and neurons (green) at 2 days (I), 2 weeks (II) and 3 months (III) post-implantation. Scale bars, 100 μm. b, 3D interfaces between NeuE (red) and astrocytes (cyan) at 2 days (I), 2 weeks (II) and 3 months (III) post-implantation. Scale bars, 100 μm. c,d, Normalized fluorescence intensity of neurons (c) and astrocytes (d) as a function of distance from the 3D NeuE boundary at CTX (orange), hippocampal CA1 (magenta) and DG (blue) at 2 days (I), 2 weeks (II), 6 weeks (III) and 3 months (IV) post-implantation. The pink-shaded regions indicate tissue volumes within the interior of the NeuE. The relative signal was obtained by normalizing the fluorescence intensity with the baseline value defined as the fluorescence intensity averaged over a range of 480–500 μm away (gray dashed horizontal lines; Supplementary Note 4). The tissue volumes for analysis depend on the specific structures of the distinct brain regions as shown in Supplementary Fig. 5a,b. All error bars reflect ±1 s.e.m. There is substantial neuronal density, 91±12% (mean ± s.d.) of baseline, in the interior of the NeuE probe boundary as early as 2 days, and this increases to 100±7% of baseline at times extending from 2 weeks when the neurons exhibit a fully endogenous distribution in the DG, CA1 and CTX regions. The astrocyte density is 107±8% of baseline at 2 and 14 days, and is uniform at the endogenous level, 102±3%, at longer times. Time-dependent 3D histology studies have been repeated on N=3 independent samples; additional fluorescence images and quantitative analyses are shown in Supplementary Figs. 6 and 7.
Fig. 3 |
Fig. 3 |. Functional interrogation with NeuE.
a, Representative 16-channel single-unit spike traces at 7 days post-injection. The x and y axes represent recording time and voltage. b, Time evolution of spikes of principal component analysis clustered single units from five representative channels over 3 months post-injection. For each channel, each distinct color in the sorted spikes represents a unique identified neuron. c, 3D bar chart of the number of distinct neurons recorded per electrode as a function of the time post-injection. Bar colors are coded according to the brain regions as shown in the color bar at the bottom. Larger numbers of isolated neuron signals were recorded in channels located in CA3 and CA1 regions of the HIP, and lower numbers in channels located in the lower density space between CA3 and CA1. Time-dependent electrophysiology studies were repeated on N=3 independent animals. Data and analyses from additional replicates are shown in Supplementary Figs. 18 and 19. d, 3D images of NeuE near the CA1 subfield. Green dots in I indicate the soma of imaged neurons after segmentation. The neuron triangulated by electrodes 12, 13 and 14 is highlighted by a white circle. II shows the relative positioning of the triangulated neuron (green dot) with respect to electrodes 12, 13 and 14 (highlighted by light blue arrows), with an inset highlighting the triangulated neuron. Scale bars, 50 μm. 3D mapping and channel-indexing of all the electrodes (N=16) are shown in Supplementary Fig. 11.
Fig. 4 |
Fig. 4 |. NeuE facilitates migration of NPC-derived newborn neurons.
a, A representative 3D image showing the distribution of DCX+ newborn neurons along NeuE at 1 week post-implantation. Yellow, blue and red colors represent DCX, DAPI and NeuE, respectively. Scale bar, 100 μm. Inset, Schematic showing the injection site, with dark blue, yellow and red colors indicating principal cell body layers, SGZ and NeuE, respectively. b, Magnified view of the green dashed box in a, demonstrating that some DCX+ cells show neurite spreading associated and aligned with the neurite-like NeuE structure (highlighted by white asterisks). Scale bar, 50 μm. c, Normalized DCX intensity at 0–20 μm near the NeuE or 20 μm mesh normalized against baseline values remote to the probe (gray dashed horizontal line; Supplementary Note 4). Each condition was repeated on three independent tissue volumes. Additional data are shown in Supplementary Figs. 20 and 21. All error bars reflect ±1 s.e.m. Top to bottom, P = 5×10⁻³ (**P < 1×10⁻²), P = 6×10⁻⁴ (***P < 1×10⁻³), P = 2×10⁻⁵ (****P < 1×10⁻⁴), P = 1.4×10⁻¹ (NS, not significant, P > 5×10⁻²); two-tailed t-test.

Comment in

  • Neuron-like neural probes.
    Capadona JR, Shoffstall AJ, Pancrazio JJ. Capadona JR, et al. Nat Mater. 2019 May;18(5):429-431. doi: 10.1038/s41563-019-0312-9. Nat Mater. 2019. PMID: 30804508 Free PMC article.

References

    1. Ma X et al. Tuning crystallization pathways through sequence engineering of biomimetic polymers. Nat. Mater 16, 767–774 (2017). - PubMed
    1. Fratzl P, Kolednik O, Fischer FD & Dean MN The mechanics of tessellations – bioinspired strategies for fracture resistance. Chem. Soc. Rev 45, 252–267 (2016). - PubMed
    1. Green JJ & Elisseeff JH Mimicking biological functionality with polymers for biomedical applications. Nature 540, 386–394 (2016). - PMC - PubMed
    1. Sadtler K et al. Design, clinical translation and immunological response of biomaterials in regenerative medicine. Nat. Rev. Mater 1, 16040 (2016).
    1. Chen R, Canales A & Anikeeva P Neural recording and modulation technologies. Nat. Rev. Mater 2, 16093 (2017). - PMC - PubMed

Publication types

MeSH terms

Substances