Clinical Trial
. 2019 Mar;25(3):454-461.
doi: 10.1038/s41591-019-0357-y. Epub 2019 Feb 25.

A single dose of neoadjuvant PD-1 blockade predicts clinical outcomes in resectable melanoma

Affiliations
Clinical Trial

A single dose of neoadjuvant PD-1 blockade predicts clinical outcomes in resectable melanoma

Alexander C Huang et al. Nat Med. 2019 Mar.

Abstract

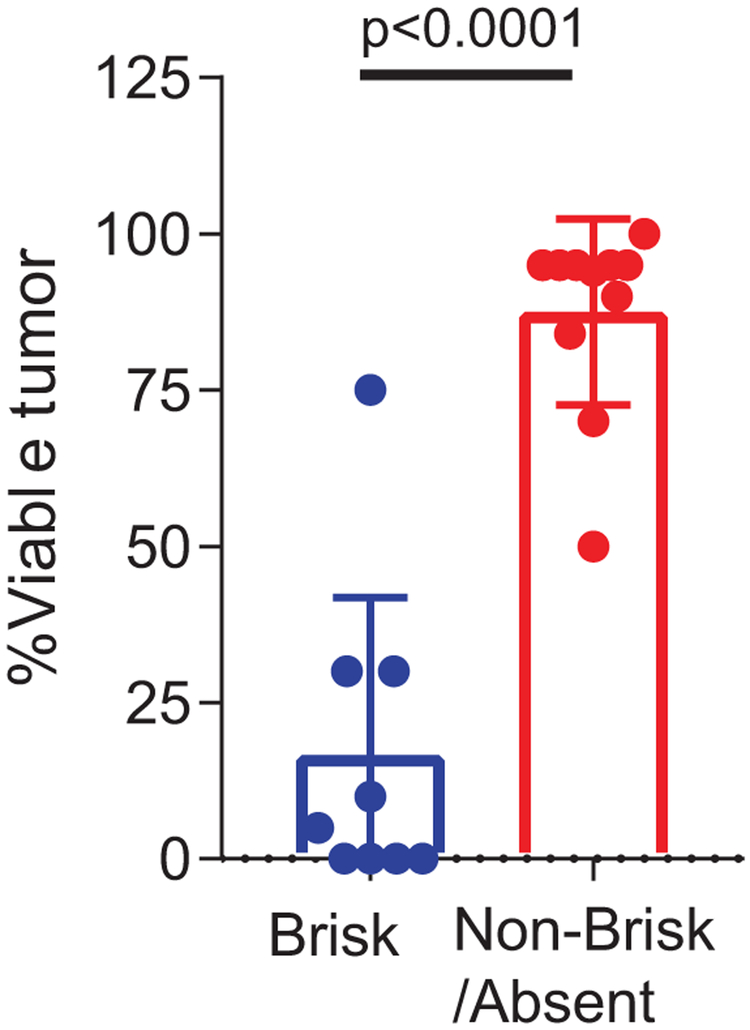
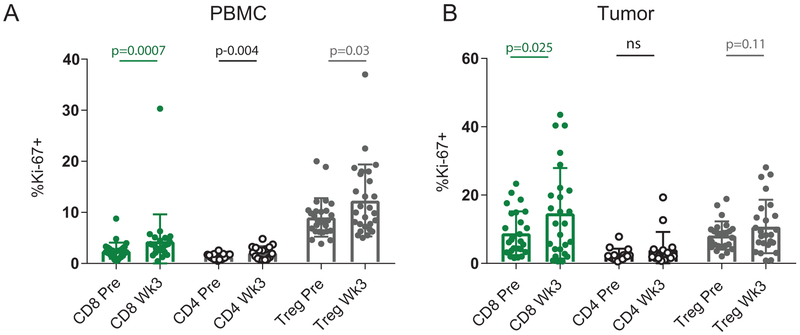
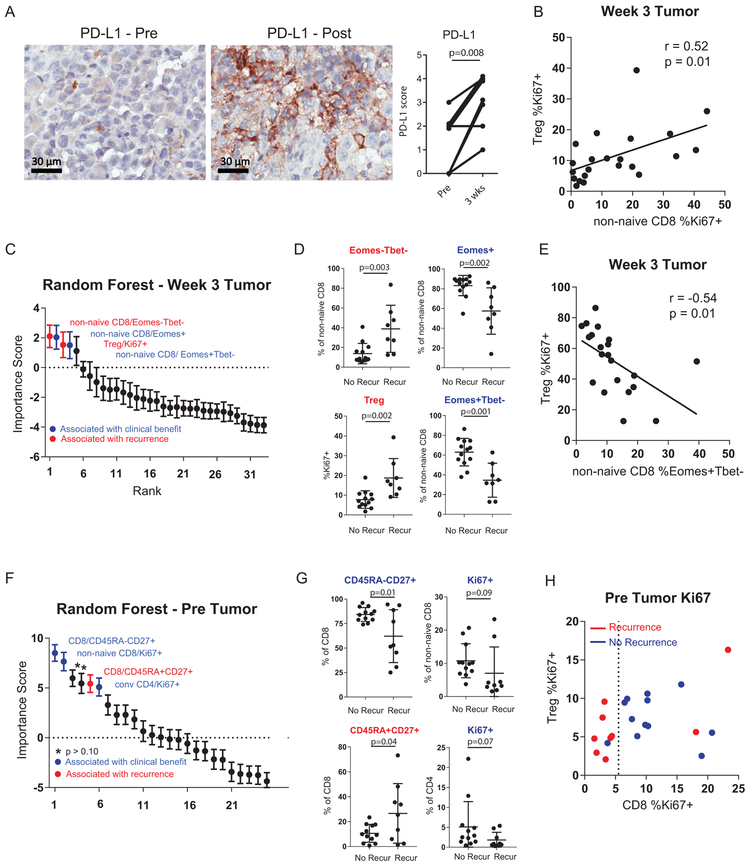
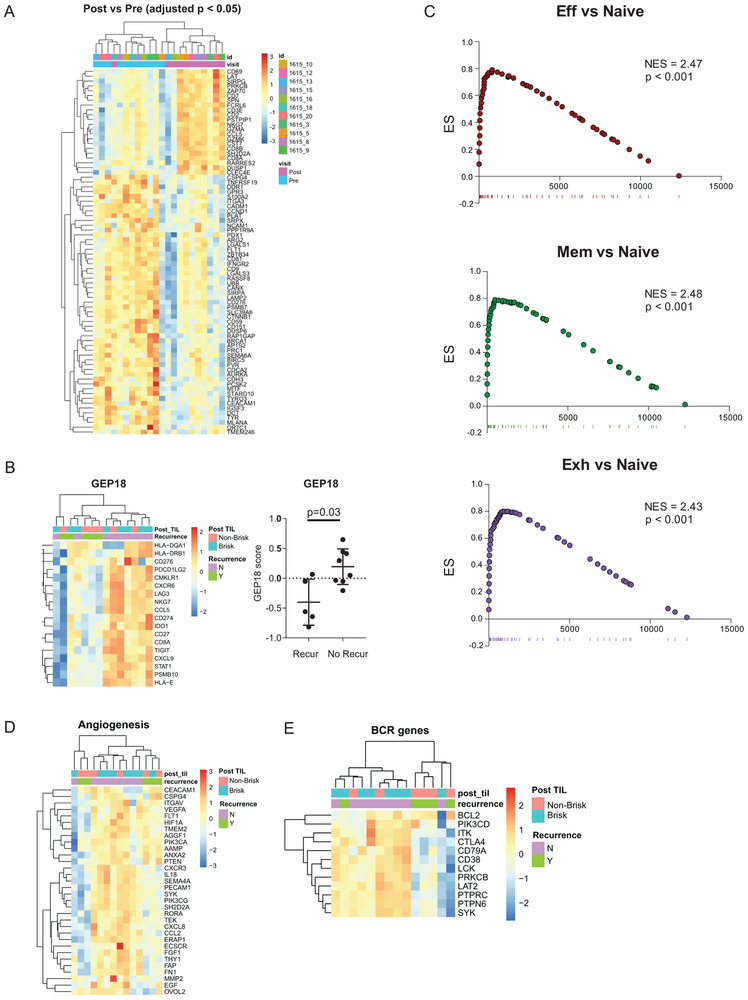
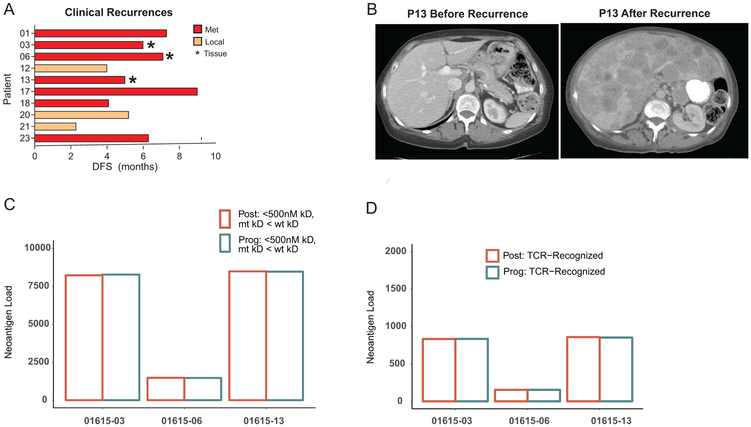
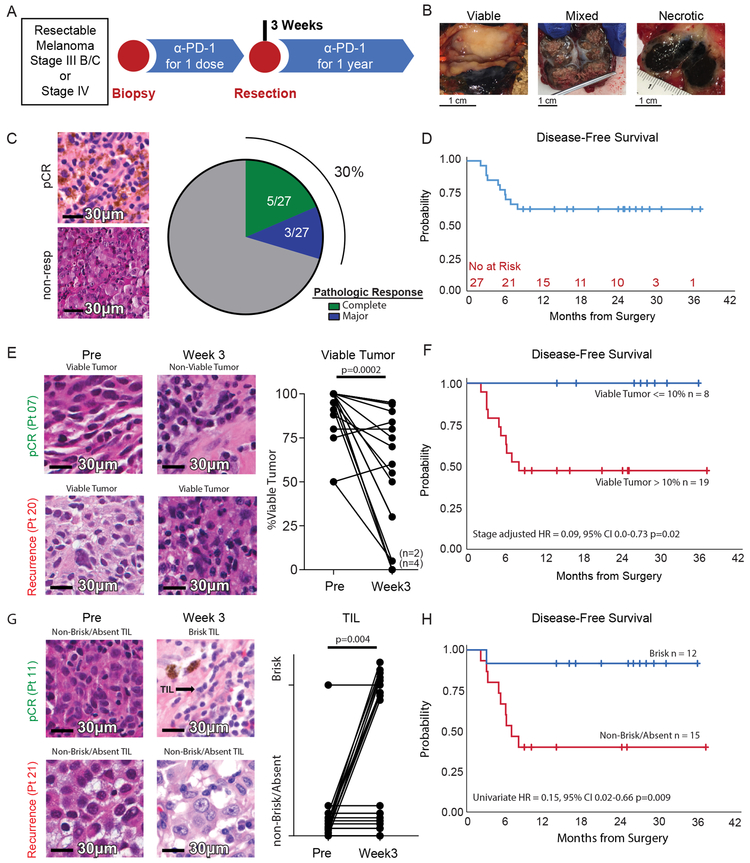
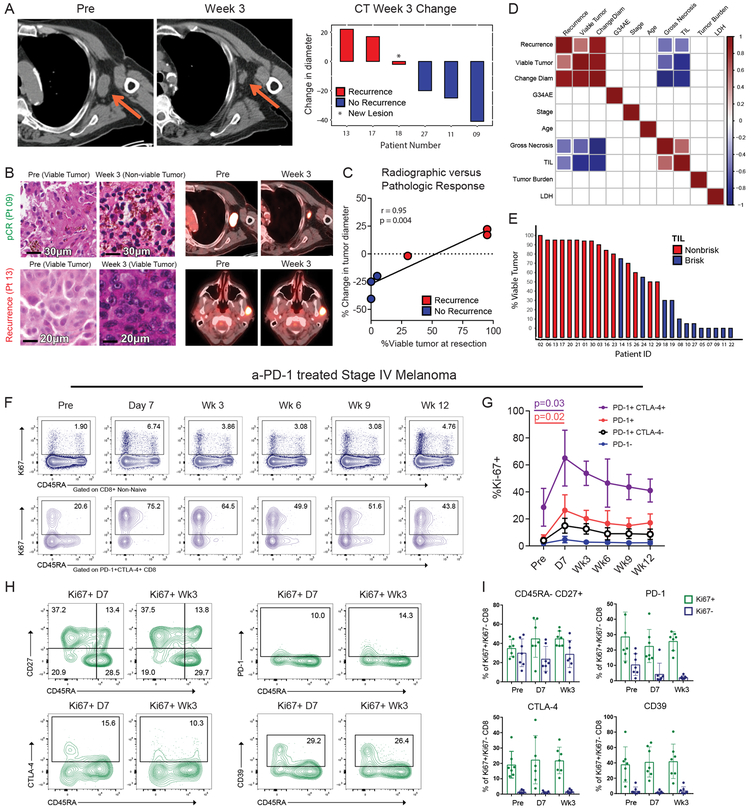
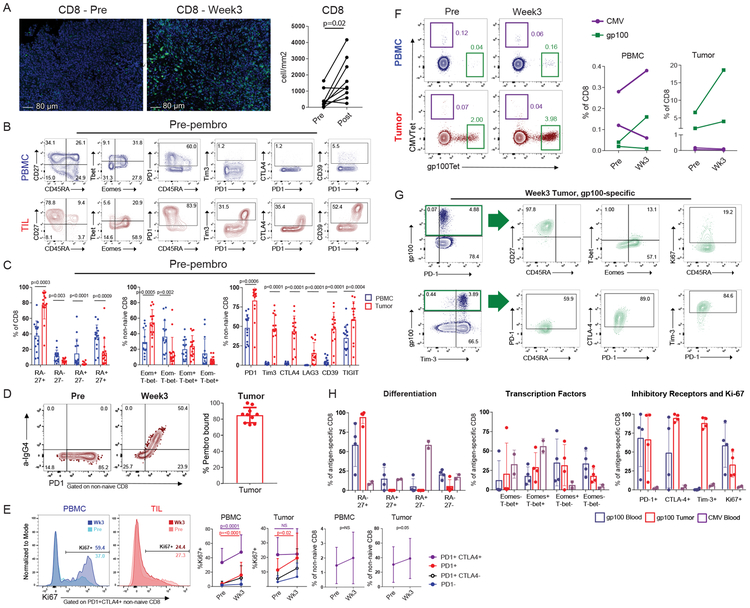
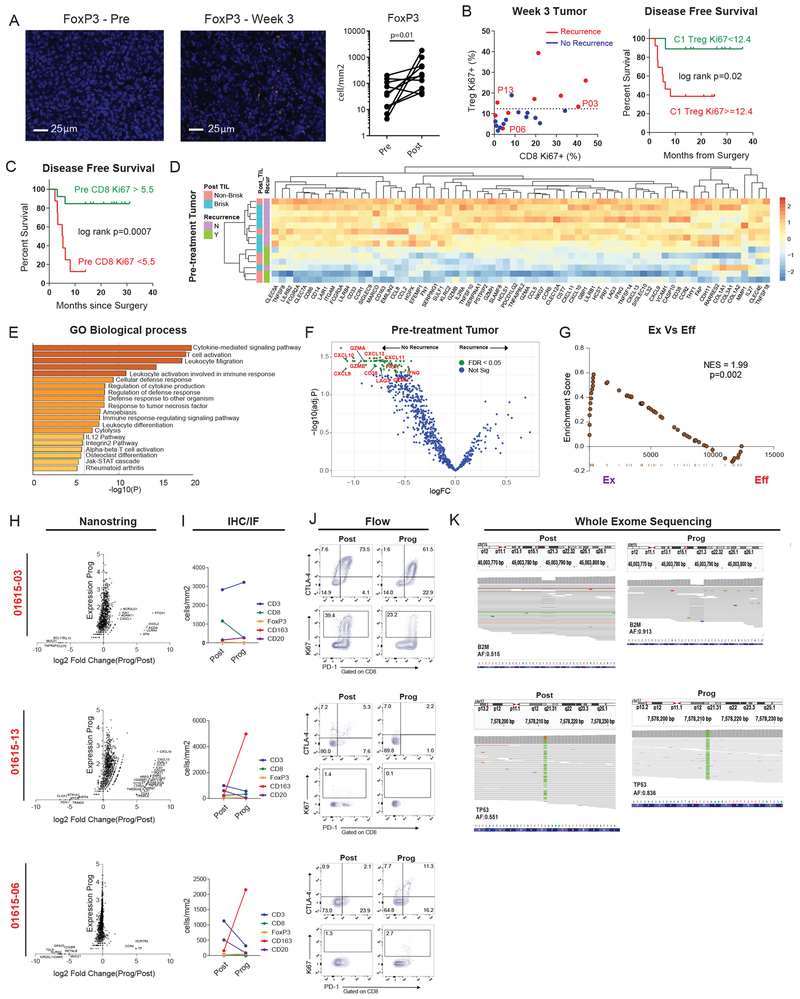
Immunologic responses to anti-PD-1 therapy in melanoma patients occur rapidly with pharmacodynamic T cell responses detectable in blood by 3 weeks. It is unclear, however, whether these early blood-based observations translate to the tumor microenvironment. We conducted a study of neoadjuvant/adjuvant anti-PD-1 therapy in stage III/IV melanoma. We hypothesized that immune reinvigoration in the tumor would be detectable at 3 weeks and that this response would correlate with disease-free survival. We identified a rapid and potent anti-tumor response, with 8 of 27 patients experiencing a complete or major pathological response after a single dose of anti-PD-1, all of whom remain disease free. These rapid pathologic and clinical responses were associated with accumulation of exhausted CD8 T cells in the tumor at 3 weeks, with reinvigoration in the blood observed as early as 1 week. Transcriptional analysis demonstrated a pretreatment immune signature (neoadjuvant response signature) that was associated with clinical benefit. In contrast, patients with disease recurrence displayed mechanisms of resistance including immune suppression, mutational escape, and/or tumor evolution. Neoadjuvant anti-PD-1 treatment is effective in high-risk resectable stage III/IV melanoma. Pathological response and immunological analyses after a single neoadjuvant dose can be used to predict clinical outcome and to dissect underlying mechanisms in checkpoint blockade.


Figures

Extended Data Fig. 1
Extended Data Fig. 1. TIL score associated with pathologic response.
Percent viable tumor between brisk (n = 9) versus non-brisk/absent tumors (n = 11). P value calculated using two-sided Mann Whitney test.
Extended Data Fig. 2
Extended Data Fig. 2. Immune response to anti-PD-1 for T cell subsets in blood and tumor.
A, %Ki67 expression in CD8, conventional CD4, and Treg (FoxP3+ CD4) T cells pre and post in blood (n = 28 independent paired patient samples for CD8 comparisons, n = 17 independent paired patient samples for CD4 comparisons, and n = 27 independent patient samples for Treg comparisons). Two-sided Wilcoxon matched-pairs test was performed for CD8 and Treg comparisons. Two-sided t-test was performed for CD4 comparison. B, %Ki67 expression in CD8, conventional CD4, and Treg (FoxP3+ CD4) T cells pre and post in tumor (n = 26 independent paired patient samples for CD8 comparisons, n = 15 independent paired patient samples for CD4 comparisons, and n = 25 independent paired patient samples for Treg comparisons). Two-sided Wilcoxon matched-pairs test was performed for CD4 and Treg comparisons. Two-sided t-test was performed for CD8 comparison.
Extended Data Fig. 3
Extended Data Fig. 3. Cellular determinants of response and resistance to anti-PD-1
A, Changes in tumor PD-L1 pre versus post-treatment using immunohistochemistry staining (n = 9 independent paired patient samples). ** p<0.01 using two-sided Wilcoxon matched-pairs test. B, Correlation of % Ki67+ in non-naïve CD8 T cells versus %Ki67+ in Tregs (FoxP3+ CD4) (n = 21 independent patient samples), R-score and p-value generated using Pearson’s correlation. C, 33 post-treatment immune parameters classified by recurrence using random forest analysis and ranked by importance score (n = 21 independent patient samples). Error bar denotes mean +/− sd for 1000 random forest iterations. D, % expression of selected markers in tumor between patients with recurrence (9 independent patient samples) and no recurrence (12 independent patient samples). P value calculated using two-sided Mann-Whitney test. E, Correlation of % Ki67+ in Tregs (FoxP3+ CD4) versus %Eomes+Tbet- in non-naïve CD8 (n = 21 independent patient samples), R-score and p-value generated using Pearson’s correlation. F, 25 pre-treatment immune parameters classified by recurrence using random forest analysis and ranked by importance score (n = 21 independent patient samples). Error bar denotes mean +/− sd for 1000 random forest iterations. G, % expression of selected markers in tumor between patients with recurrence (9 independent patient samples) and no recurrence (12 independent patient samples). Two-sided t test was used for CD45RA-CD27+ and CD45RA+CD27+ comparisons. Two-sided Mann Whitney test was used for CD8 Ki67+ and CD4 Ki67+ comparisons. Error bar denotes mean +/− sd. H, Scatter plot of %Ki67+ in non-naïve CD8 versus %Ki67+ in FoxP3+ CD4 (Tregs) at pre-treatment stratified by recurrence status. Dotted line denotes non-naïve CD8 Ki67+ of 5.5 calculated by CART analysis as the optimal cutpoint separating recurrence vs no recurrence. (n = 21 independent patient samples).
Extended Data Fig. 4
Extended Data Fig. 4. Immune signatures associated with clinical response.
A, Heatmap of differentially expressed genes between pre-treatment and post treatment tumor (n = 11 independent paired patient samples). Differentially expressed genes identified using a FDR cutoff of p=0.05 after adjusting for multiple comparisons. B, Heatmap and GEP score between patients with recurrence (n = 5 independent patient samples) and no recurrence (n = 8 independent patient samples). P value calculated using two-sided Mann-Whitney test. Error bar denotes mean +/− sd. C, Gene set enrichment analysis of NRS genes that were enriched in TEFF, TMEM, and TEX versus TNAIVE cell signatures from19. D, Heatmap of angiogenesis associated genes from Gene Ontology. E, Heatmap of B cell receptor associated genes from Gene Ontology.
Extended Data Fig. 5
Extended Data Fig. 5. Clinical progression and neoantigen quantity and quality.
A, Disease-free survival of patients that recurred. B, CT image before and after of a patient with recurrent metastatic disease. C, Neoantigen load based on predicted binding (predicted kD of <500nM and mutant kD< WT kD). D, Number of high quality neoantigens that are likely to be recognized by TCR based on neoantigen fitness model at post treatment versus recurrence timepoints.
Figure 1:
Figure 1:. Pathologic response and tumor infiltrating lymphocytes are predictive of clinical outcome after a single dose of anti-PD-1.
A, Schema of the neoadjuvant and then adjuvant pembrolizumab clinical trial. B, Representative images of viable, mixed, and necrotic tumors resected at the three-week post-treatment time point. C, Representative H&E images of pathologic complete response (pCR) and non-response (non-resp) (left) and fraction of patients with complete pathologic response and major pathologic response (right). D, Kaplan Meier estimate of disease-free survival. E, Representative H&E images (left) and changes in the percent of viable tumor in pre-treatment and post-treatment tumors (right, n = 20); p value calculated using two-sided Wilcoxon matched-pairs test. F, Kaplan Maier estimate of disease-free survival stratified according to pathologic response. Cox proportional hazards regression modeling was used to calculate hazard ratio. G, Changes in TIL infiltration in pre-treatment and post-treatment tumors (n = 20); p value calculated using McNemar’s Test. H, shows Kaplan Maier estimate of disease-free survival stratified according to TIL score. Cox proportional hazards regression modeling was used to calculate hazard ratio.
Figure 2:
Figure 2:. Early radiographic, pathologic, and immune response to anti-PD-1.
A, Changes in tumor diameter based on the CT portion of FDG PET-CT imaging at three weeks compared to pre-treatment colored by recurrence status. B, Paired histology and radiographic images from a patient with pCR (top) and a patient with recurrence (bottom). C, Correlation of the change in tumor diameter on CT imaging after 1 dose of pembrolizumab versus percent viable tumor at resection (n = 6). R-score and p-value generated using Pearson’s correlation. D, Correlation matrix of selected variables for 27 trial patients with data available at data cut-off. Colored boxes represent Pearson’s correlations with a significance of p<0.05. Red to blue represents correlation coefficients ranging from 1 to −1 respectively. E, Waterfall plot of percent viable tumor colored by TIL infiltration. F, Representative flow plots of 7 independent patients. G, Ki67 expression in CD8 T cell subsets at indicated times. (n = 7); p value calculated using two-sided Wilcoxon matched-pairs test. Error bar denotes mean +/− sd. H, Representative flow plots of 7 independent patients; gated on Ki67+ CD8. I, Percent expression of markers in Ki67+ (green), or Ki67- (blue) CD8 T cells (n = 7 independent patient samples). Error bar denotes mean +/− sd.
Figure 3:
Figure 3:. Pembrolizumab targets TEX in tumor.
A, Changes in tumor CD8 T cells pre- versus post-treatment using immunofluorescence (IF) staining (n = 9 independent paired patient samples; one outlier removed due to pre-treatment value >2 sd above the mean). P value calculated using two-sided Wilcoxon matched-pairs test. B, Representative flow plots of pre-treatment PBMC and TIL for 15 independent patient samples. Gated on CD8 (CD45RA versus CD27), and non-naïve CD8 (Eomes versus Tbet, CD45RA versus PD-1, PD-1 versus Tim-3, PD-1 versus CTLA4, PD-1 versus CD39). C, Percent of memory markers, transcription factors, and inhibitory receptors in non-naïve CD8 T cells (n = 15 independent patient samples). Comparisons for all CD45RA versus CD27 subsets performed using two-sided Wilcoxon matched-pairs test. Eomes+Tbet- comparison performed using two-sided paired t-test. Eomes-Tbet- comparison performed using two-sided Wilcoxon matched-pairs test. Comparisons of PD-1 and Lag-3 performed using Wilcoxon matched-pairs test. Comparisons of Tim-3, CTLA-4, CD39, and TIGIT performed using two-sided t test. D, Percent of pembrolizumab bound, calculated by % of IgG4+/%PD-1(EH12)+ (n = 10 independent patient samples). Error bar denotes mean +/− sd. E, Percent Ki67 and frequency of CD8 subsets, pre and at week 3. (n = 28 independent paired patient samples). P values calculated using two-sided Wilcoxon matched-pairs test. Error bars denote mean +/− sd. F, Representative flow plots of two paired CMV and gp100-specific responses pre and post-treatment, in blood and tumor (left). Frequencies of CMV and gp100 tetramer+ CD8 T cells pre and at week 3 in the blood and tumor (right). G, Representative flow plots of memory markers, transcription factors, and IRs for gp100-specific CD8 T cells. H, Expression of selected markers in gp100-specific and CMV-specific CD8 T cells at week 3 post-treatment timepoint. (n = 4 for gp100-specfic responses in blood and tumor; n = 2 for CMV specific responses). Error bar denotes mean +/− sd.
Figure 4:
Figure 4:. Mechanisms of response and resistance to anti-PD-1 therapy.
A. Changes in tumor FoxP3+ cells pre- versus post-treatment using immunofluorescence (IF) staining (n = 10). P value calculated using two-sided Wilcoxon matched-pairs test. B. Scatter plot of %Ki67+ in non-naïve CD8 versus %Ki67+ in FoxP3+ CD4 (Tregs) at week 3 post treatment stratified by recurrence status. P13, P06, and P03 represent patients with recurrence tumors samples analyzed below. Dotted line denotes Treg Ki67+ of 12.4 calculated by CART analysis as the optimal cutpoint separating recurrence versus no recurrence. (Left, n = 22). Kaplan Maier estimate of disease-free survival stratified according to CART defined cutoff for Treg Ki67 (Right, Ki67<12.4, n = 9, Ki67>=12.4, n = 13). P value calculated using log-rank test. C. Kaplan Maier estimate of disease-free survival stratified according to CART defined cutoff for non-naïve CD8 Ki67 at baseline (Ki67>5.5, n = 13; Ki67>=12.4, n = 8). P value calculated using log-rank test. D. Heatmap of 69 differentially expressed genes (Neoadjuvant Response Signature) at the pre-treatment time point between patients with no recurrence (n = 9 patients) and recurrence (n = 5 patients). Differentially expressed genes identified using FDR cutoff of p = 0.05. E, Pathways identified using gene ontology analysis. F, Volcano plot of differentially expressed genes. G, Gene set enrichment analysis of the Neoadjuvant Response Signature (NRS); genes that were enriched in TEX versus TEFF -cell signatures from Doering et al . H, NanoString gene expression data showing log2 fold change between progression versus post samples (x axis), and expression at progression (y axis). I, Lymphocyte subsets at post and progression time points by immunohistochemistry (IHC), and immunofluorescence (IF). J, Flow plots of selected markers at post and progression time points for three individual patients. K, Integrative Genomics Viewer (IGV) images corresponding to B2M and TP53 mutations at post and progression time points.

Comment in

  • Early responses indicate remission.
    Sidaway P. Sidaway P. Nat Rev Clin Oncol. 2019 May;16(5):272. doi: 10.1038/s41571-019-0196-2. Nat Rev Clin Oncol. 2019. PMID: 30837713 No abstract available.

References

    1. Fridman WH, Pages F, Sautes-Fridman C & Galon J The immune contexture in human tumours: impact on clinical outcome. Nat Rev Cancer 12, 298–306 (2012). - PubMed
    1. Vesely MD, Kershaw MH, Schreiber RD & Smyth MJ Natural innate and adaptive immunity to cancer. Annu Rev Immunol 29, 235–271 (2011). - PubMed
    1. Huang AC, et al. T-cell invigoration to tumour burden ratio associated with anti-PD-1 response. Nature 545, 60–65 (2017). - PMC - PubMed
    1. Kamphorst AO, et al. Proliferation of PD-1+ CD8 T cells in peripheral blood after PD-1-targeted therapy in lung cancer patients. Proc Natl Acad Sci U S A 114, 4993–4998 (2017). - PMC - PubMed
    1. Simoni Y, et al. Bystander CD8(+) T cells are abundant and phenotypically distinct in human tumour infiltrates. Nature 557, 575–579 (2018). - PubMed

Methods-Only References

    1. Mihm MC Jr., Clemente CG & Cascinelli N Tumor infiltrating lymphocytes in lymph node melanoma metastases: a histopathologic prognostic indicator and an expression of local immune response. Lab Invest 74, 43–47 (1996). - PubMed
    1. Heinze G & Schemper M A solution to the problem of monotone likelihood in Cox regression. Biometrics 57, 114–119 (2001). - PubMed
    1. Brahmer JR, et al. Phase I study of single-agent anti-programmed death-1 (MDX-1106) in refractory solid tumors: safety, clinical activity, pharmacodynamics, and immunologic correlates. J Clin Oncol 28, 3167–3175 (2010). - PMC - PubMed
    1. Chen M, et al. Development and validation of a novel clinical fluorescence in situ hybridization assay to detect JAK2 and PD-L1 amplification: a fluorescence in situ hybridization assay for JAK2 and PD-L1 amplification. Mod Pathol 30, 1516–1526 (2017). - PubMed
    1. Luksza M, et al. A neoantigen fitness model predicts tumour response to checkpoint blockade immunotherapy. Nature 551, 517–520 (2017). - PMC - PubMed

Publication types

MeSH terms

Substances