. 2019 Mar;51(3):431-444.
doi: 10.1038/s41588-019-0344-8. Epub 2019 Feb 25.

Identification of common genetic risk variants for autism spectrum disorder

Jakob Grove  1   2   3   4 Stephan Ripke  5   6   7 Thomas D Als  1   2   3 Manuel Mattheisen  1   2   3   8   9 Raymond K Walters  5   6 Hyejung Won  10   11 Jonatan Pallesen  1   2   3 Esben Agerbo  1   12   13 Ole A Andreassen  14   15 Richard Anney  16 Swapnil Awashti  7 Rich Belliveau  6 Francesco Bettella  14   15 Joseph D Buxbaum  17   18   19   20 Jonas Bybjerg-Grauholm  1   21 Marie Bækvad-Hansen  1   21 Felecia Cerrato  6 Kimberly Chambert  6 Jane H Christensen  1   2   3 Claire Churchhouse  5   6   22 Karin Dellenvall  23 Ditte Demontis  1   2   3 Silvia De Rubeis  17   18 Bernie Devlin  24 Srdjan Djurovic  14   25 Ashley L Dumont  6 Jacqueline I Goldstein  5   6   22 Christine S Hansen  1   21   26 Mads Engel Hauberg  1   2   3 Mads V Hollegaard  1   21 Sigrun Hope  14   27 Daniel P Howrigan  5   6 Hailiang Huang  5   6 Christina M Hultman  23 Lambertus Klei  24 Julian Maller  6   28   29 Joanna Martin  6   16   23 Alicia R Martin  5   6   22 Jennifer L Moran  6 Mette Nyegaard  1   2   3 Terje Nærland  14   30 Duncan S Palmer  5   6 Aarno Palotie  5   6   22   31 Carsten Bøcker Pedersen  1   12   13 Marianne Giørtz Pedersen  1   12   13 Timothy dPoterba  5   6   22 Jesper Buchhave Poulsen  1   21 Beate St Pourcain  32   33   34 Per Qvist  1   2   3 Karola Rehnström  35 Abraham Reichenberg  17   18   19 Jennifer Reichert  17   18 Elise B Robinson  5   6   36 Kathryn Roeder  37   38 Panos Roussos  18   39   40   41 Evald Saemundsen  42 Sven Sandin  17   18   23 F Kyle Satterstrom  5   6   22 George Davey Smith  33   43 Hreinn Stefansson  44 Stacy Steinberg  44 Christine R Stevens  6 Patrick F Sullivan  10   23   45 Patrick Turley  5   6 G Bragi Walters  44   46 Xinyi Xu  17   18 Autism Spectrum Disorder Working Group of the Psychiatric Genomics ConsortiumBUPGENMajor Depressive Disorder Working Group of the Psychiatric Genomics Consortium23andMe Research TeamKari Stefansson  44   46 Daniel H Geschwind  47   48   49 Merete Nordentoft  1   50 David M Hougaard  1   21 Thomas Werge  1   26   51 Ole Mors  1   52 Preben Bo Mortensen  1   2   12   13 Benjamin M Neale  5   6   22 Mark J Daly  53   54   55   56 Anders D Børglum  57   58   59
Collaborators, Affiliations

Identification of common genetic risk variants for autism spectrum disorder

Jakob Grove et al. Nat Genet. 2019 Mar.

Abstract

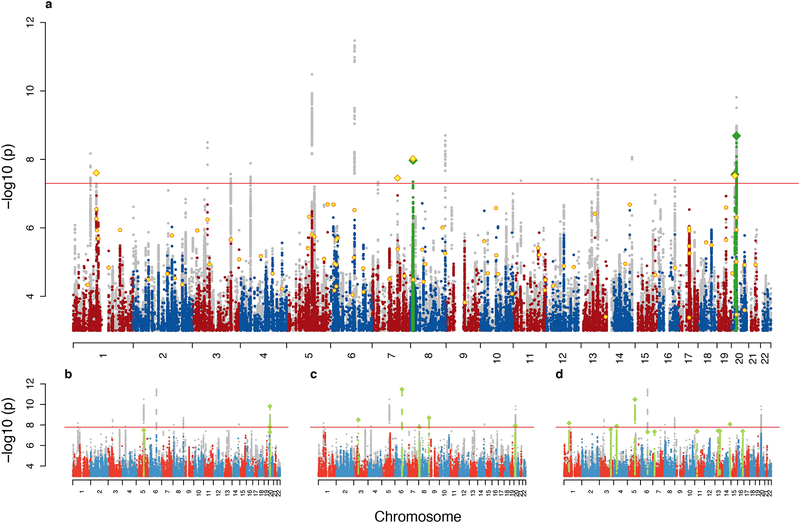
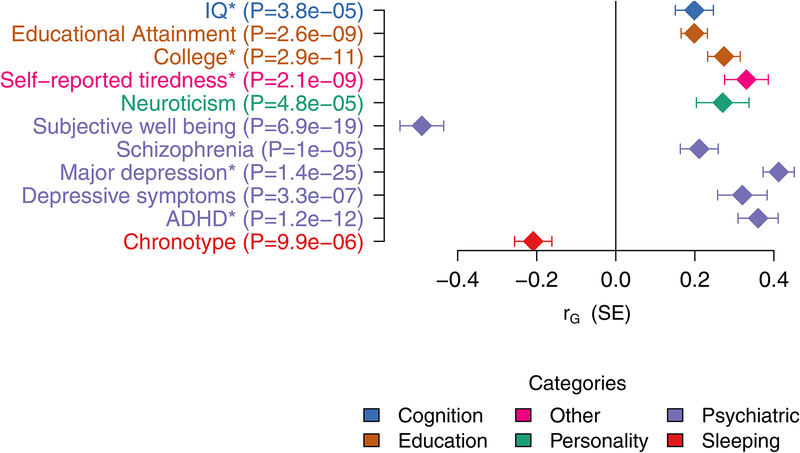
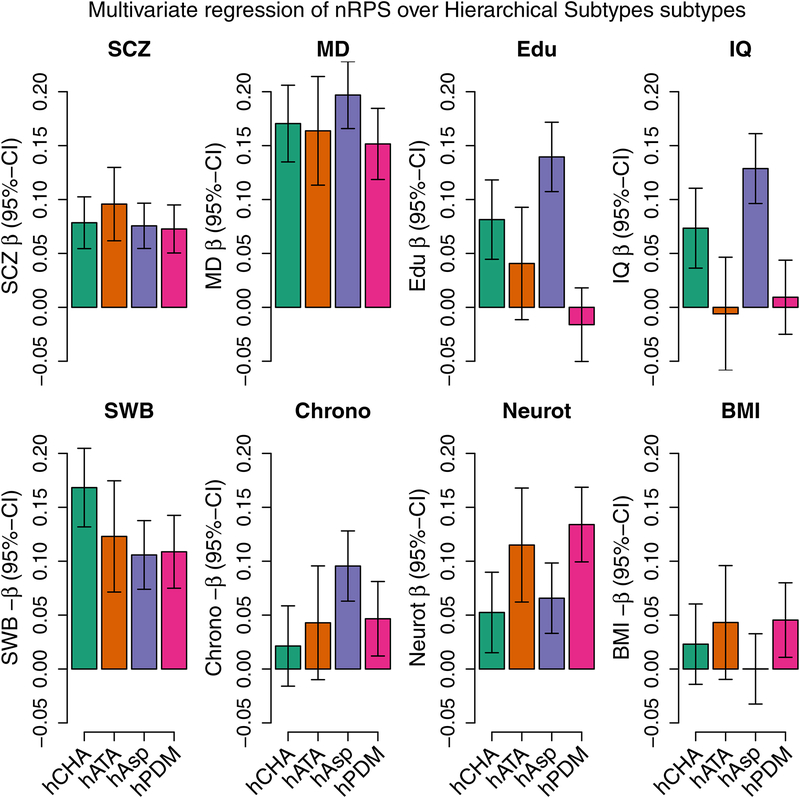
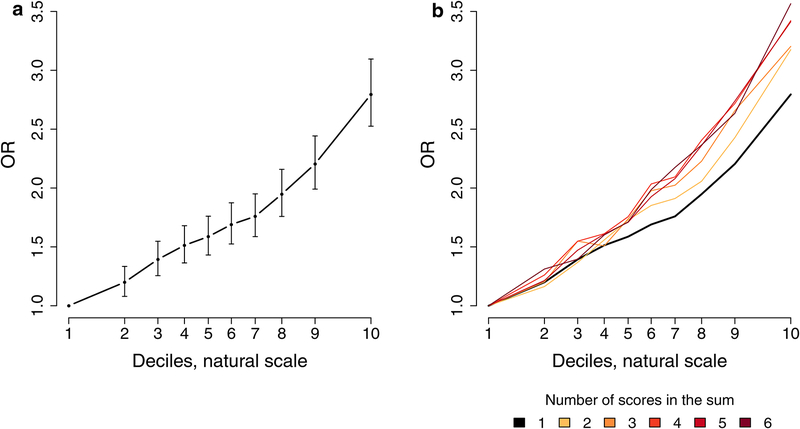
Autism spectrum disorder (ASD) is a highly heritable and heterogeneous group of neurodevelopmental phenotypes diagnosed in more than 1% of children. Common genetic variants contribute substantially to ASD susceptibility, but to date no individual variants have been robustly associated with ASD. With a marked sample-size increase from a unique Danish population resource, we report a genome-wide association meta-analysis of 18,381 individuals with ASD and 27,969 controls that identified five genome-wide-significant loci. Leveraging GWAS results from three phenotypes with significantly overlapping genetic architectures (schizophrenia, major depression, and educational attainment), we identified seven additional loci shared with other traits at equally strict significance levels. Dissecting the polygenic architecture, we found both quantitative and qualitative polygenic heterogeneity across ASD subtypes. These results highlight biological insights, particularly relating to neuronal function and corticogenesis, and establish that GWAS performed at scale will be much more productive in the near term in ASD.


Conflict of interest statement

Competing Interests Statement

Hreinn Stefansson, Kari Stefansson, Stacy Steinberg, and G. Bragi Walters are employees of deCODE genetics/Amgen. The 23andMe Research Team are employed by 23andMe. Daniel H Geschwind is a scientific advisor for Ovid Therapeutic, Falcon Computing and Axial Biotherapeutics. Thomas Werge has acted as scientific advisor and lecturer for H. Lundbeck A/S.

Figures

Figure 1.
Figure 1.. Manhattans plots:
with the x axis showing genomic position (chromosomes 1–22) and the y axis showing statistical significance as −log10 (P) of z statistics. a: The main ASD scan (18,381 cases and 27,969 controls) with the results of the combined analysis with the follow-up sample (2,119 cases and 142,379 controls) in yellow in the foreground. Genome-wide significant clumps are painted green with index SNPs as diamonds. b-d: Manhattan plots for three MTAG scans of ASD together with, respectively, schizophrenia (34,129 cases and 45,512 controls), educational attainment (N = 328,917) and major depression (111,902 case and 312,113 controls). See Supplementary Figures 45–48 for full size plots. In all panels the results of the composite of the five analyses (consisting for each marker of the minimal p-value of the five) is shown in grey in the background.
Figure 2.
Figure 2.. Genetic correlation with other traits.
Significant genetic correlations between ASD (N = 46,350) and other traits after Bonferroni correction for testing a total of 234 traits available at LDhub with the addition of a handful of new phenotypes. Estimates and tests by LDSC. The results here correspond to the following GWAS analyses: IQ (N = 78,308), educational attainment (N = 328,917), college (N = 111,114), self-reported tiredness (N = 108,976), neuroticism (N = 170,911), subjective well-being (N = 298,420), schizophrenia (N = 82,315), major depression (N = 480,359), depressive symptoms(N = 161,460), attention deficit/hyperactivity disorder (ADHD) (N = 53,293), and chronotype (N = 128,266). See Supplementary Table 5 for the full output of this analysis. * Indicates that the values are from in-house analyses of new summary statistics not yet included in LD Hub.
Figure 3.
Figure 3.. Profiling PRS load across distinct ASD sub-groups for 8 different phenotypes
(schizophrenia (SCZ), major depression (MD), educational attainment (Edu), human intelligence (IQ), subjective well-being (SWB), chronotype, neuroticism and body mass index (BMI). The bars show coefficients from multivariate multivariable regression of the 8 normalized scores on the distinct ASD sub-types of 13,076 cases and 22,664 controls, adjusting for batches and principal compenents. The subtypes are the hierarchically defined subtypes for childhood autism (hCHA, N = 3,310), atypical autism (hATA, N = 1,494), Asperger’s (hAsp, N = 4,417), and the lumped pervasive disorders developmental group (hPDM, N = 3,855). Please note that the orientation of the scores for subjective well-being, chronotype and BMI have been switched to improve graphical presentation. The corresponding plot where subjects with intellectual disability have been excluded can be seen in Supplementary Figure 85, and with intellectual disability as a subtype in Supplementary Figure 84. Applying the same procedure to the internally trained ASD score did not display systematic heterogeneity (P = 0.068) except as expected for the ID groups (P = 0.00027) (Supplementary Figure 88). Linear hypotheses tested using the Pillai test.
Figure 4.
Figure 4.. Decile plots
(Odds Ratio (OR) by PRS within each decile for 13,076 cases and 22,664 controls): a. Decile plot with 95%-CI for the internally trained ASD score (P-value threshold is 0.1). b. Decile plots on a weighted sums of PRSs starting with the ASD score of panel a and successively adding the scores for major depression, subjective well-being, schizophrenia, educational attainment, and chronotype. In all instances the P-value threshold for the score used is the one with the highest Nagelkerke’s R2. Supplementary Figures 92 and 94 show the stability across leave-one out groups that was used to create these combined results.
Figure 5.
Figure 5.. Chromatin interactions identify putative target genes of ASD loci.
a-d. Chromatin interaction maps of credible SNPs to the 1 Mb flanking region, providing putative candidate genes that physically interact with credible SNPs. Gene Model is based on Gencode v19 and putative target genes are marked in red; Genomic coordinate for a credible SNP is labeled as GWAS; −log10(P-value), significance of the interaction between a SNP and each 10-kb bin, grey dotted line for FDR = 0.01 (one-sided significance test calculated as the probability of observing a higher contact frequency under the fitted Weibull distribution matched by chromosome and distance); Topologically associated domain (TAD) borders in cortical plate (CP) and germinal zone (GZ). e-f. Developmental expression trajectories of ASD candidate genes show highest expression in prenatal periods. Significance by t-test (N = 410 and 453 for prenatal and postnatal samples, respectively). Box-plots showing median, interquartile range (IQR) with whiskers adding IQR to the 1st and 3rd quartile (e and g). LOESS smooth curve plotted with actual data points (f) g. ASD candidate genes are highly expressed in the developing cortex as compared to other brain regions. One-way ANOVA and posthoc Tukey test, FDR-corrected. (N = 410/453, 39/36, 33/37, 48/34, 37/36, 32/39 for prenatal/postnatal cortex, hippocampus, amygdala, striatum, thalamus, and cerebellum, respectively).

References

    1. De Rubeis S et al. Synaptic, transcriptional and chromatin genes disrupted in autism. Nature 515, 209–215 (2014). - PMC - PubMed
    1. Gaugler T et al. Most genetic risk for autism resides with common variation. Nat Genet 46 (2014). - PMC - PubMed
    1. Iossifov I et al. The contribution of de novo coding mutations to autism spectrum disorder. Nature 515, 216–221 (2014). - PMC - PubMed
    1. Krumm N et al. Excess of rare, inherited truncating mutations in autism. Nat Genet 47 (2015). - PMC - PubMed
    1. Anney RJL et al. Meta-analysis of gwas of over 16,000 individuals with autism spectrum disorder highlights a novel locus at 10q24.32 and a significant overlap with schizophrenia. Molecular Autism 8, 21 (2017). - PMC - PubMed

Methods only references

    1. Børglum AD et al. Genome-wide study of association and interaction with maternal cytomegalovirus infection identifies new schizophrenia loci. Molecular Psychiatry 19, 325–333 (2014). Published online 29 January 2013. - PMC - PubMed
    1. Illumina gencall data analysis software Tech. Rep, Illumina, Inc. (2005).
    1. Korn JM et al. Integrated genotype calling and association analysis of snps, common copy number polymorphisms and rare cnvs. Nature genetics 40, 1253–1260 (2008). - PMC - PubMed
    1. Goldstein JI et al. zcall: a rare variant caller for array-based genotyping: genetics and population analysis. Bioinformatics (Oxford, England) 28, 2543–2545 (2012). - PMC - PubMed
    1. Lajonchere CM & Consortium, A. Changing the landscape of autism research: the autism genetic resource exchange. Neuron 68, 187–191 (2010). - PMC - PubMed

Publication types