. 2019 Feb 5:12:12.
doi: 10.3389/fnmol.2019.00012. eCollection 2019.

Bumetanide Prevents Brain Trauma-Induced Depressive-Like Behavior

Affiliations

Bumetanide Prevents Brain Trauma-Induced Depressive-Like Behavior

Emmanuelle Goubert et al. Front Mol Neurosci. .

Abstract

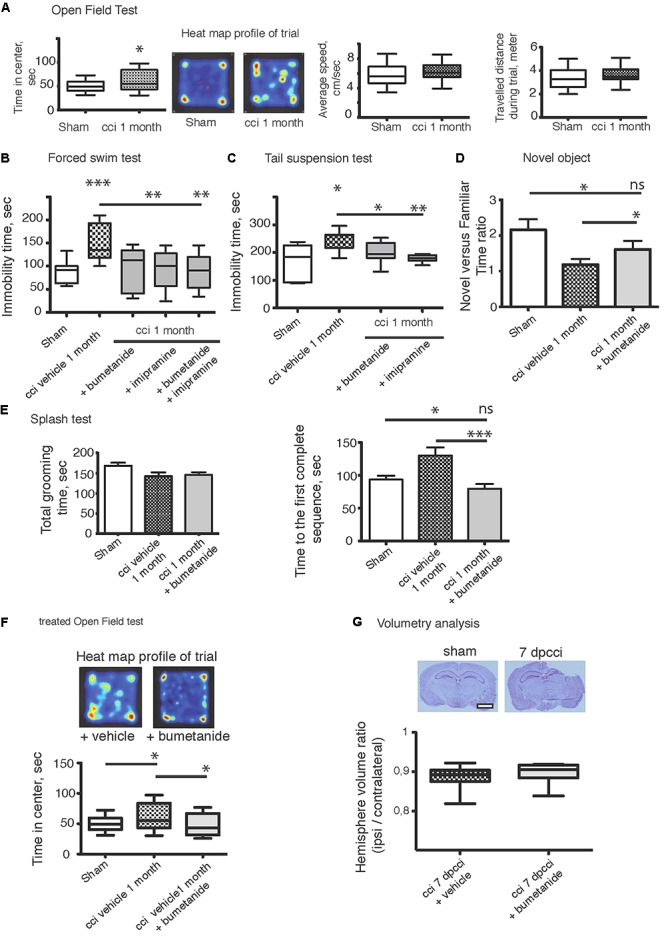
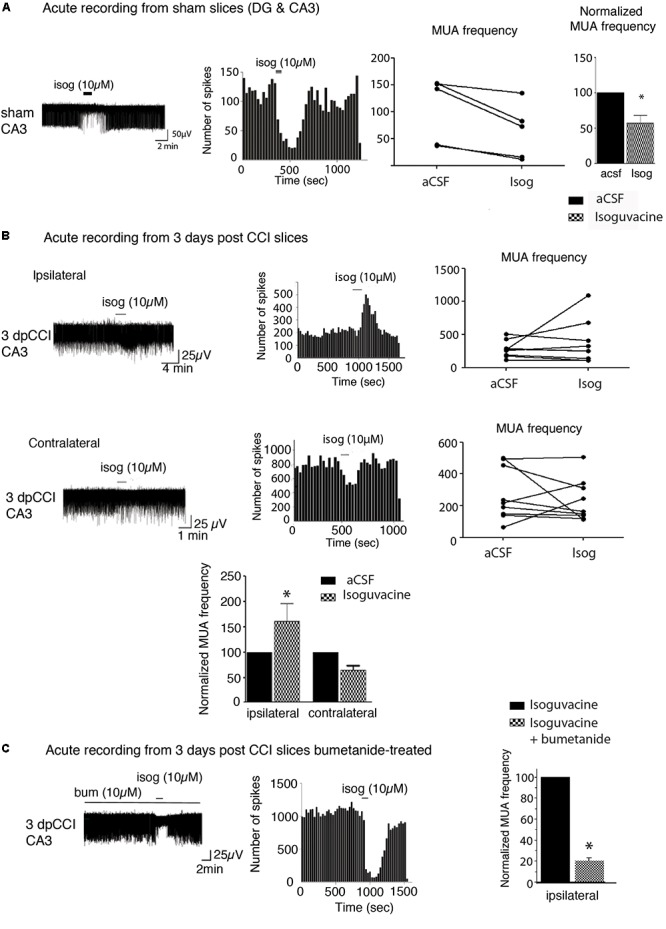
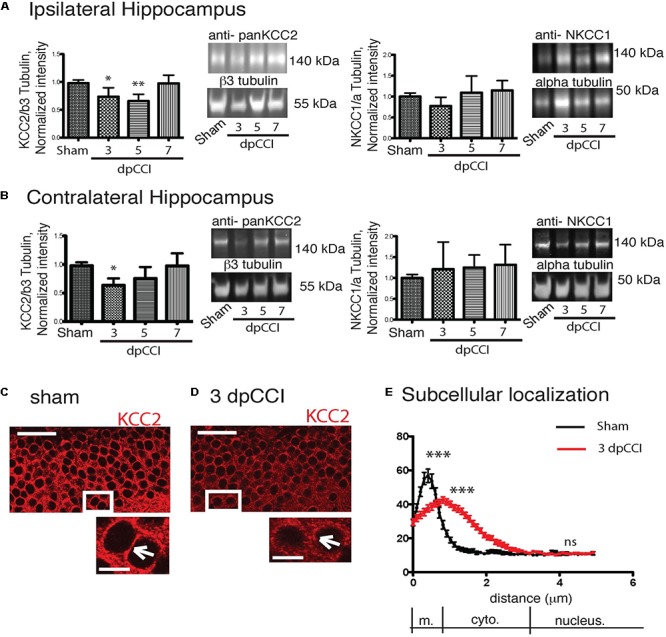
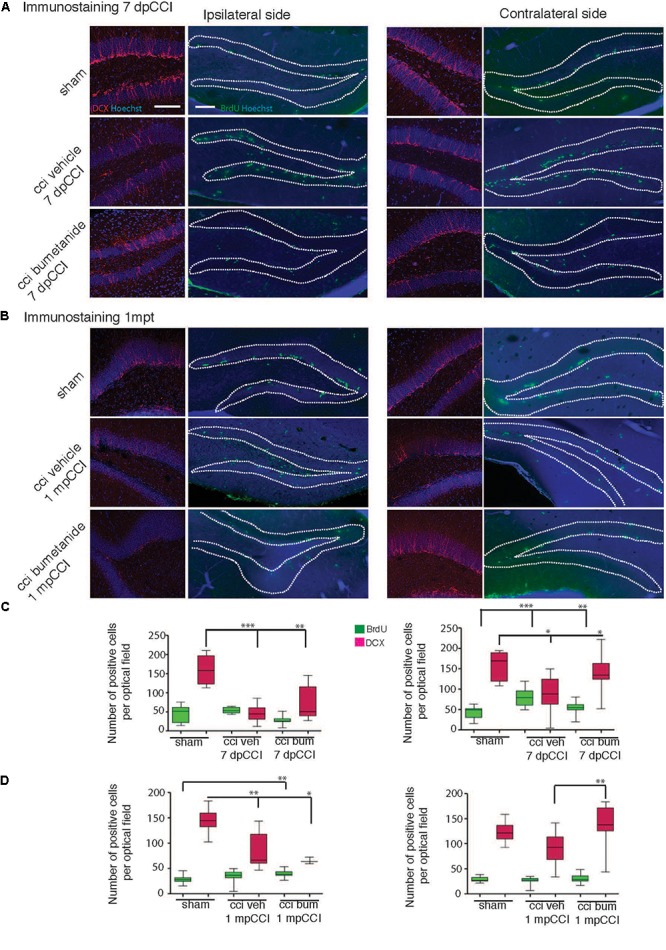
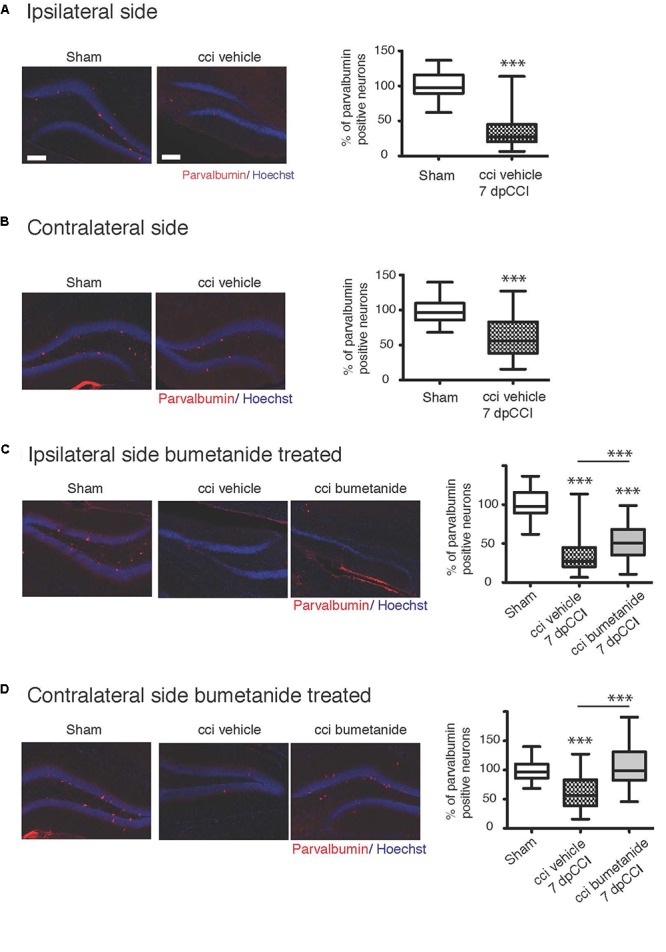
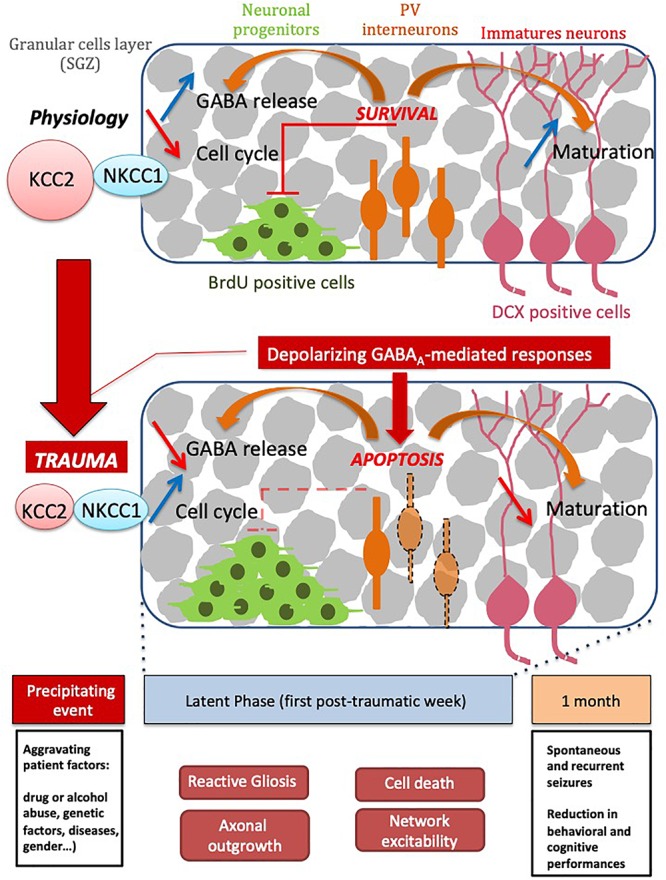
Brain trauma triggers a cascade of deleterious events leading to enhanced incidence of drug resistant epilepsies, depression, and cognitive dysfunctions. The underlying mechanisms leading to these alterations are poorly understood and treatment that attenuates those sequels are not available. Using controlled-cortical impact as an experimental model of brain trauma in adult mice, we found a strong suppressive effect of the sodium-potassium-chloride importer (NKCC1) specific antagonist bumetanide on the appearance of depressive-like behavior. We demonstrate that this alteration in behavior is associated with an impairment of post-traumatic secondary neurogenesis within the dentate gyrus of the hippocampus. The mechanism mediating the effect of bumetanide involves early transient changes in the expression of chloride regulatory proteins and qualitative changes in GABA(A) mediated transmission from hyperpolarizing to depolarizing after brain trauma. This work opens new perspectives in the early treatment of human post-traumatic induced depression. Our results strongly suggest that bumetanide might constitute an efficient prophylactic treatment to reduce neurological and psychiatric consequences of brain trauma.

Keywords: bumetanide; depression; interneuron cell death; neurogenesis; potassium chloride cotransporter 2 (KCC2); psychiatric disease.


Figures

Figure 1
Figure 1
Bumetanide ameliorates CCI induced behavioral changes. (A) Open field test (OFT): plots represent both the time spent by the animal in the arena center, the total distance traveled and the average speed of the animal during the 10 min test, sham n = 30 and CCI n = 20, we used unpaired t-test for the comparison on the two population. (B) Forced swim test (FST): immobility time in a 25°C water for 4 min, sham n = 15, CCI n = 12, CCI + bum = 6, CCI + imipramine = 6 and CCI + bum + imipramine = 6. (C) Tail suspension test (TST): immobility time for 6 min (sham n = 10 and CCI n = 10. (D) The Novel Objet Recognition shows changes in the exploration time, the results are presented on a ratio of time of new versus familiar, n = 16, 15, and 17, respectively. (E) Splash test analyzes the total grooming time and the latency to the first complete sequence, n = 26, 27, 28, respectively. (F) After 1 week of i.p. bumetanide twice daily injection (20 μM). Treated animals showed improvement in the OFT compared to non-treated animals, n = 20. Statistic analysis is done using one-way ANOVA test with either Kruskal–Wallis, for non-parametric data or Tukey’s comparison of multiple test for parametric data as post hoc treatment to compare between conditions. (G) Volumetry analysis: volume are calculated by summation of areas multiplied by distance between sections (500 μm) n = 10 brains per condition. The graph shows the ipsi over contralateral volume ratio, 7 days post cci from bumetanide- and vehicle-treated mice. Statistical significance is tested using Mann–Whitney test, p = 0.21. p < 0.05; ∗∗p < 0.01; ∗∗∗p < 0.001.
Figure 2
Figure 2
Network activity recording and chloride extrusion efficacy. (A) Effect of isoguvacine (10 μM) on hippocampal networks from ipsi and contralateral hippocampus from sham animals. (B) Effect of isoguvacine (10 μM) on hippocampal networks at 3 days post-CCI, Top left: example trace of spontaneous extracellular field potentials recorded in ipsilateral hippocampus. Middle: corresponding time course of spike frequency changes. Top right: graph of non-normalized spike frequencies. Middle left: example trace of spontaneous extracellular field potentials recorded in contralateral hippocampus. Middle: corresponding time course of spike frequency changes. Middle right: graph of non-normalized spike frequencies. Bottom: average histograms of normalized spike frequencies. (C) The same as in (B) with acute pre-treatment of bumetanide (10 μM). 3 days post-CCI (n = 2 animals, 4–5 slices per animal). p < 0.05; ∗∗p < 0.01; ∗∗∗p < 0.001.
Figure 3
Figure 3
CCI-induced changes in chloride co-transporters expression. (A) The left panel represents the KCC2 protein expression normalized to the neuronal marker β3-tubulin on the ipsilateral hippocampus. Protein expression over the time is expressed in comparison to the sham conditions. On the right panel, NKCC1 protein expression is shown normalized to the ubiquitous marker α-tubulin. Protein expression over the time is expressed in comparison to sham conditions, n = 8 per condition. One-way ANOVA test is performed and expressed as following p < 0.05; ∗∗p < 0.01; ∗∗∗p < 0.001 together with Kruskal–Wallis post hoc test. (B) Same as (A) but in the contralateral hippocampus. (C–E) KCC2 staining in granule cells. (C) Sham at 3 dpCCI. The labeling is at the cellular membrane (arrowhead) and the cytoplasm is almost devoid of KCC2 labeling. (D) 3 dpCCI. KCC2 is found in the cytoplasmic cell compartments (arrowheads). (E) Histograms representing the distribution and quantification of the intensity of fluorescence in 3 dpCCI cells (red curve) in sham (black curve). Statistical analysis represents the difference in each sub region of the cell, namely membrane, cytoplasm, and nuclear staining. Scale bars: 50 and 10 μm.
Figure 4
Figure 4
Effect of bumetanide on CCI-induced changes in secondary neurogenesis. Secondary neurogenesis in the dentate gyrus. (A) Double-cortin (DCX) and BrdU labeling at 7 days post-CCI in the ipsilateral (left) and contralateral (right) dentate gyrus of sham, CCI vehicle and bumetanide-treated animals. Dotted lines delimit granular layer of dentate gyrus (scale bar = 100 μm). (B) Same as in (A) at 1 month post-CCI. (C) Quantification of BrdU and DCX positive cells 7 dpCCI in the ipsilateral (left) and contralateral (right) dentate gyrus of sham, CCI vehicle and bumetanide-treated animals. (D) Same as in (C) at 1 month post-CCI. DCX 7 days post-CCI: n = 6 animals per condition, 3 slices per animal; 1 month post-CCI; n = 4 animals per condition, 2–4 slices per animal. BrdU 7 days post-CCI: n = 5 sham n = 6 CCI vehicle and 6 CCI bumetanide, 2–6 slices per animal, 1 month post-CCI: n = 3 sham n = 4 CCI vehicle and 4 CCI bumetanide, 3–4 slices per animal. All sets of data were analyzed using one-way ANOVA test with Tukey’s post hoc test. p < 0.05; ∗∗p < 0.01; ∗∗∗p < 0.001.
Figure 5
Figure 5
Effect of bumetanide on CCI-induced parvalbumin positive interneuron death. (A) Ipsilateral hippocampus: left panel example of parvalbumin and Hoechst immunostaining, from sham and CCI mice. On the right panel, quantification of parvalbumin positive interneurons in the dentate gyrus normalized to sham values. n = 5 animals per condition. (B) Same as (A) but in contralateral hippocampus, the histogram shows reduction in the number of parvalbumin-containing cells in the DG, n = 5 animals per condition. (C) Effect of bumetanide in parvalbumin interneuron survival in the ipsilateral hippocampus. The histogram shows a significant reduction in the cell loss in the presence of bumetanide but this is though significantly less as compared to sham, n = 5 animals per condition. (D) Contralateral hippocampus: bumetanide injection reduces interneurons loss, n = 5 animals per condition. All sets of data were analyzed using one-way ANOVA test with Tukey’s post hoc test. One-way ANOVA test is expressed as following p < 0.05; ∗∗p < 0.01; ∗∗∗p < 0.001.
Figure 6
Figure 6
Schematic scheme of TBI time course events. Please note that series of events taking place right and shortly after trauma are sequentially arranged leading to both short and long term consequences leading to decreased cognitive performance.

Similar articles

Cited by

References

    1. Acosta S. A., Diamond D. M., Wolfe S., Tajiri N., Shinozuka K., Ishikawa H., et al. (2013). Influence of post-traumatic stress disorder on neuroinflammation and cell proliferation in a rat model of traumatic brain injury. PLoS One 8:e81585. 10.1371/journal.pone.0081585 - DOI - PMC - PubMed
    1. Aldenkamp A. P., Bodde N. (2005). Behaviour, cognition and epilepsy. Acta Neurol. Scand. Suppl. 182 19–25. 10.1111/j.1600-0404.2005.00523.x - DOI - PubMed
    1. Alvarez D. D., Giacomini D., Yang S. M., Trinchero M. F., Temprana S. G., Büttner K. A., et al. (2016). A disynaptic feedback network activated by experience promotes the integration of new granule cells. Science 354 459–465. 10.1126/science.aaf2156 - DOI - PubMed
    1. Amini-Khoei H., Mohammadi-Asl A., Amiri S., Hosseini M.-J., Momeny M., Hassanipour M., et al. (2017). Oxytocin mitigated the depressive-like behaviors of maternal separation stress through modulating mitochondrial function and neuroinflammation. Prog. Neuropsychopharmacol. Biol. Psychiatry 76 169–178. 10.1016/j.pnpbp.2017.02.022 - DOI - PubMed
    1. Anacker C., Hen R. (2017). Adult hippocampal neurogenesis and cognitive flexibility — linking memory and mood. Nat. Rev. Neurosci. 18 335–346. 10.1038/nrn.2017.45 - DOI - PMC - PubMed

LinkOut - more resources