

FuNP (Fusion of Neuroimaging Preprocessing) Pipelines: A Fully Automated Preprocessing Software for Functional Magnetic Resonance Imaging
- PMID: 30804773
- PMCID: PMC6378808
- DOI: 10.3389/fninf.2019.00005
FuNP (Fusion of Neuroimaging Preprocessing) Pipelines: A Fully Automated Preprocessing Software for Functional Magnetic Resonance Imaging
Abstract
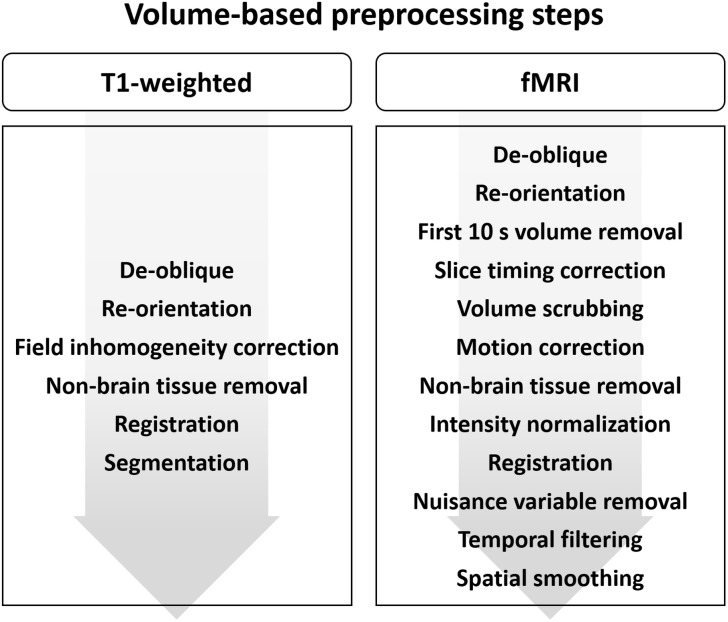
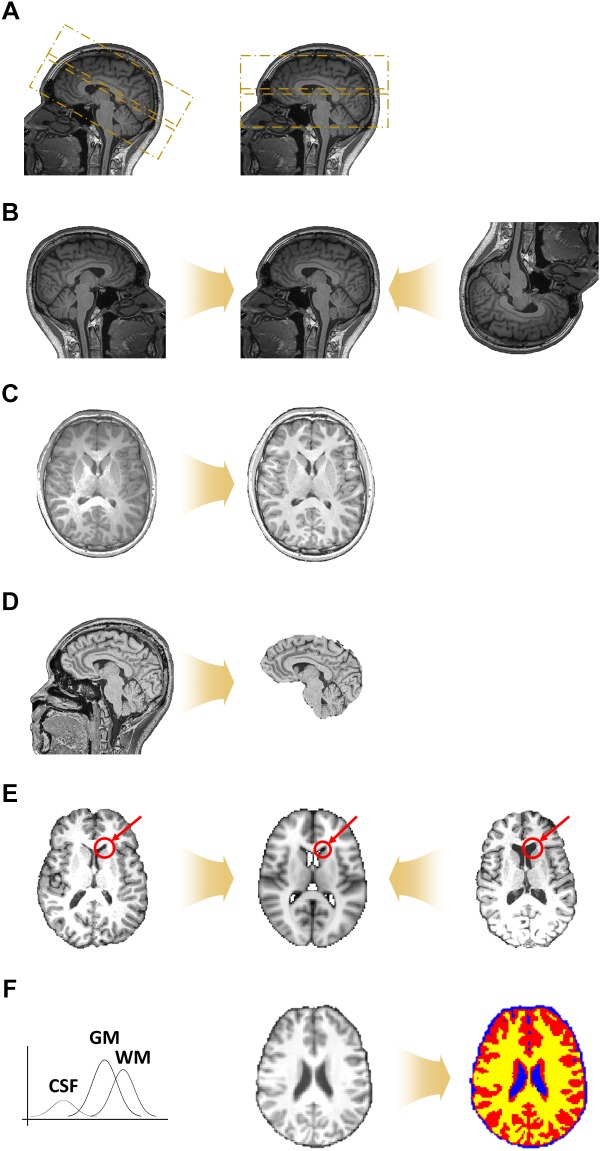
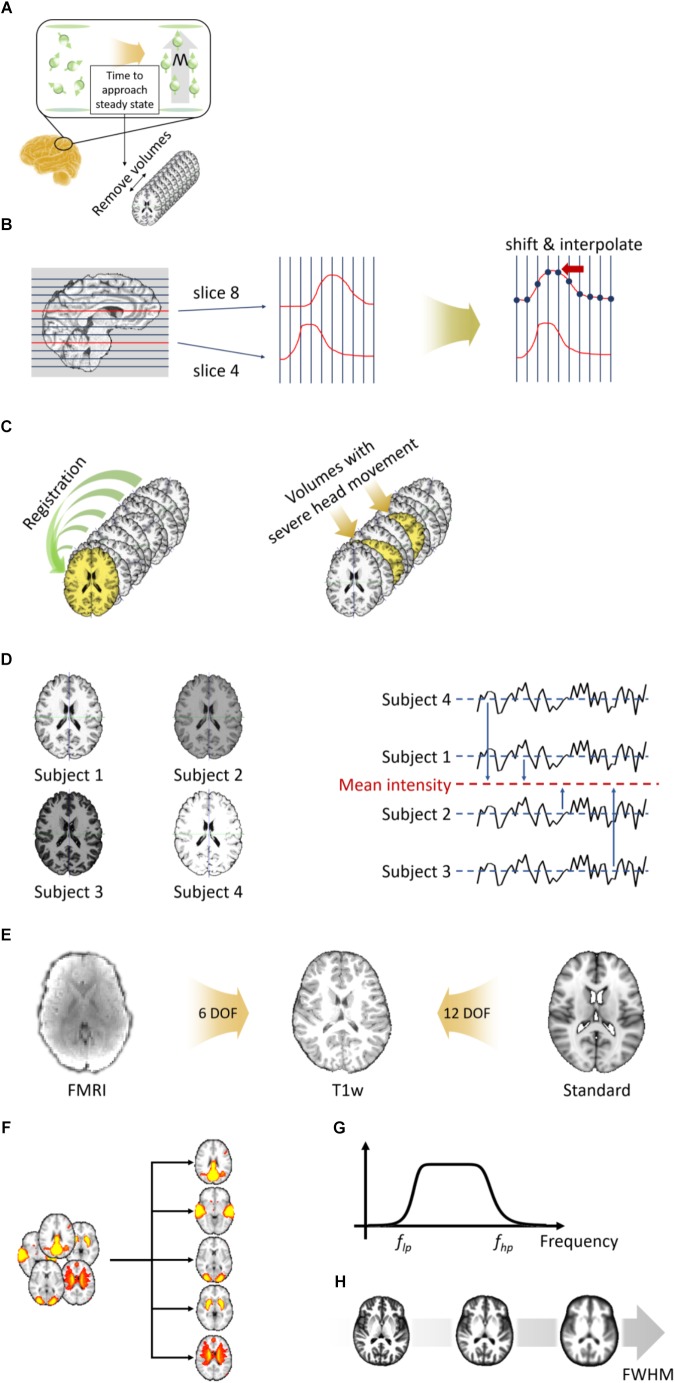
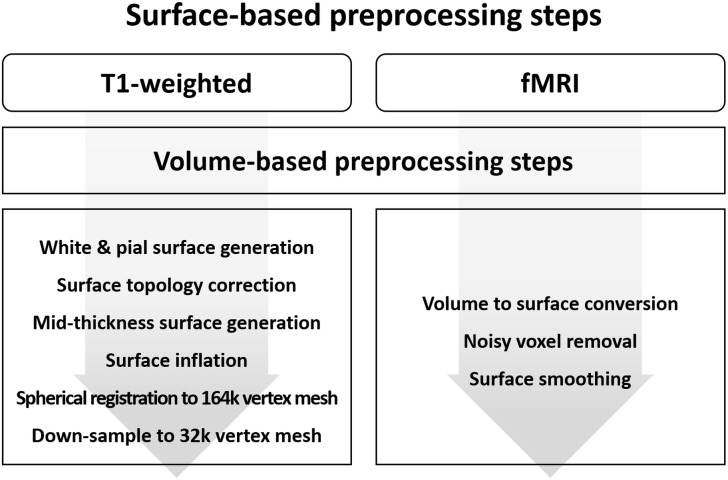
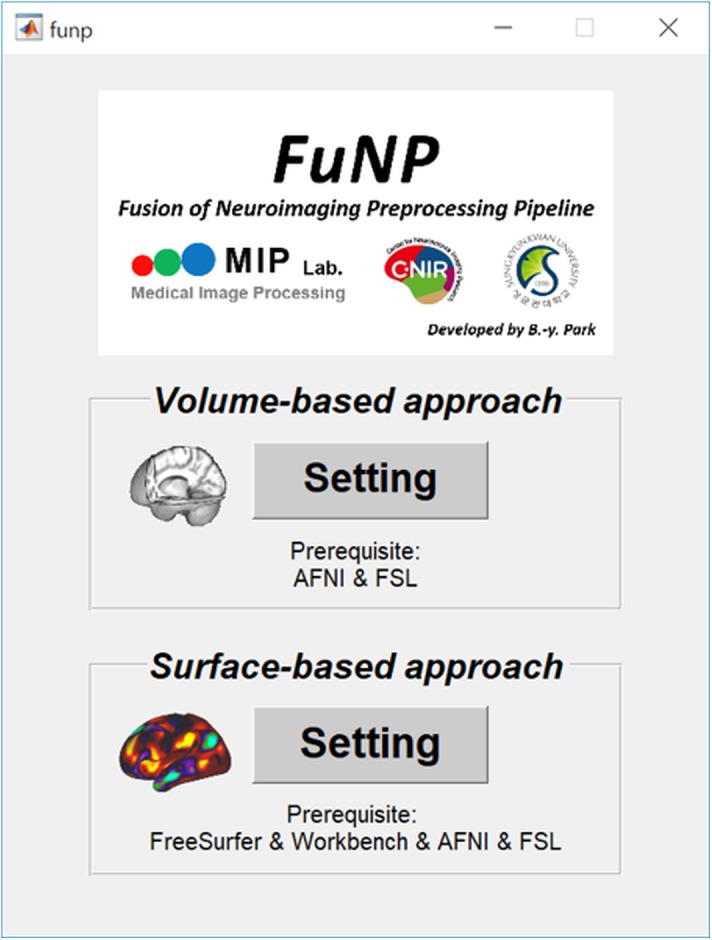
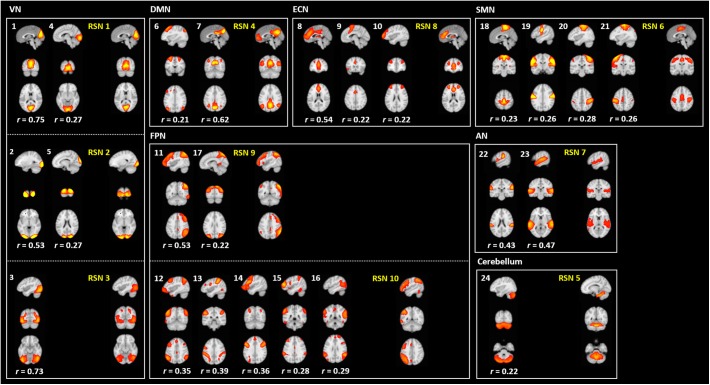
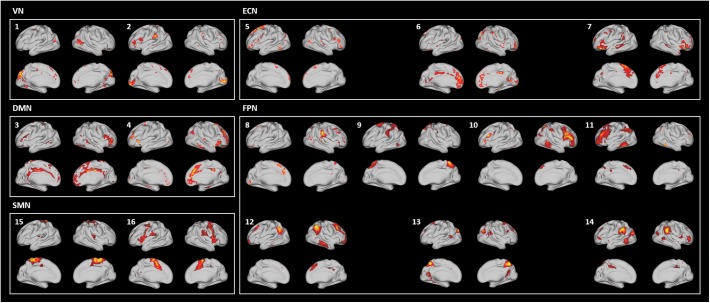
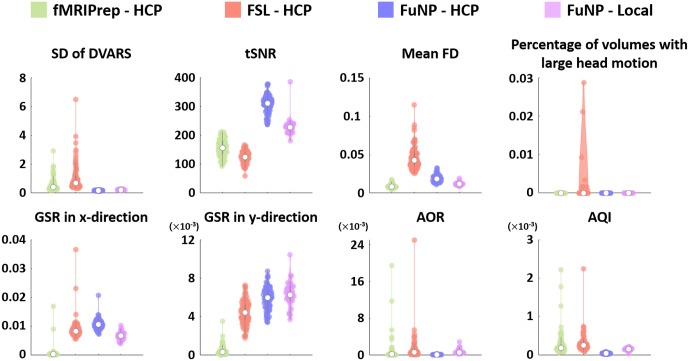
The preprocessing of functional magnetic resonance imaging (fMRI) data is necessary to remove unwanted artifacts and transform the data into a standard format. There are several neuroimaging data processing tools that are widely used, such as SPM, AFNI, FSL, FreeSurfer, Workbench, and fMRIPrep. Different data preprocessing pipelines yield differing results, which might reduce the reproducibility of neuroimaging studies. Here, we developed a preprocessing pipeline for T1-weighted structural MRI and fMRI data by combining components of well-known software packages to fully incorporate recent developments in MRI preprocessing into a single coherent software package. The developed software, called FuNP (Fusion of Neuroimaging Preprocessing) pipelines, is fully automatic and provides both volume- and surface-based preprocessing pipelines with a user-friendly graphical interface. The reliability of the software was assessed by comparing resting-state networks (RSNs) obtained using FuNP with pre-defined RSNs using open research data (n = 90). The obtained RSNs were well-matched with the pre-defined RSNs, suggesting that the pipelines in FuNP are reliable. In addition, image quality metrics (IQMs) were calculated from the results of three different software packages (i.e., FuNP, FSL, and fMRIPrep) to compare the quality of the preprocessed data. We found that our FuNP outperformed other software in terms of temporal characteristics and artifacts removal. We validated our pipeline with independent local data (n = 28) in terms of IQMs. The IQMs of our local data were similar to those obtained from the open research data. The codes for FuNP are available online to help researchers.
Keywords: data preprocessing; fully automated software; functional magnetic resonance imaging; fusion of existing software; volume- and surface-based preprocessing.
Figures
Similar articles
-
fMRIflows: A Consortium of Fully Automatic Univariate and Multivariate fMRI Processing Pipelines.Brain Topogr. 2023 Mar;36(2):172-191. doi: 10.1007/s10548-022-00935-8. Epub 2022 Dec 27. Brain Topogr. 2023. PMID: 36575327 Free PMC article.
-
NeuroPycon: An open-source python toolbox for fast multi-modal and reproducible brain connectivity pipelines.Neuroimage. 2020 Oct 1;219:117020. doi: 10.1016/j.neuroimage.2020.117020. Epub 2020 Jun 6. Neuroimage. 2020. PMID: 32522662
-
A Java-based fMRI processing pipeline evaluation system for assessment of univariate general linear model and multivariate canonical variate analysis-based pipelines.Neuroinformatics. 2008 Summer;6(2):123-34. doi: 10.1007/s12021-008-9014-1. Epub 2008 May 28. Neuroinformatics. 2008. PMID: 18506642
-
ENIGMA HALFpipe: Interactive, reproducible, and efficient analysis for resting-state and task-based fMRI data.Hum Brain Mapp. 2022 Jun 15;43(9):2727-2742. doi: 10.1002/hbm.25829. Epub 2022 Mar 19. Hum Brain Mapp. 2022. PMID: 35305030 Free PMC article. Review.
-
Cerebral MRI in a prospective cohort study on depression and atherosclerosis: the BiDirect sample, processing pipelines, and analysis tools.Eur Radiol Exp. 2024 Feb 9;8(1):16. doi: 10.1186/s41747-023-00415-z. Eur Radiol Exp. 2024. PMID: 38332362 Free PMC article. Review.
Cited by
-
Structural connectome manifold changes related to body mass index and their associations with eating psychopathology.Neuroimage Clin. 2025 Jun 5;47:103817. doi: 10.1016/j.nicl.2025.103817. Online ahead of print. Neuroimage Clin. 2025. PMID: 40489918 Free PMC article.
-
Population receptive fields of human primary visual cortex organised as DC-balanced bandpass filters.Sci Rep. 2021 Nov 17;11(1):22423. doi: 10.1038/s41598-021-01891-2. Sci Rep. 2021. PMID: 34789812 Free PMC article.
-
Normalization Strategies in Multi-Center Radiomics Abdominal MRI: Systematic Review and Meta-Analyses.IEEE Open J Eng Med Biol. 2023 Apr 28;4:67-76. doi: 10.1109/OJEMB.2023.3271455. eCollection 2023. IEEE Open J Eng Med Biol. 2023. PMID: 37283773 Free PMC article.
-
Alterations in the functional MRI-based temporal brain organisation in individuals with obesity.Diabetes Obes Metab. 2025 Sep;27(9):5135-5146. doi: 10.1111/dom.16565. Epub 2025 Jun 25. Diabetes Obes Metab. 2025. PMID: 40566750 Free PMC article.
-
The evolution of Big Data in neuroscience and neurology.J Big Data. 2023;10(1):116. doi: 10.1186/s40537-023-00751-2. Epub 2023 Jul 10. J Big Data. 2023. PMID: 37441339 Free PMC article.
References
-
- Bijsterbosch J., Smith S. M., Beckmann C. F. (2017). Introduction to Resting State fMRI Functional Connectivity. Oxford: Oxford University Press.
Grants and funding
LinkOut - more resources
Full Text Sources