. 2019 Feb 5:10:27.
doi: 10.3389/fphar.2019.00027. eCollection 2019.

Ferulic Acid Protects Hyperglycemia-Induced Kidney Damage by Regulating Oxidative Insult, Inflammation and Autophagy

Affiliations

Ferulic Acid Protects Hyperglycemia-Induced Kidney Damage by Regulating Oxidative Insult, Inflammation and Autophagy

Sayantani Chowdhury et al. Front Pharmacol. .

Abstract

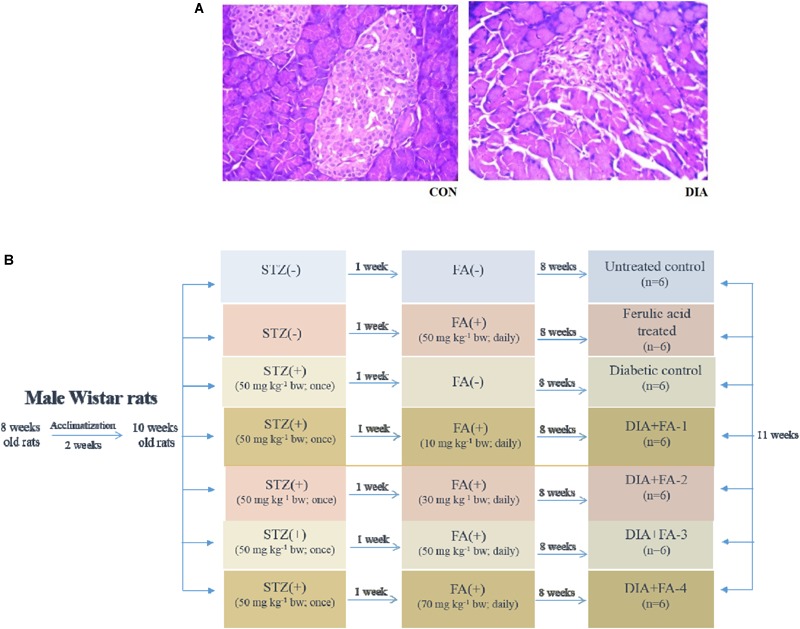
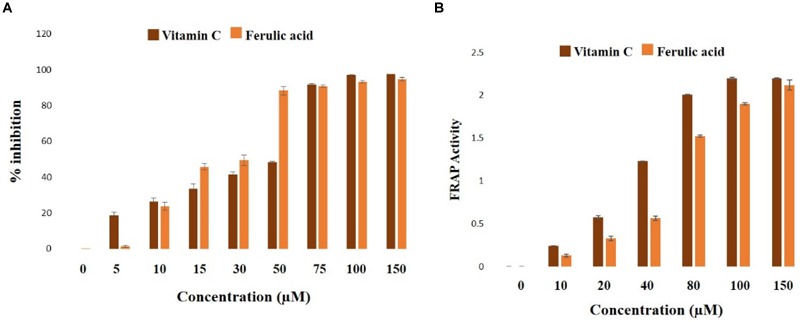
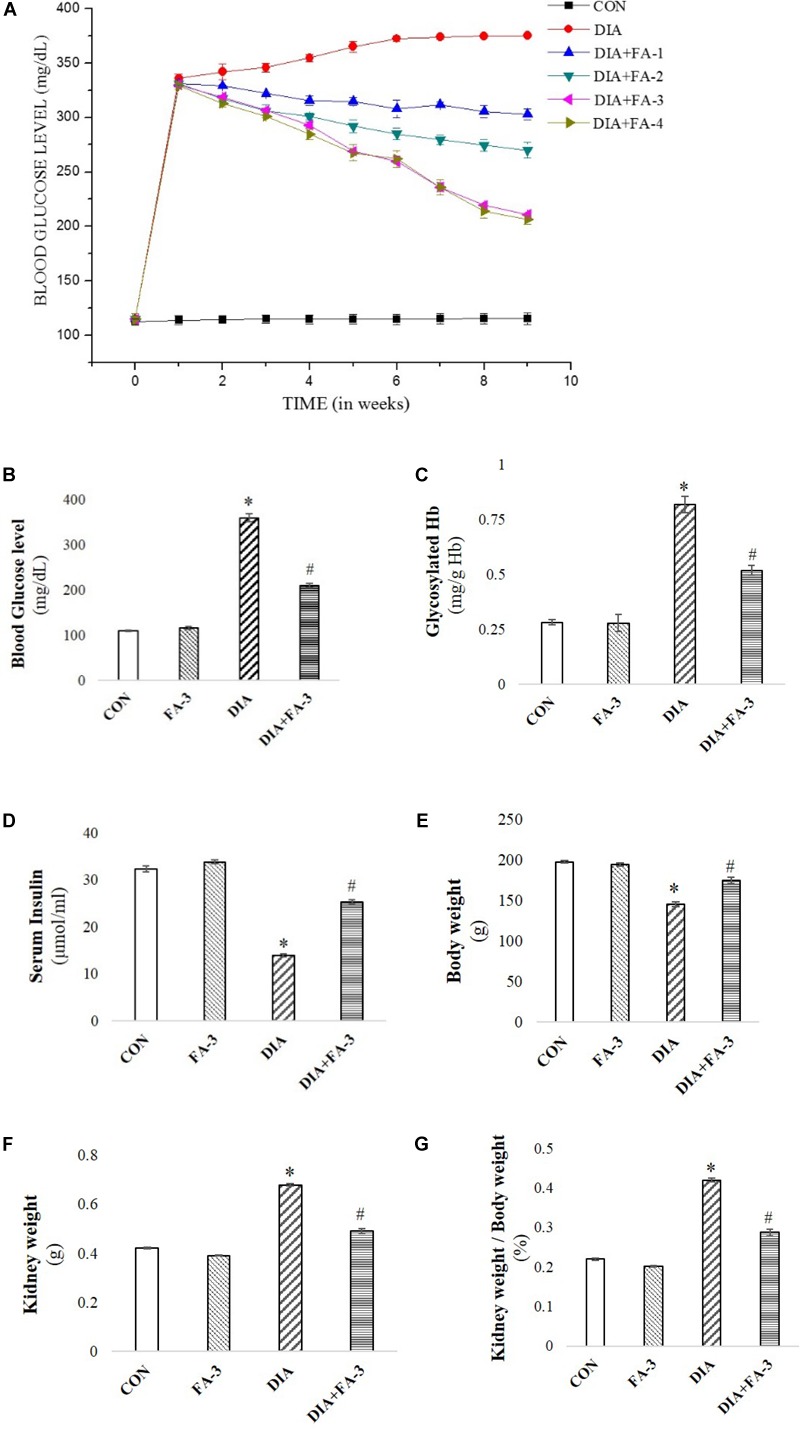
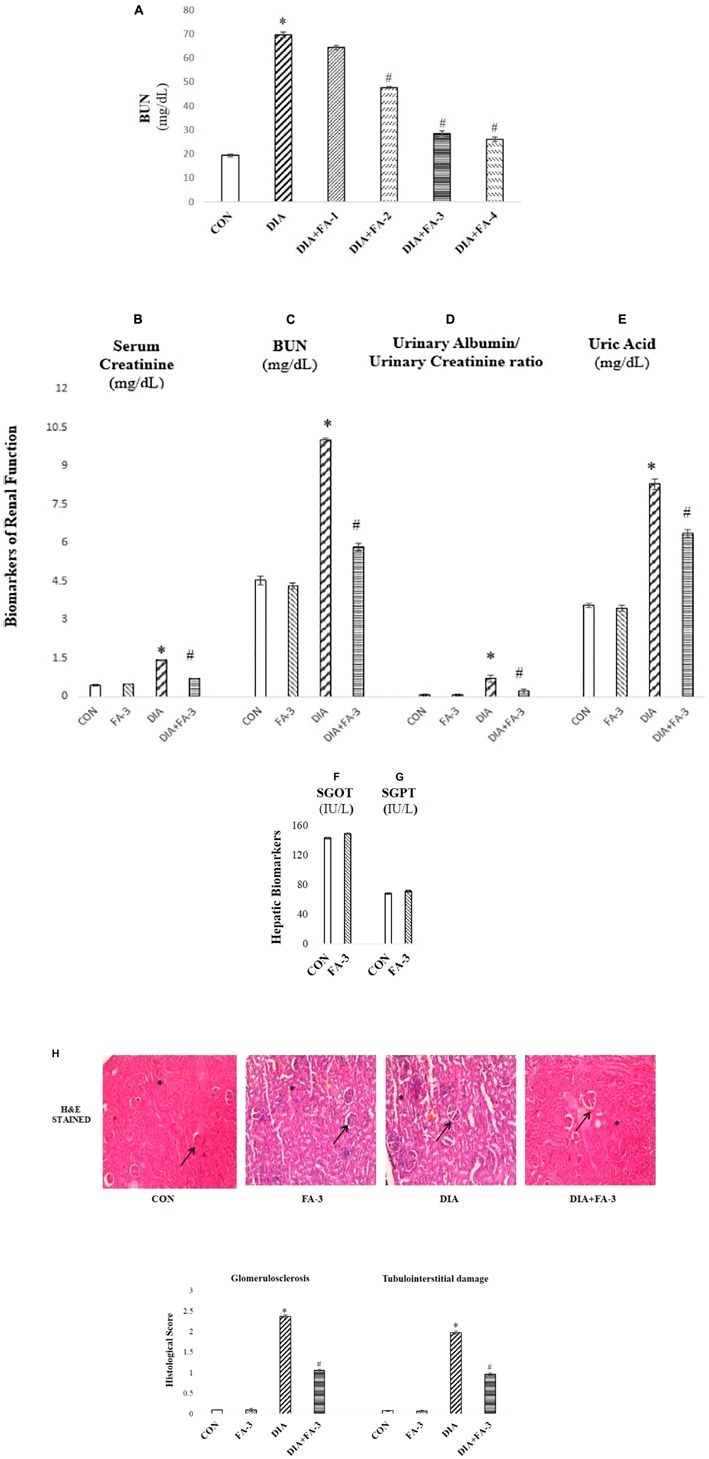
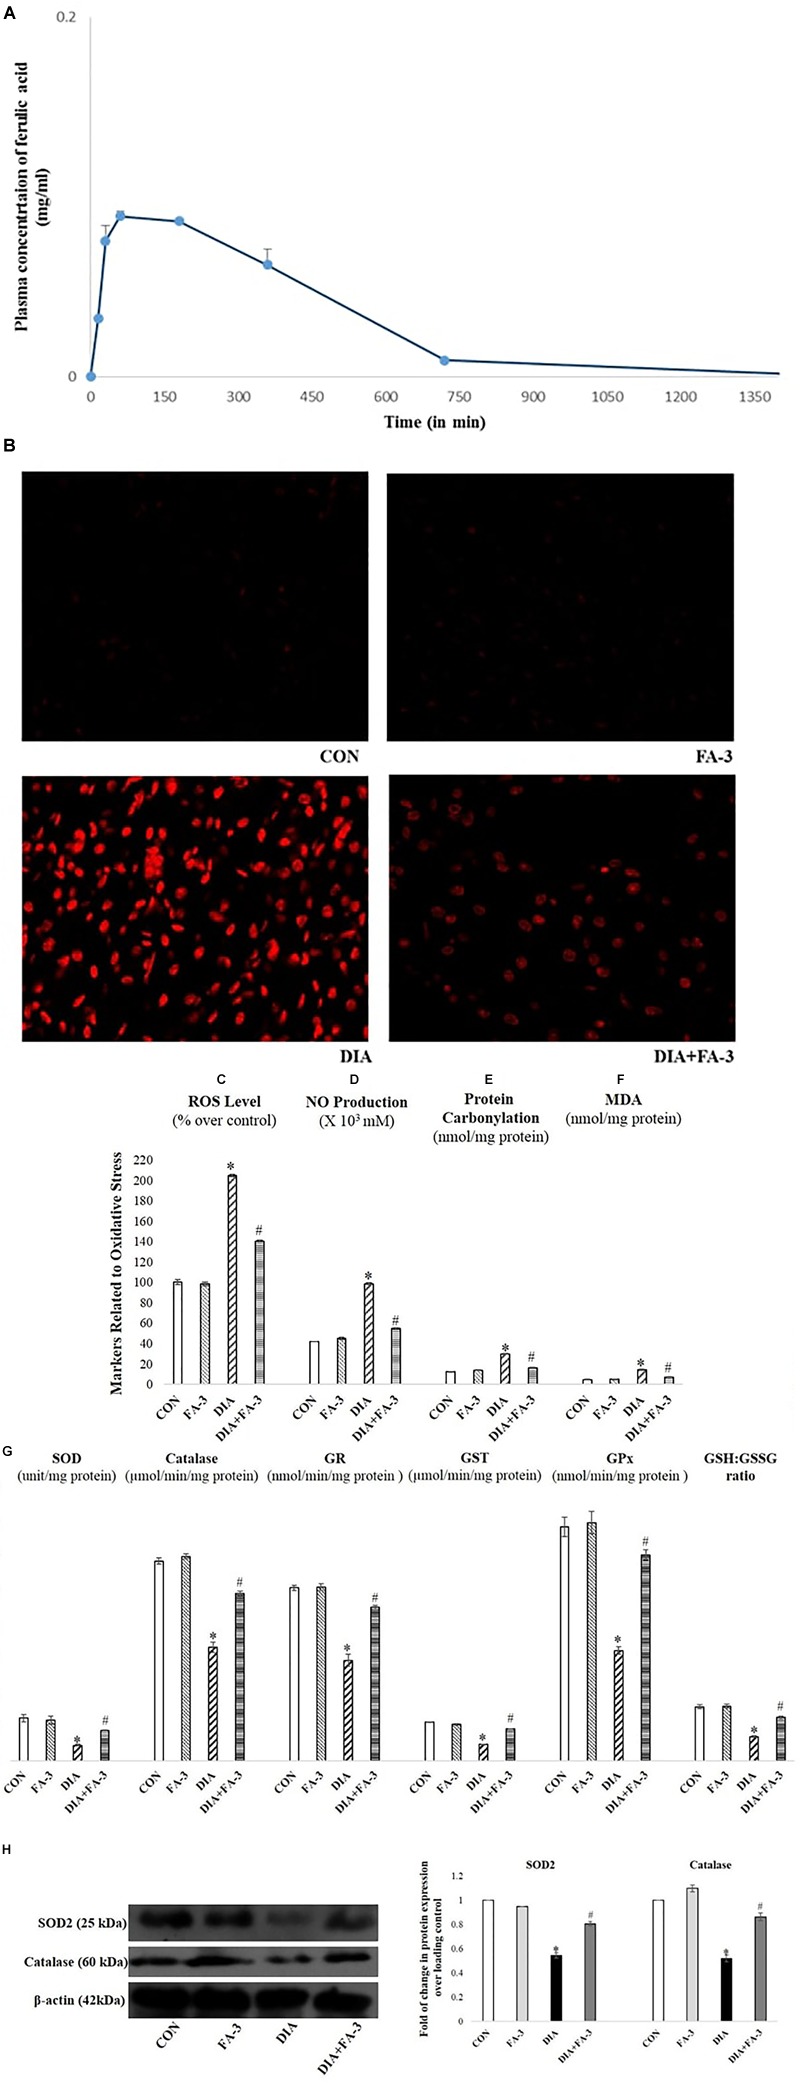
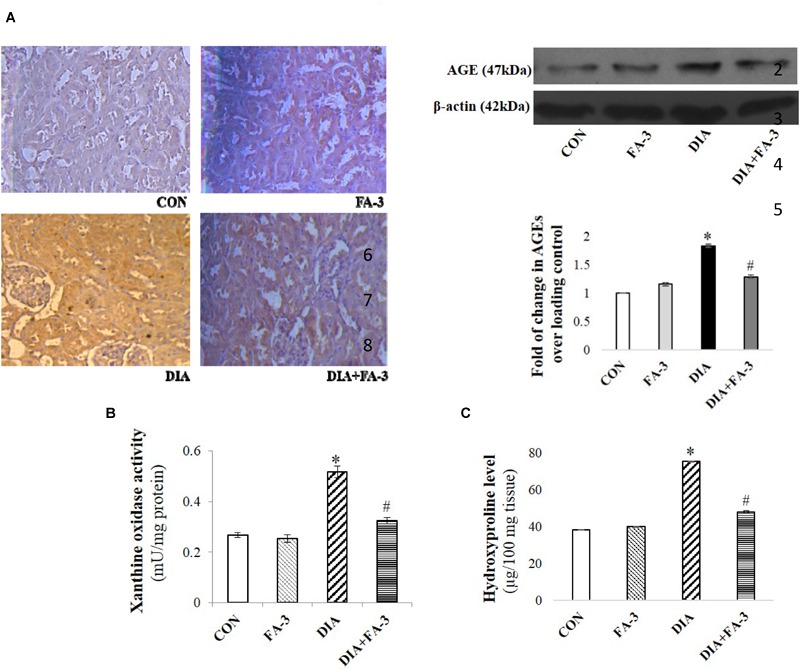
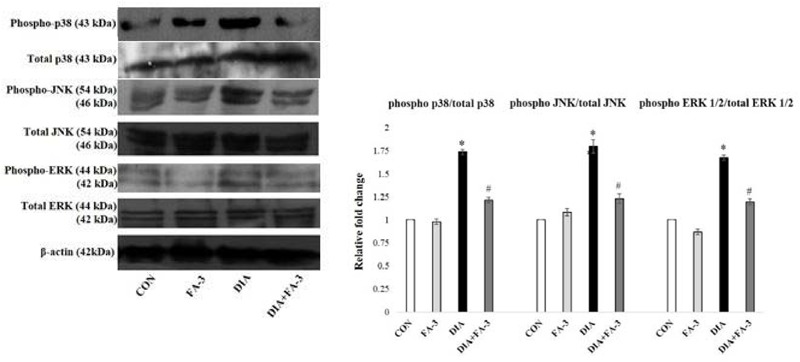
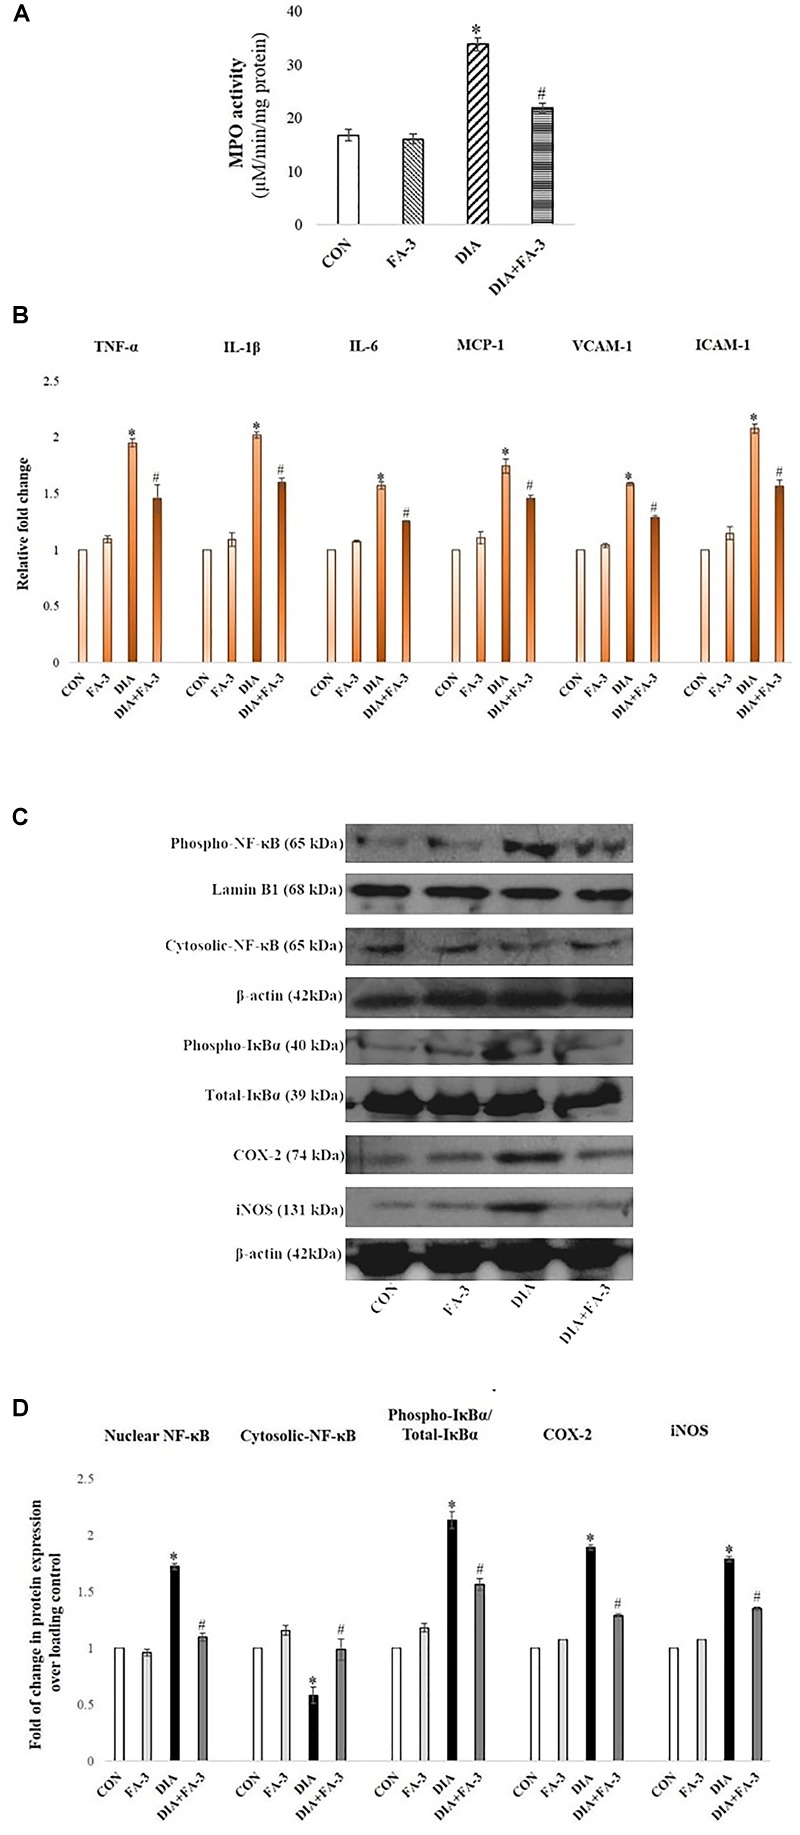
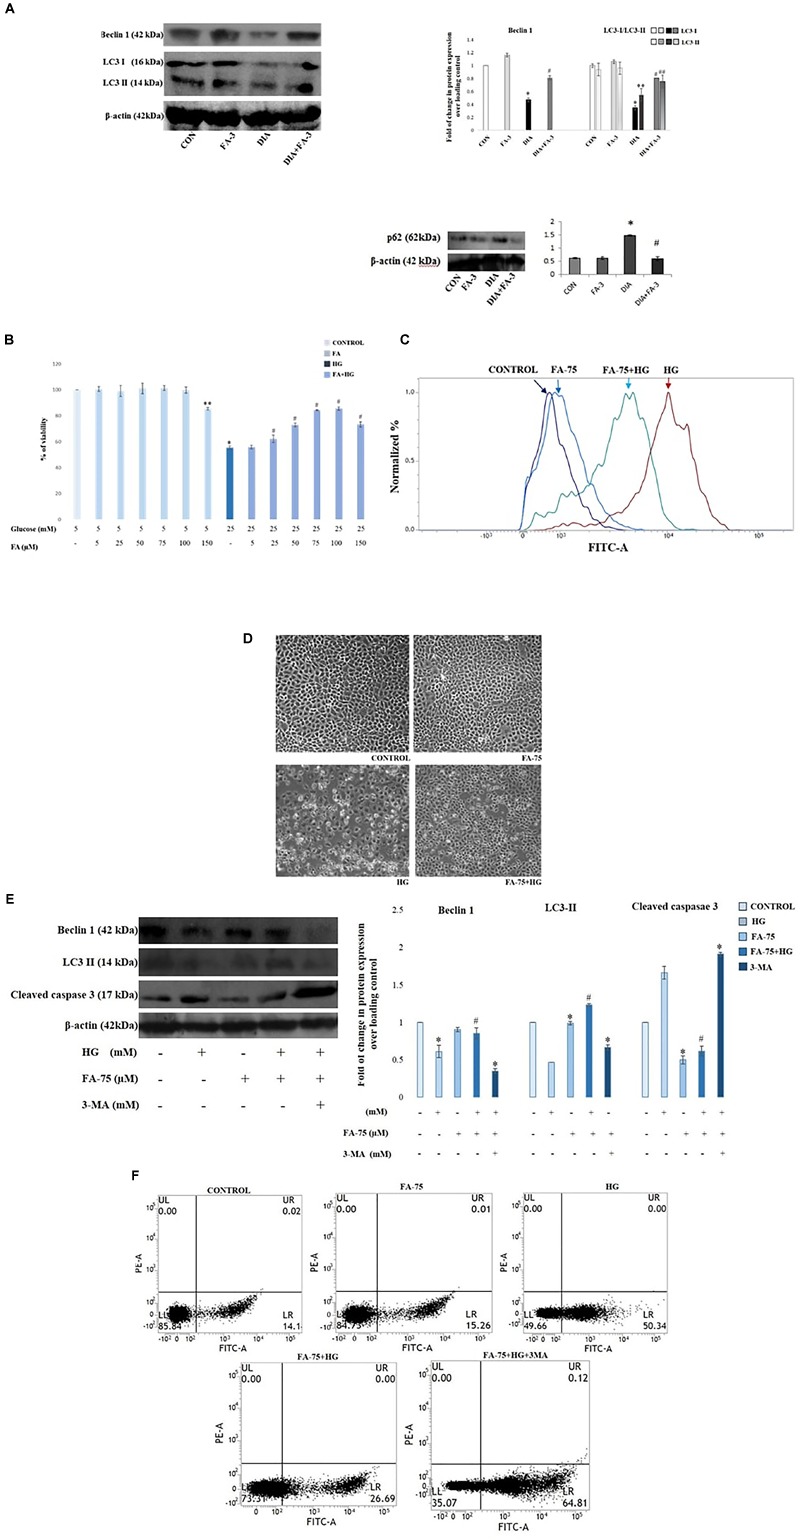
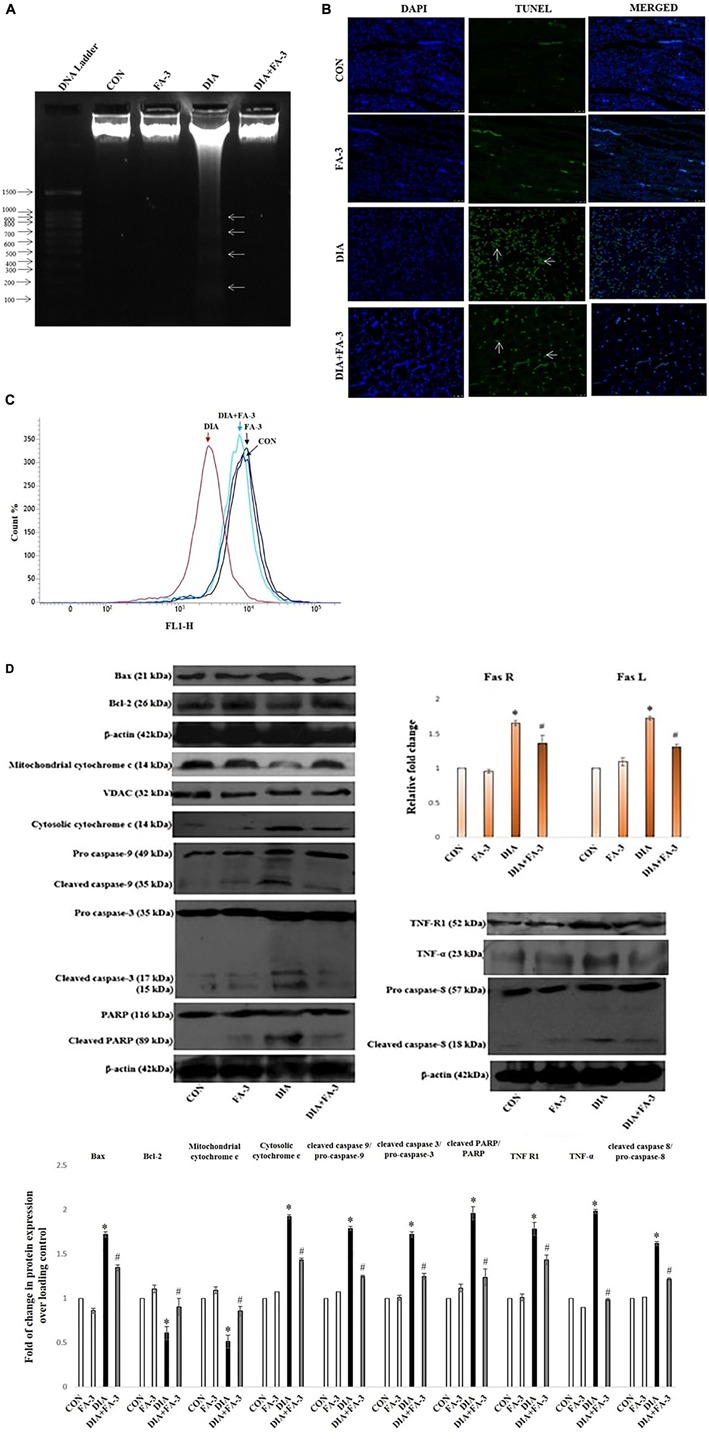
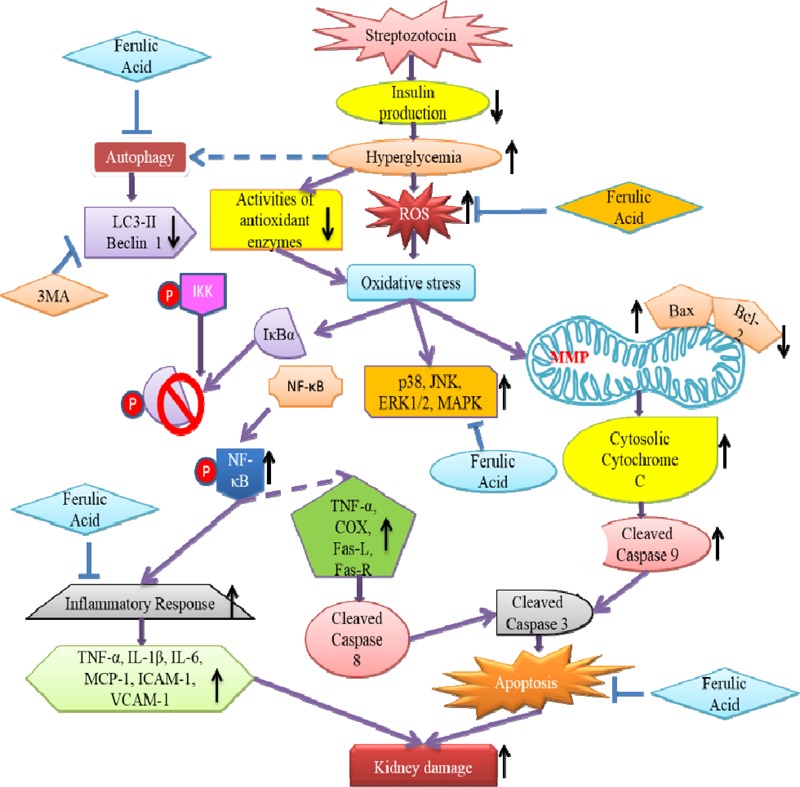
Oxidative insult, inflammation, apoptosis and autophagy play a pivotal role in the etiology of diabetic nephropathy, a global health concern. Ferulic acid, a phytochemical, is reported to protect against varied diseased conditions. However, the ameliorative role and mechanisms of ferulic acid in averting STZ-mediated nephrotoxicity largely remains unknown. For in vivo study, a single intraperitoneal injection of streptozotocin (50 mg kg-1 body wt.) was administered in experimental rats to induce diabetes. The diabetic rats exhibited a rise in blood glucose level as well as kidney to body weight ratio, a decrease in serum insulin level, severe kidney tissue damage and dysfunction. Elevation of intracellular ROS level, altered mitochondrial membrane potential and cellular redox balance impairment shown the participation of oxidative stress in hyperglycemia-triggered renal injury. Treatment with ferulic acid (50 mg kg-1 body wt., orally for 8 weeks), post-diabetic induction, could markedly ameliorate kidney injury, renal cell apoptosis, inflammation and defective autophagy in the kidneys. The underlying mechanism for such protection involved the modulation of AGEs, MAPKs (p38, JNK, and ERK 1/2), NF-κB mediated inflammatory pathways, mitochondria-dependent and -independent apoptosis as well as autophagy induction. In cultured NRK-52E cells, ferulic acid (at an optimum dose of 75 μM) could counter excessive ROS generation, induce autophagy and inhibit apoptotic death of cells under high glucose environment. Blockade of autophagy could significantly eradicate the protective effect of ferulic acid in high glucose-mediated cell death. Together, the study confirmed that ferulic acid, exhibiting hypoglycemic, antioxidant, anti-inflammatory, anti-apoptotic activities and role in autophagy, could circumvent oxidative stress-mediated renal cell damage.

Keywords: apoptosis; autophagy; diabetes; ferulic acid; inflammation; kidney; oxidative stress.


Figures

FIGURE 1
FIGURE 1
Validation of diabetes induction and schematic representation of in vivo experimental design. (A) Hematoxylin-eosin staining of sections of rat pancreas (×200); CON: received only vehicle, i.e., water; DIA: a single dose of STZ was given (50 mg kg-1 body wt., intraperitoneally). The non-diabetic animals showed a regular healthy pancreas structure whereas; the pancreas of diabetic rats showed degeneration as well as shrinkage of islets, thereby confirming diabetes induction; (B) in vivo study design.
FIGURE 2
FIGURE 2
Biochemical properties of ferulic acid in the cell-free system. (A) Radical scavenging activities of DPPH (represented as the percentage of inhibition over control) of ferulic acid and Vitamin C; (B) FRAP assay depicting the ferric reducing capacity of ferulic acid and Vitamin C. Data are denoted as the mean ± SEM of three independent experiments.
FIGURE 3
FIGURE 3
Effect of STZ and ferulic acid on the markers of the diabetic pathophysiology. (A) Effect of ferulic acid on blood glucose level of STZ-triggered diabetic rats in both dose-dependent and time-dependent manner. CON: level of blood glucose on untreated rats; STZ: blood glucose level of STZ-induced rats; DIA + FA-1, DIA + FA-2, DIA + FA-3, DIA + FA-4: the level of blood glucose of ferulic acid-treated diabetic rats at a dose of 10, 30, 50, and 70 mg kg-1 body wt. respectively for 8 weeks; (B) blood glucose level; (C) glycosylated Hb; (D) serum insulin level, (E) absolutebody weight of experimental rats, (F) absolute kidney weight, and (G) kidney-to-body weight ratio of experimental animals. CON: rats treated with vehicle only; FA-3: rats were subjected to only ferulic acid treatment at a dose of 50 mg kg-1; STZ: diabetic control; STZ + FA-3: diabetic rats were subjected to ferulic acid treatment at a dose of 50 mg kg-1. Values are represented as mean ± SEM (six animals in each experimental groups) for three independent experiments. “” symbolizes values differing from CON (P < 0.05) significantly; “#” denotes values differing from DIA (#P < 0.05) significantly; no significant variance existed between untreated (CON) and ferulic acid treated (FA-3) groups.
FIGURE 4
FIGURE 4
The role of ferulic acid on STZ-mediated nephrotoxicity in type 1 diabetic rats. (A) Effect of ferulic acid on the level of BUN in serum alongside STZ mediated toxicity in the renal tissue of the experimental rats in a dose-dependent manner. CON: BUN level in rats treated with vehicle only; STZ: BUN level in STZ induced diabetic rats; STZ+FA-10, STZ+FA-30, STZ+FA-50, STZ+FA-70: BUN level in ferulic acid treated diabetic rats for 8 weeks at varied doses viz. 10, 30, 50, and 70 mg kg-1 body wt. respectively; (B) serum creatinine level; (C) BUN level; (D) urinary albumin/urinary creatinine ratio; (E) level of uric acid; (F) SGOT level; (G) SGPT level; (H) Histological examination. H&E staining of sections of kidney tissues of rats; ×200 and histological score. CON: rats receiving vehicle only; FA-3: only ferulic acid treated rats (dose: 50 mg kg-1 body wt.); STZ: receiving STZ (50 mg kg-1 body wt.); STZ+ FA-3: post-diabetic induction, rats treated with ferulic acid (dose: 50 mg kg-1 body wt.). Values are represented as mean ± SEM (six animals in each experimental groups) for three different experiments. “” symbolizes values differing from CON (P < 0.05) significantly; “#” denotes values differing from DIA (#P < 0.05) significantly; no significant variance existed between untreated (CON) and ferulic acid treated (FA-3) groups.
FIGURE 5
FIGURE 5
(A) Mean plasma concentration-time profiles succeeding oral administration of ferulic acid (50 mg kg-1 body wt.); each point represents the mean ± SD. Role of ferulic acid on parameters related to oxidative insult. (B) Detection of ROS by DHE staining (×400); (C) ROS level; (D) NO production; (E) protein carbonylation; (F) lipid peroxidation (MDA); (G) activities of antioxidant enzymes and assessment of redox ratio (GSH/GSSG); (H) assessment of SOD2 and catalase expression through western blot analysis and respective densitometry analysis of the same in the kidney tissue of the experimental rats. CON: untreated rats; FA-3: rats were subjected to ferulic acid treatment only; STZ: diabetic control; STZ+FA-3: rats administered with ferulic acid, post diabetes. Densitometry analysis are denoted as the mean ± SEM of three independent experiments, P < 0.05 vs. CON; #P < 0.05 vs. DIA; no significant difference existed between CON and FA-3 groups.
FIGURE 6
FIGURE 6
Effects of ferulic acid on STZ-mediated AGEs expression as well as hydroxyproline levels and xanthine oxidase. (A) IHC micrograph (×200) as well as western blot and densitometric analysis of the same showing changes in the expression of AGEs over different experimental groups; (B) xanthine oxidase level and (C) hydroxyproline content. Data represent mean ± SEM of three different experiments; “” indicates a significant difference between DIA and CON, whereas; “#” indicates a significant difference between DIA and DIA+FA-3; P < 0.05 vs. CON; #P < 0.05 vs. DIA; no significant difference existed between CON and FA-3 groups.
FIGURE 7
FIGURE 7
MAPKs activation in the STZ-mediated diabetic rats and effect of ferulic acid. Immunoblot analysis of phospho and total p38, phospho and total JNK, phospho and total ERK 1/2 and the densitometric analysis of the same. CON: only vehicle was given; FA-3: only ferulic acid was given; DIA: a single intraperitoneal dose of STZ was given; (DIA+FA-3): post-diabetes, treated with ferulic acid. Densitometry signifies mean ± SEM of three independent experiments, P < 0.05 vs. CON; #P < 0.05 vs. DIA; no significant difference existed between CON and FA-3.
FIGURE 8
FIGURE 8
Role of STZ and ferulic acid on MPO activity and NF-κB mediated inflammatory pathways. CON: vehicle treatment alone; FA-3: treatment with only ferulic acid; DIA: a single intraperitoneal dose of STZ administration; (DIA+FA-3): post-diabetic induction, treatment with ferulic acid. (A) MPO activity analyses in the kidney tissues of different experimental groups; (B) Real-time PCR of cytokines (TNF-α, IL-1β, IL-6), chemokines (MCP-1) and adhesion molecules (VCAM-1, ICAM-1) were executed in triplicate and the results were represented as the fold differences of target gene expression relative to that of the loading control; (C) Immunoblot and densitometric analyses of nuclear and cytosolic NF-κB, phospho- and total IκBα, COX-2 and iNOS in the kidney tissue of experimental animals. Data are signified as the mean ± SEM of three different experiments; no significant difference existed between CON and FA-3 groups; P < 0.05 vs. CON; #P < 0.05 vs. DIA.
FIGURE 9
FIGURE 9
Effect of ferulic acid on autophagy flux and oxidative insult-mediated apoptosis in hyperglycemia-induced nephrotoxicity in diabetic rats as well as high glucose-induced NRK-52E cells. CON: treated with vehicle only; FA-3: treatment with ferulic acid only; DIA: administration with a single STZ exposure; DIA+FA-3: treatment with ferulic acid following diabetic induction. (A) Western blot and densitometric analyses of beclin-1, LC3 II and p62 expressions in the kidney tissue of experimental rats; (B) Dose-dependent change in viability (represented in % over control) in NRK-52E cells following pretreatment with ferulic acid (0-150 μM) for 2 h and successive exposure to 25 mM of glucose for 48 h. CONTROL: refers to the vehicle (water) treated control group; HG: cells exposed to high glucose, i.e., 25 mM of glucose for 48 h; FA-75+HG: pre-incubation with 75 μM ferulic acid for 2 h followed by high glucose (25 mM) introduction for next 48 h; FA-75: incubation with only 75 μM of ferulic acid; FA-75 + HG + 3-MA: inhibitor exposed NRK-52E cells. (C) Detection of endogenous ROS level in NRK-52E cells; (D) phase contrast micrographs (×100) for different experimental groups depicting external morphology of cells; (E) Immunoblot analysis as well as densitometric analysis reflecting the expression of beclin-1, LC3 II and cleaved caspase 3 following autophagy inhibition by 3-MA; (F) FACS analyses with Annexin V staining to determne the percent of apoptotic cells in the different experimental groups. Quadrants: lower left represents live cells; lower right represents apoptotic cells; upper left represents necrotic cells. Data have been expressed as the mean ± SEM for three different experiments; P < 0.05 vs. control group; #P < 0.05 vs. DIA/HG; ∗∗P < 0.05 vs. CONTROL; ##P < 0.05 vs. HG; HG, high glucose.
FIGURE 10
FIGURE 10
Effect of ferulic acid on both mitochondria-dependent and -independent manner of cell death in hyperglycemia-induced renal injury. CON: untreated control rats, FA-3: rats were subjected to ferulic acid (50 mg kg-1 body wt.) treatment only, DIA: diabetic control group, DIA + FA-3: diabetic rats were subjected to ferulic acid (50 mg kg-1 body wt.) treatment. Mode of cell death: (A) DNA fragmentation assay on agarose/EtBr gel 1.8% (w/v) (arrows symbolises DNA fragments); (B) TUNEL assay of the kidney tissue of experimental rats. TUNEL-positive splenic cells are stained in green and the nuclei are stained in blue (with DAPI; ×400); (C) MMP analysis of different experimental groups by FACS; (D) Western blot and densitometric analyses of Bax, Bcl-2, mitochondrial cytochrome c, cytosolic cytochrome c, caspase 9, caspase 3, PARP, TNF R1, TNF-α, caspase 8 as well as real time PCR of Fas R and Fas L. Data are represented as the mean ± SEM for three independent experiments; P < 0.05 vs. control group; #P < 0.05 vs. diabetic group.
FIGURE 11
FIGURE 11
Schematic representation indicating the probable mechanisms through which ferulic acid provides protection against streptozotocin-triggered hyperglycemia-induced renal damage in rats; (“blunt arrows”: inhibitory interaction; “pointed arrows”: stimulatory interaction; “dotted arrows”: probable mechanisms).

Similar articles

Cited by

References

    1. Aziz M. T. A., El-Asmar M. F., El-Ibrashy I. N., Rezq A. M., Al-Malki A. L., Wassef M. A., et al. (2012). Effect of novel water soluble curcumin derivative on experimental type-1 diabetes mellitus (short term study). Diabetol. Metab. Syndr. 4:30. 10.1186/1758-5996-4-30 - DOI - PMC - PubMed
    1. Balasubashini M. S., Rukkumani R., Menon V. (2003). Protective effects of ferulic acid on hyperlipidemic diabetic rats. Acta Diabetol. 40 118–122. 10.1007/s00592-003-0099-6 - DOI - PubMed
    1. Barr C. C. (2001). Retinopathy and nephropathy in patients with type 1 diabetes four years after a trial of intensive insulin therapy, by The Diabetes Control and Complications Trial/Epidemiology of Diabetes Interventions and Complications Research Group. N. Engl. J. Med 342: 381-9, 2000. Surv. Ophthalmol. 45 459–460. 10.1016/S0039-6257(01)00187-4 - DOI - PubMed
    1. Beda N., Nedospasov A. (2005). A spectrophotometric assay for nitrate in an excess of nitrite. Nitric Oxide 13 93–97. 10.1016/j.niox.2005.05.002 - DOI - PubMed
    1. Benzie I. F., Strain J. J. (1996). The ferric reducing ability of plasma (FRAP) as a measure of “antioxidant power”: the FRAP assay. Anal. Biochem. 239 70–76. 10.1006/abio.1996.0292 - DOI - PubMed