. 2019 Feb 5:9:1553.
doi: 10.3389/fphar.2018.01553. eCollection 2018.

Angiotensin II-Regulated Autophagy Is Required for Vascular Smooth Muscle Cell Hypertrophy

Affiliations

Angiotensin II-Regulated Autophagy Is Required for Vascular Smooth Muscle Cell Hypertrophy

David Mondaca-Ruff et al. Front Pharmacol. .

Abstract

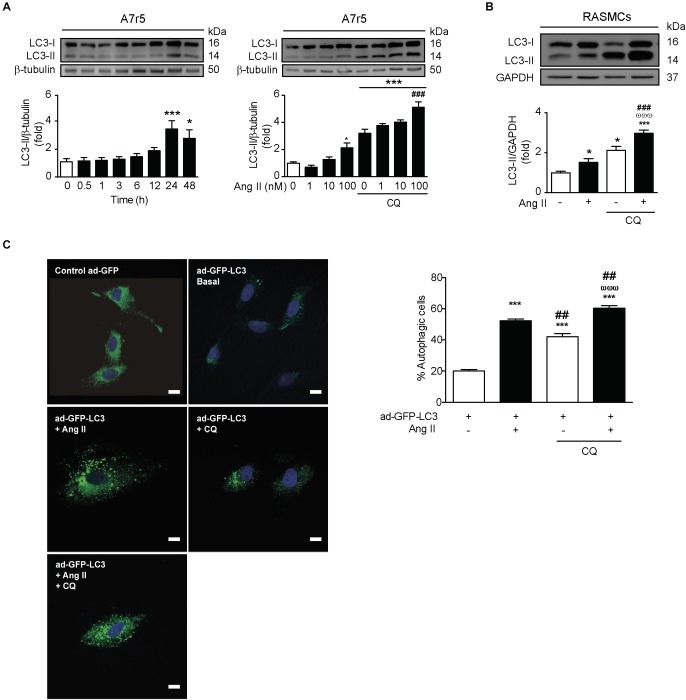
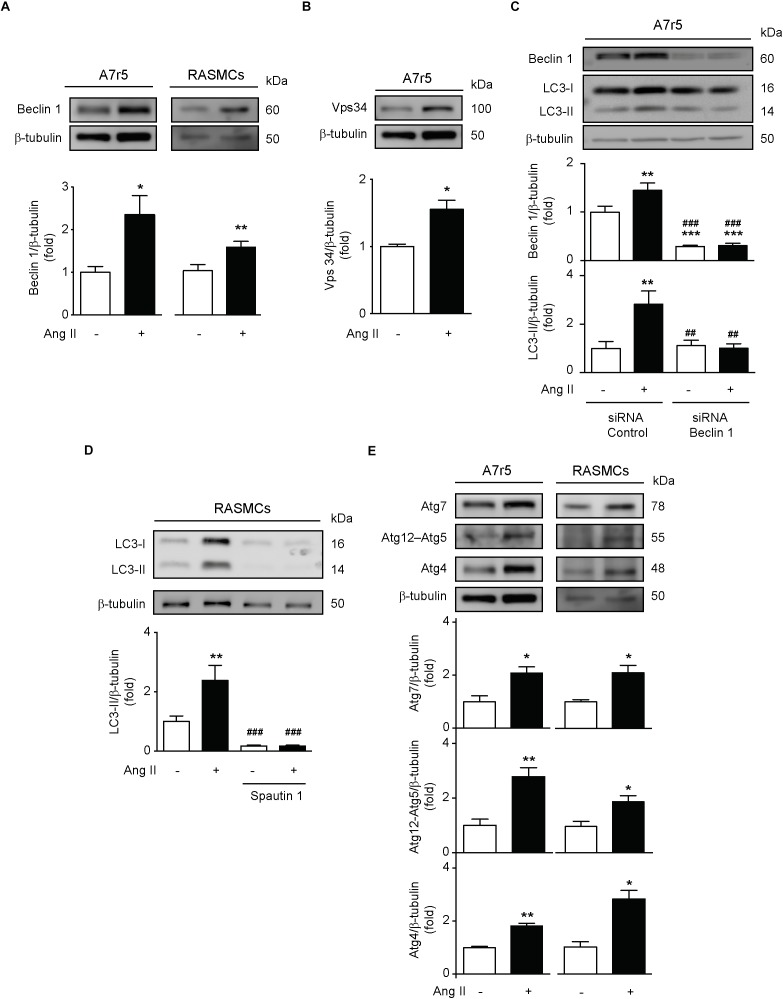
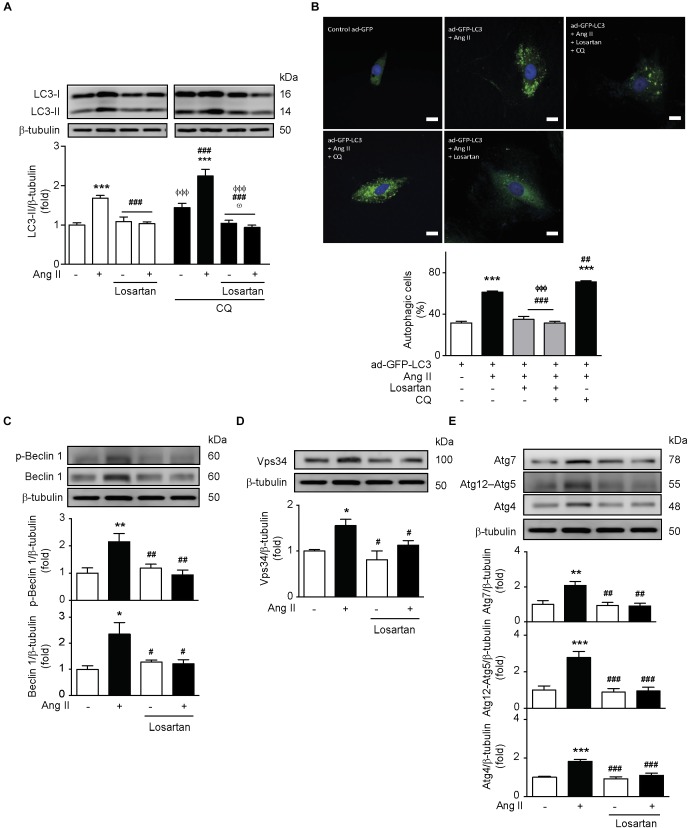
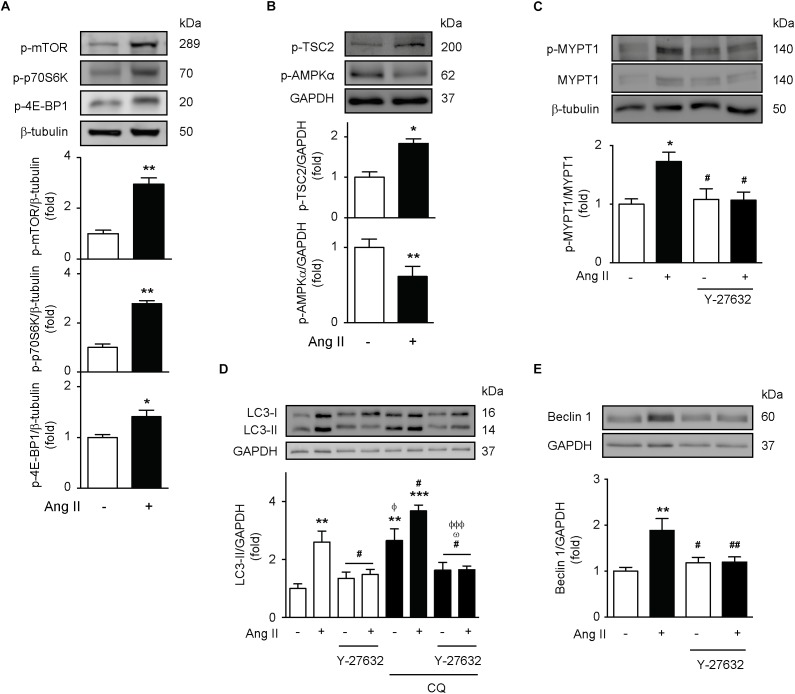
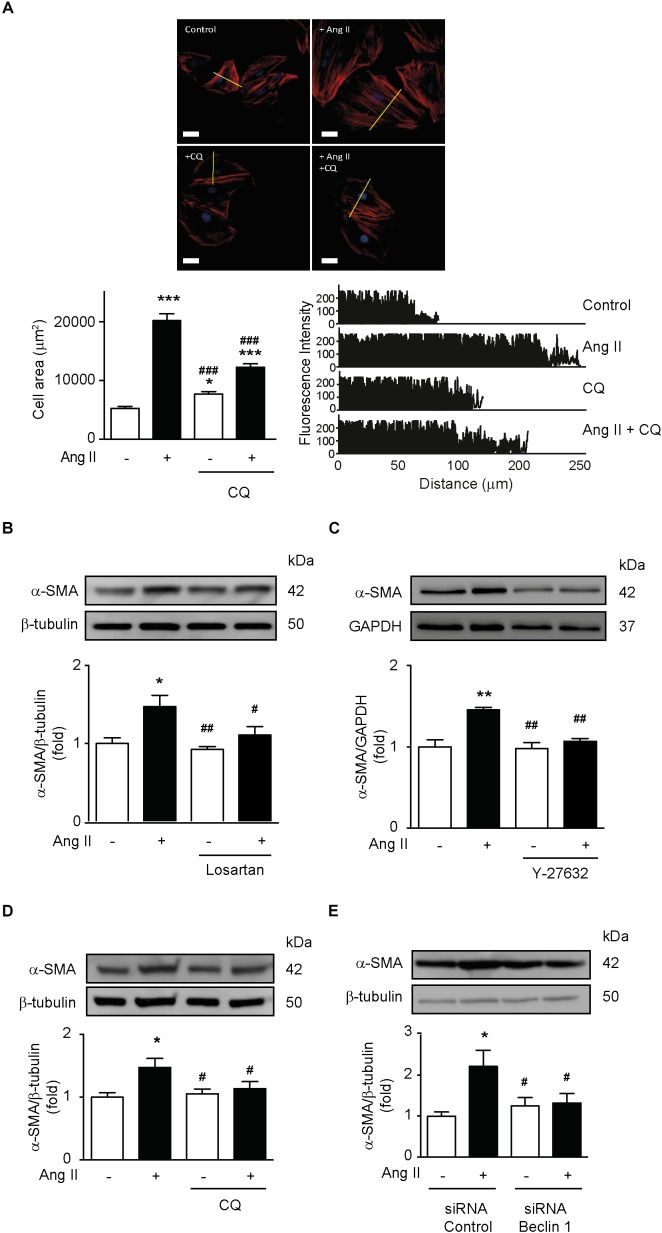
Hypertension is a disease associated to increased plasma levels of angiotensin II (Ang II). Ang II can regulate proliferation, migration, ROS production and hypertrophy of vascular smooth muscle cells (VSMCs). However, the mechanisms by which Ang II can affect VSMCs remain to be fully elucidated. In this context, autophagy, a process involved in self-digestion of proteins and organelles, has been described to regulate vascular remodeling. Therefore, we sought to investigate if Ang II regulates VSMC hypertrophy through an autophagy-dependent mechanism. To test this, we stimulated A7r5 cell line and primary rat aortic smooth muscle cells with Ang II 100 nM and measured autophagic markers at 24 h by Western blot. Autophagosomes were quantified by visualizing fluorescently labeled LC3 using confocal microscopy. The results showed that treatment with Ang II increases Beclin-1, Vps34, Atg-12-Atg5, Atg4 and Atg7 protein levels, Beclin-1 phosphorylation, as well as the number of autophagic vesicles, suggesting that this peptide induces autophagy by activating phagophore initiation and elongation. These findings were confirmed by the assessment of autophagic flux by co-administering Ang II together with chloroquine (30 μM). Pharmacological antagonism of the angiotensin type 1 receptor (AT1R) with losartan and RhoA/Rho Kinase inhibition prevented Ang II-induced autophagy. Moreover, Ang II-induced A7r5 hypertrophy, evaluated by α-SMA expression and cell size, was prevented upon autophagy inhibition. Taking together, our results suggest that the induction of autophagy by an AT1R/RhoA/Rho Kinase-dependent mechanism contributes to Ang II-induced hypertrophy in VSMC.

Keywords: AT1R; ROCK; VSMC; angiotensin II; autophagy; hypertrophy; losartan.


Figures

FIGURE 1
FIGURE 1
Ang II induces autophagy in A7r5 and RASMCs. (A) A7r5 cells were stimulated with Ang II 100 nM for 0, 0.5, 1, 3, 6, 12, 24, and 48 h (left panel) and with 1, 10, and 100 nM for 24 h, in presence and absence of CQ 30 μM, added for the last 4 h of stimulus (right panel). The LC3 II levels were determined by Western blot. The upper panels show the representative Western blots, whereas lower panels show the quantification of the LC3 II levels. β-Tubulin was used as loading control (n = 4–5). (B) Primary cultures of rat aortic VSMCs (RASMCs) were stimulated with 100 nM of Ang II for 24 h in the presence and absence of CQ 30 μM, added during the last 4 h of stimulus. LC3 II levels and autophagic flux were determined by Western blot. β-Tubulin was used as loading control (n = 4). (C) A7r5 cells were transduced with an adenovirus overexpressing LC3-GFP (ad-LC3-GFP), using a MOI of 180 and Hoechst as nuclear stain. After 24 h of incubation, cells were stimulated with 100 nM of Ang II for 24 h. During the last 4 h of stimulus, cells were then incubated in the presence or absence of 30 μM CQ. Representative images were obtained with a confocal microscope using a 40x lens and data are expressed percentage of autophagic cells (n = 3, 30 cells per n). Scale bar = 25 μm. The results are shown as mean ± SEM. Data were analyzed using ANOVA. Newman–Keuls was used as post hoc test. p < 0.05, ∗∗∗p < 0.001 vs. control; ##p < 0.01, ###p < 0.001 vs. Ang II 100 nM, ωωωp < 0.001 vs. CQ.
FIGURE 2
FIGURE 2
Ang induces phagophore initiation and elongation in A7r5 and RASMCs. (A) A7r5 and RASMCs cells were stimulated with Ang II 100 nM for 24 h. Protein levels of Beclin 1 were determined by Western blot in A7r5 and RASMCs and were normalized by β-tubulin (n = 4–5). (B) A7r5 cells were stimulated with Ang II 100 nM for 24 h and Vps34 levels were measured by Western blot and normalized to β-tubulin (n = 3). (C) A7r5 cells were transfected with 100 nM of siRNA against Beclin 1 for 6 h and incubated in DMEM with 2% of FBS for 16 h. Then, cells were stimulated with Ang II 100 nM for 24 h and protein levels of Beclin 1 and LC3 II were evaluated by Western blot and normalized by β-tubulin (n = 5). (D) Primary culture of RASMCs were pre-treated with Spautin 1, 10 μM, 1 h before the stimulation with Ang II 100 nM for 24 h. LC3 II levels were determined by Western blot and normalized by β-tubulin (n = 4). (E) A7r5 and RASMCs cells were stimulated with Ang II 100 nM for 24 h and protein levels of Atg7, Atg12–Atg5, and Atg4 were determined by Western blot and normalized by β-tubulin. Data were analyzed using Student’s t-test or one way ANOVA followed by Newman–Keuls post hoc test. Results are shown as mean ± SEM, n = 3–5. p < 0.05, ∗∗p < 0.01, ∗∗∗p < 0.001 vs. control; ##p < 0.01, ###p < 0.001 vs. Ang II.
FIGURE 3
FIGURE 3
Ang II induces autophagy through an AT1R-dependent mechanism. (A) A7r5 cells were pre-treated with Losartan 1 μM 1 h before stimulation with Ang II 100 nM for 24 h. During the last 4 h of stimulus, cells were also treated in the presence and absence of CQ 30 μM. LC3-II levels were determined by Western blot and normalized by β-tubulin (n = 5). (B) A7r5 cells were transduced with an adenovirus overexpressing LC3-GFP (ad-LC3-GFP), using an MOI of 180. After 24 h of incubation, cells were pretreated with losartan 1 μM, 1 h before stimulation with Ang II 100 nM for 24 h. During the last 4 h of stimulus with Ang II, cells were incubated in the presence or absence of CQ 30 μM. The nucleus were stained with Hoechst. Cells were visualized by confocal microscopy. The images are representative of n = 3, 30 cells per n. Scale bar = 25 μm. (C) A7r5 cells were pre-treated with losartan 1 μM, 1 h before stimulation with Ang II 100 nM for 24 h. Levels of Beclin 1 and its phosphorylation in Thr119 (p-Beclin 1) were determined by Western blot and normalized by β-tubulin (n = 4). (D) A7r5 cells were pretreated with losartan 1 μM, 1 h before stimulation with Ang II 100 nM for 24 h. Vps34 levels were determined by Western blot and normalized by β-tubulin (n = 3). (E) A7r5 cells were pretreated with losartan 1 μM, 1 h before stimulation with Ang II 100 nM for 24 h. Levels of Atg7, Atg12–Atg5, and Atg4 were determined by Western blot and normalized by β-tubulin (n = 4–5). The results are shown as mean ± SEM. Data were analyzed using one way ANOVA followed by Newman–Keuls post hoc test. p < 0.05, ∗∗p < 0.01, ∗∗∗p < 0.001 vs. control; #p < 0.05, ##p < 0.01, ###p < 0.001 vs. Ang II; ΦΦΦp < 0.001 vs. Ang II + CQ; ωp < 0.05 vs. CQ.
FIGURE 4
FIGURE 4
Ang II induces autophagy through a ROCK-dependent mechanism. (A,B) A7r5 cells were stimulated with 100 nM of Ang II for 24 h. Levels of p-mTOR Ser2448, p-p70S6K Thr389, p-4E-BP1 Thr37/46, p-TSC2 Thr1462, and p-AMPKα Thr172 were determined by Western blot and normalized by β-tubulin or GAPDH (n = 4–5). (C) A7r5 cells were pre-treated with Y-27632 (ROCK inhibitor, 10 μM), 1 h before stimulation with Ang II 100 nM for 24 h. ROCK activation levels were evaluated by MYPT1 phosphorylation in Thr853 assessed by Western blot. Protein levels were normalized by β-tubulin (n = 3). (D) A7r5 cells were pre-treated with 10 μM of Y-27632, 1 h before stimulation with Ang II 100 nM for 24 h. During the last 4 h of stimulus, cells were treated in the presence and absence of CQ 30 μM. LC3 II levels were determined by Western blot and normalized by GAPDH (n = 5). (E) A7r5 cells were pretreated with 10 μM of Y-27632, 1 h before stimulation with Ang II 100 nM for 24 h. Beclin 1 levels were determined by Western blot and normalized by GAPDH (n = 5). Results are shown as mean ± SEM. Data were analyzed using Student’s t-test or one way ANOVA followed by Newman–Keuls post hoc test. p < 0.05, ∗∗p < 0.01, ∗∗∗p < 0.001 vs. control; #p < 0.05, ##p < 0.01 vs. Ang II; Φp < 0.05, ΦΦΦp < 0.001 vs. Ang II + CQ; ωp < 0.05 vs. CQ.
FIGURE 5
FIGURE 5
Ang II-dependent autophagy elicits hypertrophy in VSMCs. (A) A7r5 cells were treated with or without Ang II 100 nM. During the last 4 h of stimulus, cells were treated in the presence and absence of CQ 30 μM. Then cells were stained with phalloidin–rhodamine and nuclei were stained with Hoechst. Images were captured using a confocal microscope using 40x lens. Cell area and fluorescence intensity were measured using the ImageJ software. n = 3,30 cells per condition. Scale bar = 25 μm. A7r5 cells were pre-treated with (B) Losartan 1 μM or (C) Y-27632 10 μM, 1 h before stimulation with Ang II 100 nM for 24 h. During the last 4 h of stimulus, cells were treated in the presence and absence of CQ 30 μM (D). (E) A7r5 cells were transfected with a control siRNA or siRNA against Beclin 1 100 nM for 6 h and incubated in DMEM with 2% of FBS for 16 h. Cells were then stimulated with Ang II 100 nM for 24 h. α-SMA levels were evaluated by Western blot and normalized by β-tubulin (n = 5). α-SMA levels were determined by Western blot and normalized by GAPDH (n = 5). Data were analyzed using Student’s t-test or one way ANOVA followed by Newman–Keuls post hoc test. The results are shown as mean ± SEM. p < 0.05, ∗∗p < 0.01, ∗∗∗p < 0.001 vs. control; #p < 0.05, ##p < 0.01, ###p < 0.001 vs. Ang II.

References

    1. Andrawis N. S., Ruley E. H., Abernethy D. R. (1993). Angiotensin II regulates human vascular smooth muscle alpha-actin gene expression. Biochem. Biophys. Res. Commun. 196 962–968. 10.1006/bbrc.1993.2343 - DOI - PubMed
    1. Chen P. H., Chen X., He X. (2013). Platelet-derived growth factors and their receptors: structural and functional perspectives. Biochim. Biophys. Acta 1834 2176–2186. 10.1016/j.bbapap.2012.10.015 - DOI - PMC - PubMed
    1. Dimopoulos G. J., Semba S., Kitazawa K., Eto M., Kitazawa T. (2007). Ca2+-dependent rapid Ca2+ sensitization of contraction in arterial smooth muscle. Circ. Res. 100 121–129. 10.1161/01.RES.0000253902.90489.df - DOI - PMC - PubMed
    1. Fonseca B. D., Smith E. M., Yelle N., Alain T., Bushell M., Pause A. (2014). The ever-evolving role of mTOR in translation. Semin. Cell Dev. Biol. 36 102–112. 10.1016/j.semcdb.2014.09.014 - DOI - PubMed
    1. Forouzanfar M. H., Liu P., Roth G. A., Ng M., Biryukov S., Marczak L., et al. (2017). Global Burden of hypertension and systolic blood pressure of at least 110 to 115 mm Hg, 1990-2015. JAMA 317 165–182. 10.1001/jama.2016.19043 - DOI - PubMed