Optimization of Lead Placement in the Right Ventricle During Cardiac Resynchronization Therapy. A Simulation Study
- PMID: 30804805
- PMCID: PMC6378298
- DOI: 10.3389/fphys.2019.00074
Optimization of Lead Placement in the Right Ventricle During Cardiac Resynchronization Therapy. A Simulation Study
Abstract
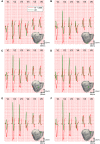
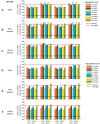
Patients suffering from heart failure and left bundle branch block show electrical ventricular dyssynchrony causing an abnormal blood pumping. Cardiac resynchronization therapy (CRT) is recommended for these patients. Patients with positive therapy response normally present QRS shortening and an increased left ventricle (LV) ejection fraction. However, around one third do not respond favorably. Therefore, optimal location of pacing leads, timing delays between leads and/or choosing related biomarkers is crucial to achieve the best possible degree of ventricular synchrony during CRT application. In this study, computational modeling is used to predict the optimal location and delay of pacing leads to improve CRT response. We use a 3D electrophysiological computational model of the heart and torso to get insight into the changes in the activation patterns obtained when the heart is paced from different regions and for different atrioventricular and interventricular delays. The model represents a heart with left bundle branch block and heart failure, and allows a detailed and accurate analysis of the electrical changes observed simultaneously in the myocardium and in the QRS complex computed in the precordial leads. Computational simulations were performed using a modified version of the O'Hara et al. action potential model, the most recent mathematical model developed for human ventricular electrophysiology. The optimal location for the pacing leads was determined by QRS maximal reduction. Additionally, the influence of Purkinje system on CRT response was assessed and correlation analysis between several parameters of the QRS was made. Simulation results showed that the right ventricle (RV) upper septum near the outflow tract is an alternative location to the RV apical lead. Furthermore, LV endocardial pacing provided better results as compared to epicardial stimulation. Finally, the time to reach the 90% of the QRS area was a good predictor of the instant at which 90% of the ventricular tissue was activated. Thus, the time to reach the 90% of the QRS area is suggested as an additional index to assess CRT effectiveness to improve biventricular synchrony.
Keywords: LBBB; QRS duration; cardiac resynchronization therapy; computational modeling; heart failure; optimization.
Figures


Similar articles
-
Leadless biventricular left bundle and endocardial lateral wall pacing versus left bundle only pacing in left bundle branch block patients.Front Physiol. 2022 Dec 14;13:1049214. doi: 10.3389/fphys.2022.1049214. eCollection 2022. Front Physiol. 2022. PMID: 36589454 Free PMC article.
-
Left ventricular electrical activation during right ventricular pacing in heart failure patients with LBBB: visualization by electrocardiographic imaging and implications for cardiac resynchronization therapy.J Electrocardiol. 2015 Jan-Feb;48(1):53-61. doi: 10.1016/j.jelectrocard.2014.09.002. Epub 2014 Sep 16. J Electrocardiol. 2015. PMID: 25301520 Clinical Trial.
-
Electrocardiographic follow-up of biventricular pacemakers.Ann Noninvasive Electrocardiol. 2005 Apr;10(2):231-55. doi: 10.1111/j.1542-474X.2005.10201.x. Ann Noninvasive Electrocardiol. 2005. PMID: 15842437 Free PMC article.
-
Assessment of mechanical dyssynchrony in cardiac resynchronization therapy.Dan Med J. 2014 Dec;61(12):B4981. Dan Med J. 2014. PMID: 25441737 Review.
-
Usefulness of the 12-lead electrocardiogram in the follow-up of patients with cardiac resynchronization devices. Part I.Cardiol J. 2011;18(5):476-86. doi: 10.5603/cj.2011.0002. Cardiol J. 2011. PMID: 21947982 Review.
Cited by
-
A computational study on the influence of antegrade accessory pathway location on the 12-lead electrocardiogram in Wolff-Parkinson-White syndrome.Europace. 2025 Feb 5;27(2):euae223. doi: 10.1093/europace/euae223. Europace. 2025. PMID: 39259657 Free PMC article.
-
Optimization of cardiac resynchronization therapy based on a cardiac electromechanics-perfusion computational model.Comput Biol Med. 2022 Feb;141:105050. doi: 10.1016/j.compbiomed.2021.105050. Epub 2021 Nov 19. Comput Biol Med. 2022. PMID: 34823858 Free PMC article.
-
Recent Advances in Cardiac Resynchronization Therapy: Current Treatment and Future Direction.J Clin Med. 2025 Jan 29;14(3):889. doi: 10.3390/jcm14030889. J Clin Med. 2025. PMID: 39941560 Free PMC article. Review.
-
The mechanisms of potassium loss in acute myocardial ischemia: New insights from computational simulations.Front Physiol. 2023 Feb 27;14:1074160. doi: 10.3389/fphys.2023.1074160. eCollection 2023. Front Physiol. 2023. PMID: 36923288 Free PMC article.
-
Progress of Conductivity and Conduction Velocity Measured in Human and Animal Hearts.Rev Cardiovasc Med. 2024 Oct 11;25(10):364. doi: 10.31083/j.rcm2510364. eCollection 2024 Oct. Rev Cardiovasc Med. 2024. PMID: 39484125 Free PMC article. Review.
References
-
- Abraham W. T., Gras D., Yu C. M., Guzzo L., Gupta M. S. (2010). Rationale and design of a randomized clinical trial to assess the safety and efficacy of frequent optimization of cardiac resynchronization therapy: the Frequent Optimization Study Using the QuickOpt Method (FREEDOM) trial. Am. Heart J. 159, 944–948.e1. 10.1016/j.ahj.2010.02.034 - DOI - PubMed
-
- Akar F. G., Nass R. D., Hahn S., Cingolani E., Shah M., Hesketh G. G., et al. . (2007). Dynamic changes in conduction velocity and gap junction properties during development of pacing-induced heart failure. Am. J. Physiol. Hear. Circ. Physiol. 293, H1223–H1230. 10.1152/ajpheart.00079.2007 - DOI - PubMed
LinkOut - more resources
Full Text Sources
Research Materials

