. 2019 Feb 5:10:50.
doi: 10.3389/fneur.2019.00050. eCollection 2019.

Transcranial Direct Current Stimulation for Patients With Pharmacoresistant Epileptic Spasms: A Pilot Study

Affiliations

Transcranial Direct Current Stimulation for Patients With Pharmacoresistant Epileptic Spasms: A Pilot Study

Dongju Yang et al. Front Neurol. .

Abstract

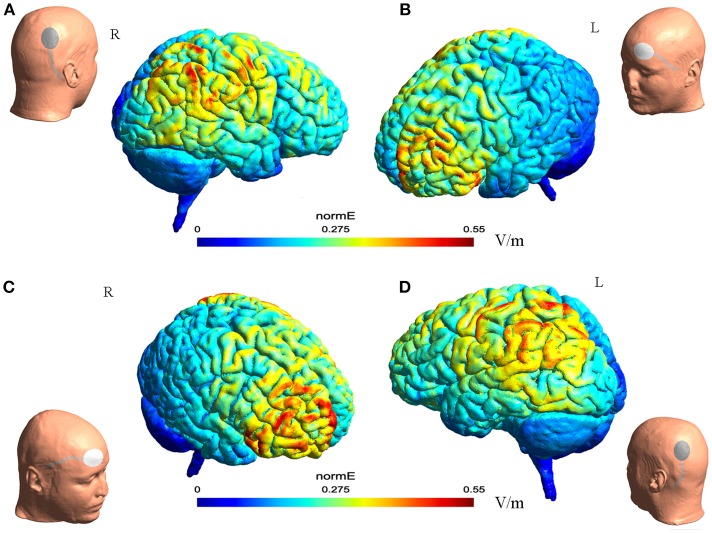
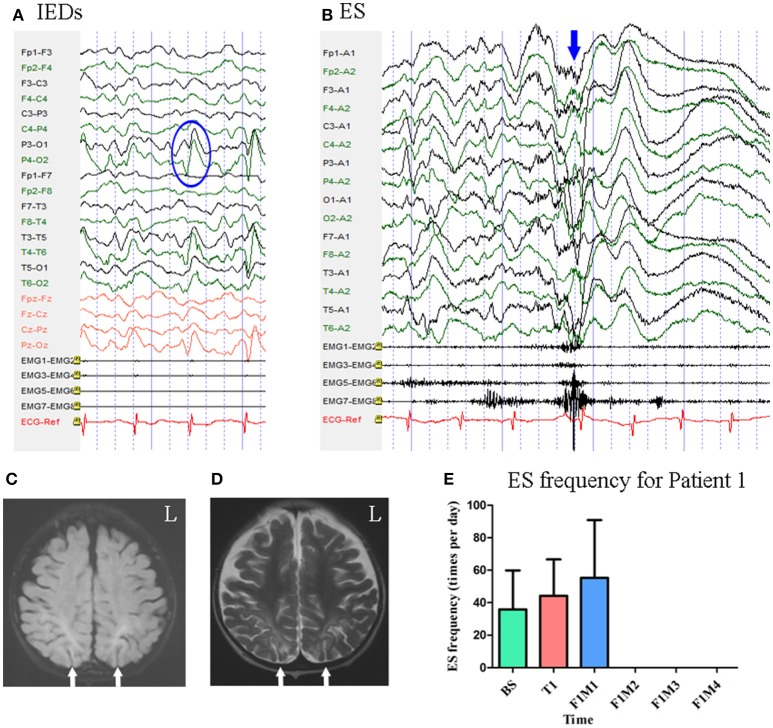
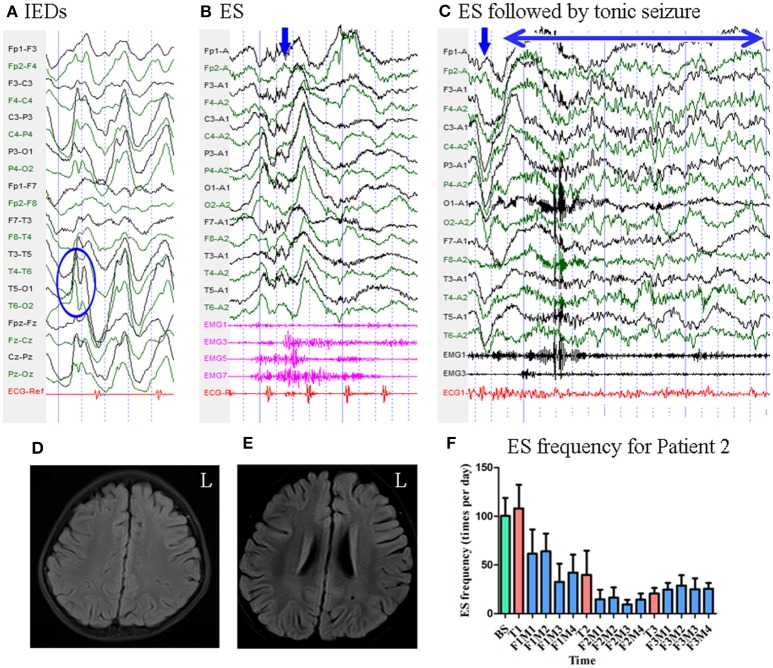
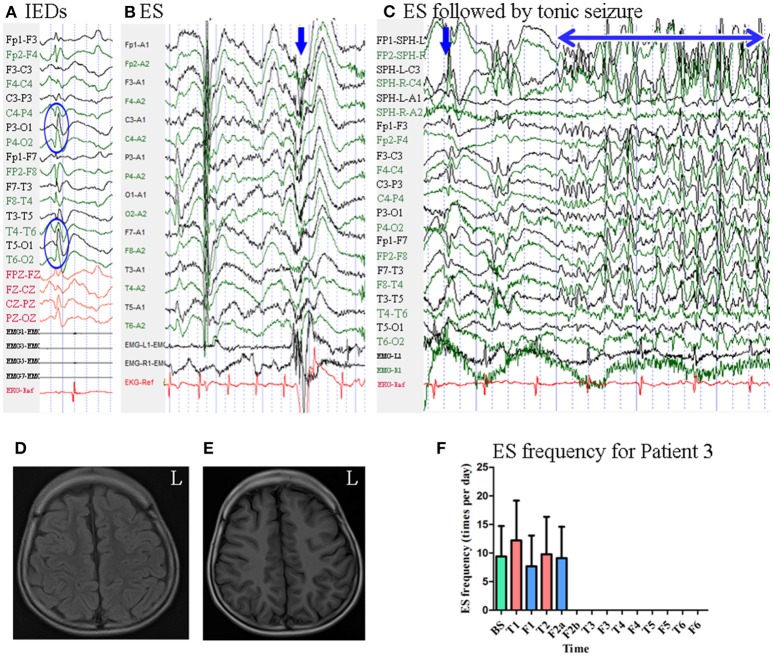
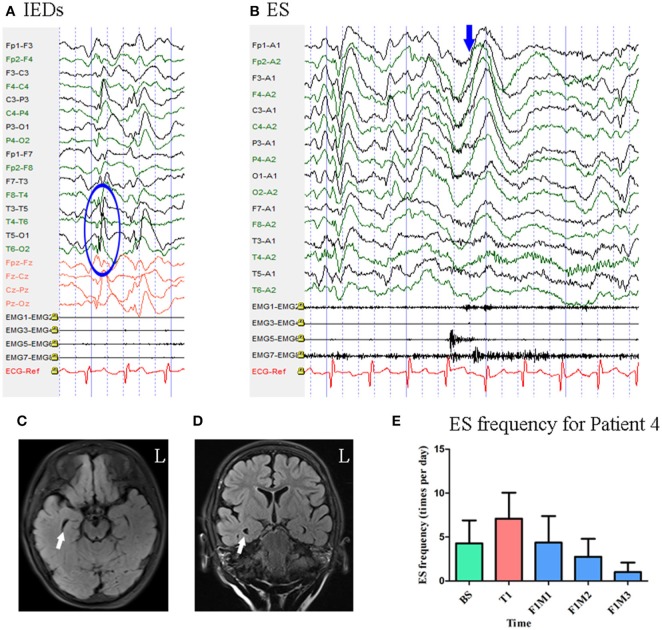
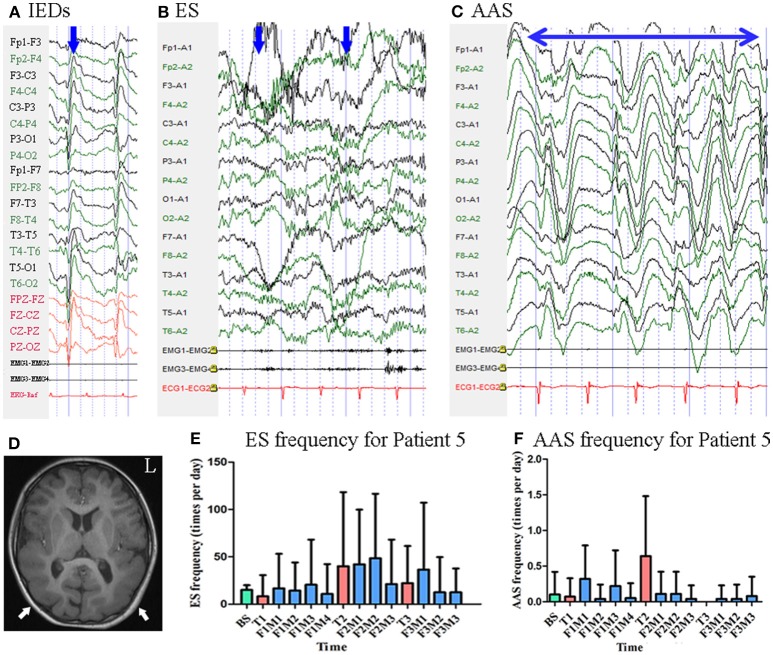
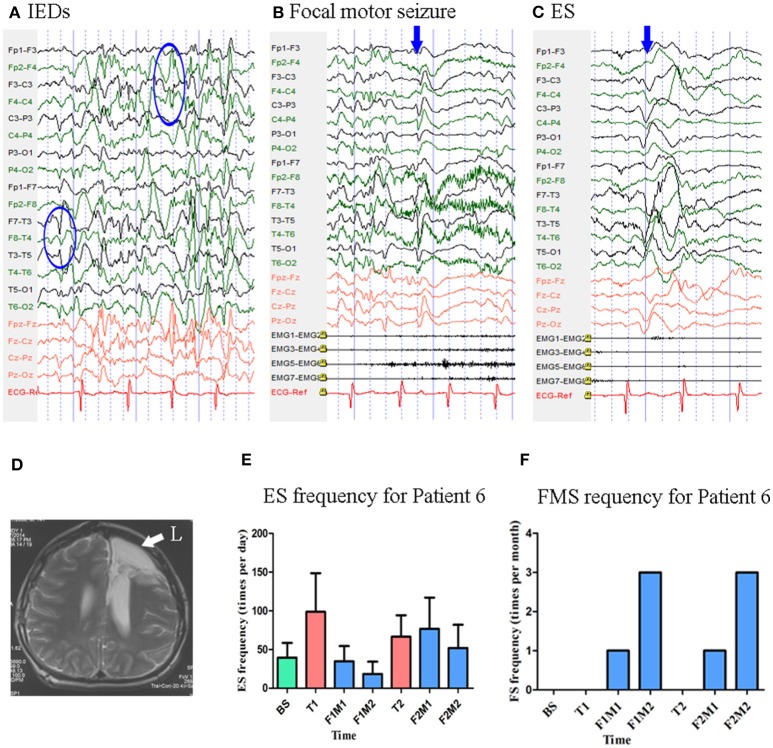
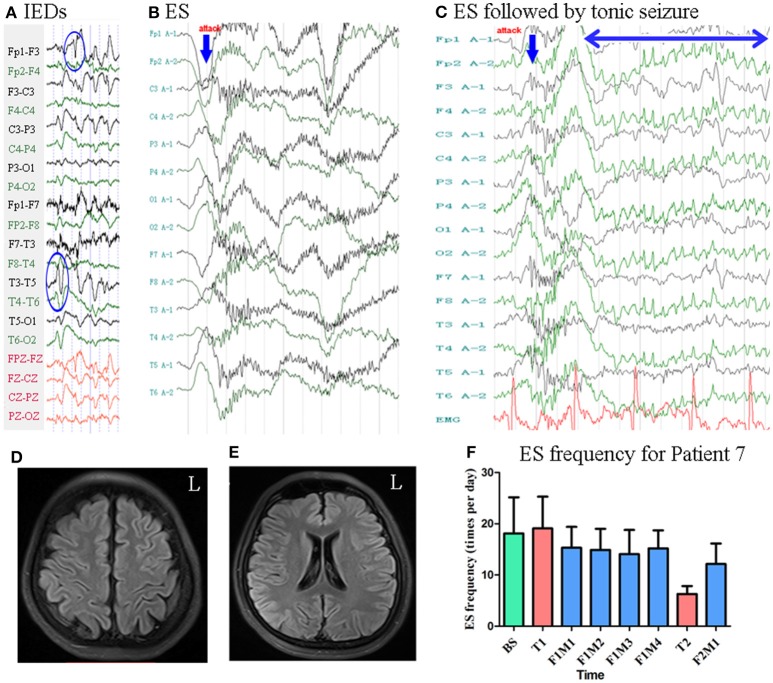
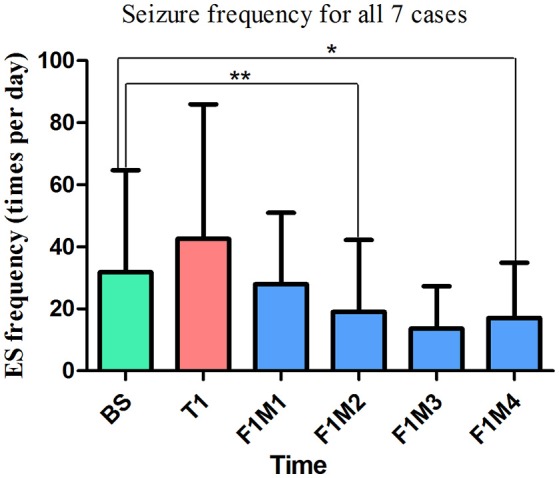
Background: Epileptic spasms (ES) is a severe seizure type and lack of adequate methods for controlling of clinical attacks. Previous studies have indicated that cathodal transcranial direct current stimulation (tDCS) reduces seizure frequency for patients with epilepsy. ES are proposed to have a focal cortical origin. We hypothesized that patients with ES exhibit hyperactive network hubs in the parietal lobe, and that cathodal tDCS targeting the bilateral parietal region can reduce seizure frequency in patients with pharmacoresistant ES. Materials and Methods: The present study consisted of three basic phases: (a) a pre-treatment monitoring period for 14 days; (b) a consecutive 14-day treatment period during which patients were treated with 1 or 2 mA cathode tDCS for 40 min once per day; (c) and a follow-up period for at least 28 days. During the first 20 min of treatment, the cathode was placed over the right parietal lobe (P4) with the reference electrode over the contralateral supra-orbital area. In the second 20 min, the cathode was placed over the left parietal lobe (P3), with the reference electrode over the contralateral supra-orbital area. All patients received active tDCS treatment, and some patients underwent more than one treatment block. Patients maintained a seizure diary throughout the study. Antiepileptic drug therapy remained unchanged throughout the study. K-related samples Friedman tests and two-related samples tests were used to analyze data from all patients. Results: Seven patients with pharmacoresistant ES were included, receiving a total of eighteen 14-day blocks of tDCS treatment. We observed a significant difference in seizure frequency at the second month (p = 0.028, unadjusted), as well as a trend toward decreased seizure frequency at the fourth month (p = 0.068, unadjusted) of the first follow-up, relative to baseline. Three of seven patients (42.9%) exhibited sustained seizure reduction, while one (14.3%) experienced a short-term reduction in seizure frequency following cathodal tDCS treatment. Treatment was well tolerated in all patients. Conclusions: Repeated tDCS with the cathode placed over the bilateral parietal region is safe and may be effective for reducing seizure frequency in a subgroup of patients with pharmacoresistant ES.

Keywords: EEG; epilepsy; epileptic spasms; infantile spasms; seizures; tDCS.


Figures

Figure 1
Figure 1
The illustration of electrode montage and estimated electric field for tDCS. The gray line indicated the cable feeding the tDCS electrodes. Together, (A,B) illustrate the montage for cathode-P4 and anode-left supra-orbital. (A) (Left) the illustration of cathode on P4 on a model head. (Right) the estimated electric field in the brain from the lateral view. (B) (Left) the estimated electric field in the brain from the lateral view. (Right) the illustration of anode on left supra-orbital area on a model head. (C,D) Illustrated together the montage of cathode-P3 and anode- right supra-orbital.
Figure 2
Figure 2
The EEG, MRI, and seizure frequency for Patient 1. (A) Interictal EEG for Patient 1 showed IEDs on bilateral parietal-occipital regions (blue circle). (B) Ictal ES EEG for Patient 1 showed generalized high-voltage slow waves (blue arrow) followed by a diffuse electro-decrement with superimposed fast activity. (C,D) MRI scan showed bilateral parietal-occipital region encephalomalacia (white arrow). (C) Flair MRI; (D) T2 MRI. (E) Seizure frequency of ES for Patient 1. The patient was seizure free for three months. BS, baseline; ES, epileptic spasm; F1M1-F1M4, the first to the fourth month of the follow-up; IEDs, interictal discharges; L, left; T1, treatment 1.
Figure 3
Figure 3
The EEG, MRI and seizure frequency for Patient 2. (A) Interictal EEG for Patient 2 showed sharp and slow wave complexes mainly on bilateral parietal-occipital-posterior temporal regions (blue circle). (B) Ictal ES EEG for Patient 2 showed typical ictal EEG pattern of ES (blue arrow marks the high amplitude slow wave). (C) Ictal ES -TS EEG for Patient 2 showed a constant spike rhythm following typical ES pattern (blue arrow indicated the slow wave; double sided blue arrow indicated the time course of the spike rhythm). (D,E) MRI (flair) scan showed no evidence of lesion. (F) Seizure frequency of ES for Patient 2. The patient had more than 50% seizure reduction for 12 months. BS, baseline; ES, epileptic spasm; ES-TS, ES followed by a tonic seizure; F1M1-F1M4, the first to the fourth month of the first follow-up; F2M1-F2M4, the first to the fourth month of the second follow-up; F3M1-F3M4, the first to the fourth month of the third follow-up; IEDs, interictal discharges; L, left; T1, treatment 1; T2, treatment 2; T3, treatment 3.
Figure 4
Figure 4
The EEG, MRI, and seizure frequency for Patient 3. (A) Interictal EEG for Patient 3 showed sharp waves mainly on bilateral parietal-occipital-posterior temporal regions (blue circle). (B) Ictal ES EEG for Patient 3 showed typical ictal EEG pattern of ES (blue arrow marks the high amplitude slow wave). (C) Ictal ES-TS EEG for Patient 3 showed a constant spike rhythm following typical ES pattern (blue arrow indicated slow wave; double sided blue arrow indicated the time course of spike rhythm). (D,E) MRI scan showed no evidence of lesion; (D), flair MRI; (E), T1 MRI. (F). Seizure frequency of ES for Patient 3. The patient was seizure free since the 20th day of second follow-up for 6 months. BS, baseline; ES, epileptic spasm; ES-TS, ES followed by a tonic seizure; F1, the first follow-up; F2a, the first 19 days of the second follow-up; F2b, the remain 9 days of the second follow-up; F3, the third follow-up; F4, the fourth follow-up; F5, the fifth follow-up; F6, the sixth follow-up; IEDs, interictal discharges; L, left; T1, treatment 1; T2, treatment 2; T3, treatment 3; T4, treatment 4; T5, treatment 5; T6, treatment 6.
Figure 5
Figure 5
The EEG, MRI and seizure frequency for Patient 4. (A) Interictal EEG for Patient 4 showed IEDs on posterior temporal- parietal regions with higher amplitude on left side (blue circle). (B) Ictal ES EEG for Patient 4 showed typical ictal EEG pattern of ES (blue arrow marks the high amplitude slow wave). (C,D) MRI (flair) scan showed enlargement of the right temporal horn of lateral ventricle (white arrow). (E). Seizure frequency of ES for Patient 4. The seizure frequency reduction reached 76.64% at the third month of follow-up. BS, baseline; ES, epileptic spasm; F1M1-F1M3, the first to the third month of the first follow-up; IEDs, interictal discharges; L, left; T1, treatment 1.
Figure 6
Figure 6
The EEG, MRI and seizure frequency for Patient 5. (A) Interictal EEG for Patient 5 showed IEDs on bilateral central-parietal-posterior temporal regions (blue arrow). (B) Ictal ES EEG for Patient 5 showed typical ictal EEG pattern of ES (blue arrow indicated two ictal ES episodes). (C) Ictal atypical absence seizure EEG for Patient 5 showed synchronous high amplitude 1.5 Hz sharp and wave complexes (the double sided blue arrow indicated the time course of sharp and wave complex rhythm). (D) MRI (T1) scan showed pachygyria in the cortex (white arrow). (E) Seizure frequency of ES for Patient 5. (F) Seizure frequency of AAS for Patient 5. AAS, atypical absence seizure; BS, baseline; ES, epileptic spasm; F1M1-F1M4, the first to the fourth month of the first follow-up; F2M1-F2M3, the first to the third month of the second follow-up; F3M1-F3M3, the first to the third month of the third follow-up; IEDs, interictal discharges; L, left; T1, treatment 1; T2, treatment 2; T3, treatment 3.
Figure 7
Figure 7
The EEG, MRI and seizure frequency for Patient 6. (A) Interictal EEG for Patient 6 showed IEDs on right frontal and left temporal electrodes (blue circles). (B) Ictal focal motor seizure EEG for Patient 6 showed low amplitude of fast rhythm on the right frontal-temporal electrodes, the blue arrow indicated the onset of symptoms. (C) Ictal ES EEG for Patient 6 showed typical ictal EEG pattern of ES (blue arrow indicated the high amplitude slow wave). (D) MRI (T2) showed post-operative change in left frontal lobe (white arrow). (E) Seizure frequency of ES for Patient 6. (F) Seizure frequency of FS for Patient 6. BS, baseline; ES, epileptic spasm; F1M1-F1M2, the first to the second month of the first follow-up; F2M1-F2M2, the first to the second month of the second follow-up; FMS, focal motor seizure; IEDs, interictal discharges; L, left; T1, treatment 1; T2, treatment 2.
Figure 8
Figure 8
The EEG, MRI and seizure frequency for Patient 7. (A) Interictal EEG for Patient 7 showed IEDs on bilateral frontal-temporal regions (blue circles). (B) Ictal ES EEG for Patient 7 showed typical ictal EEG pattern of ES (blue arrow indicated the high amplitude slow wave). (C) Ictal ES-TS EEG for Patient 7 showed a constant spike rhythm following typical ES pattern (blue arrow indicated high amplitude slow wave; double sided blue arrow indicated the time course of spike rhythm). (D,E) MRI (flair) showed no lesion. (F) Seizure frequency of ES for Patient 7. BS, baseline; ES, epileptic spasm; ES-TS, ES followed by a tonic seizure; F1M1-F1M4, the first to the fourth month of the first follow-up; F2M1, the first month of the second follow-up; IEDs, interictal discharges; L, left; T1, treatment 1; T2, treatment 2.
Figure 9
Figure 9
The mean seizure frequency of ES for all patients. In the exploratory analysis, we observed a significant reduction in seizure frequency at the second month of the first follow-up period (F1M2, p = 0.028, unadjusted, n = 6), as well as a trend toward decreased seizure frequency at the fourth month (F1M4, p = 0.068, unadjusted, n = 4) of the first follow-up period. Relative to baseline, mean reductions in seizure frequency at T1, F1M1, F1M2, F1M3, and F1M4 were −33.71, 12.14, 40.13, 57.14, and 46.51%, respectively. **Significant difference in seizure frequency, (p = 0.028, unadjusted). *Marginally significant difference in seizure frequency (p = 0.068, unadjusted). BS, baseline; ES, epileptic spasm; F1M1-F1M4, the first to the fourth month of the first follow-up; T1, treatment 1.

Similar articles

Cited by

References

    1. Blume WT, Luders HO, Mizrahi E, Tassinari C, van Emde BW, Engel JJ. Glossary of descriptive terminology for ictal semiology: report of the ILAE task force on classification and terminology. Epilepsia (2001) 42:1212–8. 10.1046/j.1528-1157.2001.22001.x - DOI - PubMed
    1. Wilmshurst JM, Gaillard WD, Vinayan KP, Tsuchida TN, Plouin P, Van Bogaert P, et al. . Summary of recommendations for the management of infantile seizures: task force report for the ILAE commission of pediatrics. Epilepsia (2015) 56:1185–97. 10.1111/epi.13057 - DOI - PubMed
    1. Pellock JM, Hrachovy R, Shinnar S, Baram TZ, Bettis D, Dlugos DJ, et al. . Infantile spasms: a U.S. consensus report. Epilepsia (2010) 51:2175–89. 10.1111/j.1528-1167.2010.02657.x - DOI - PubMed
    1. Ronzano N, Valvo G, Ferrari AR, Guerrini R, Sicca F. Late-onset epileptic spasms: clinical evidence and outcome in 34 patients. J. Child Neurol. (2015) 30:153–9. 10.1177/0883073814532547 - DOI - PubMed
    1. Go CY, Mackay MT, Weiss SK, Stephens D, Adams-Webber T, Ashwal S, et al. . Evidence-based guideline update: medical treatment of infantile spasms. report of the guideline development subcommittee of the american academy of neurology and the practice committee of the child neurology society. Neurology (2012) 78:1974–80. 10.1212/WNL.0b013e318259e2cf - DOI - PMC - PubMed

LinkOut - more resources