. 2019 Feb 5:10:54.
doi: 10.3389/fimmu.2019.00054. eCollection 2019.

The PD-1/PD-L1 Pathway Affects the Expansion and Function of Cytotoxic CD8+ T Cells During an Acute Retroviral Infection

Affiliations

The PD-1/PD-L1 Pathway Affects the Expansion and Function of Cytotoxic CD8+ T Cells During an Acute Retroviral Infection

Paul David et al. Front Immunol. .

Abstract

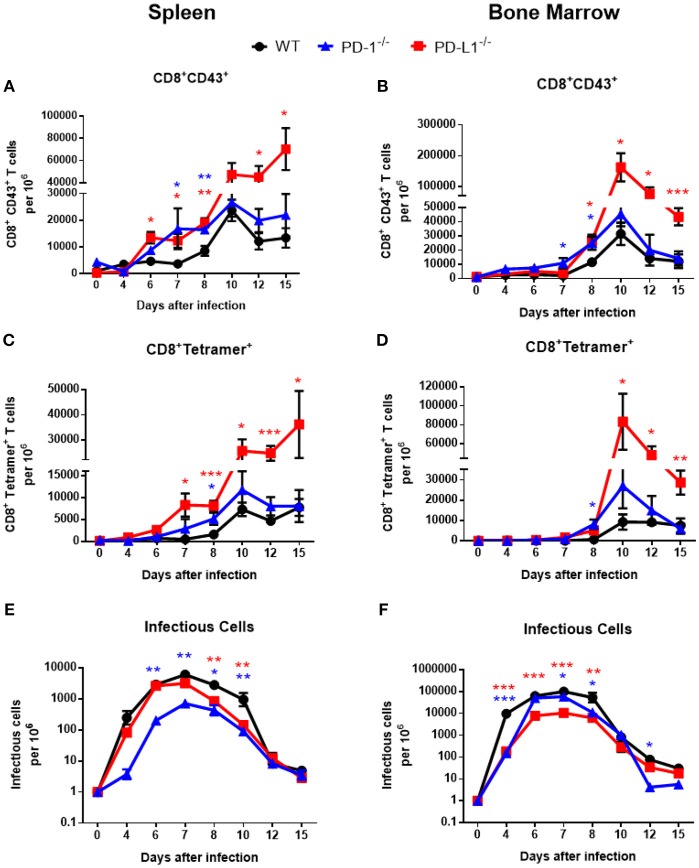
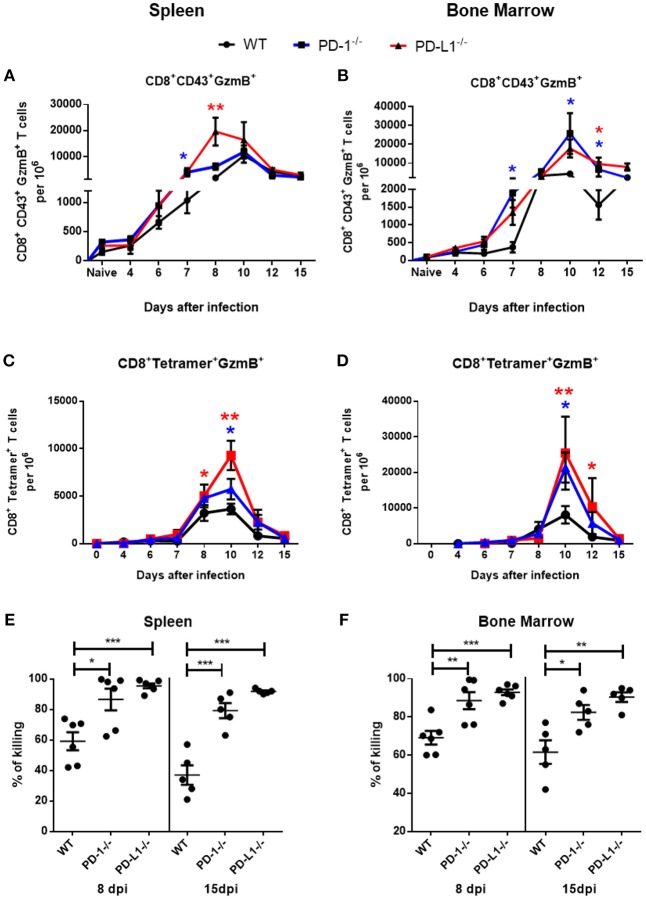
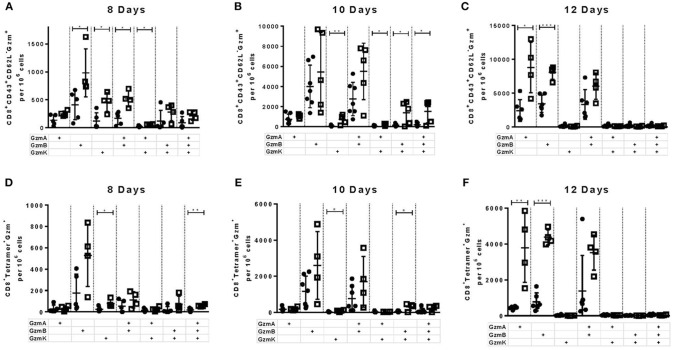
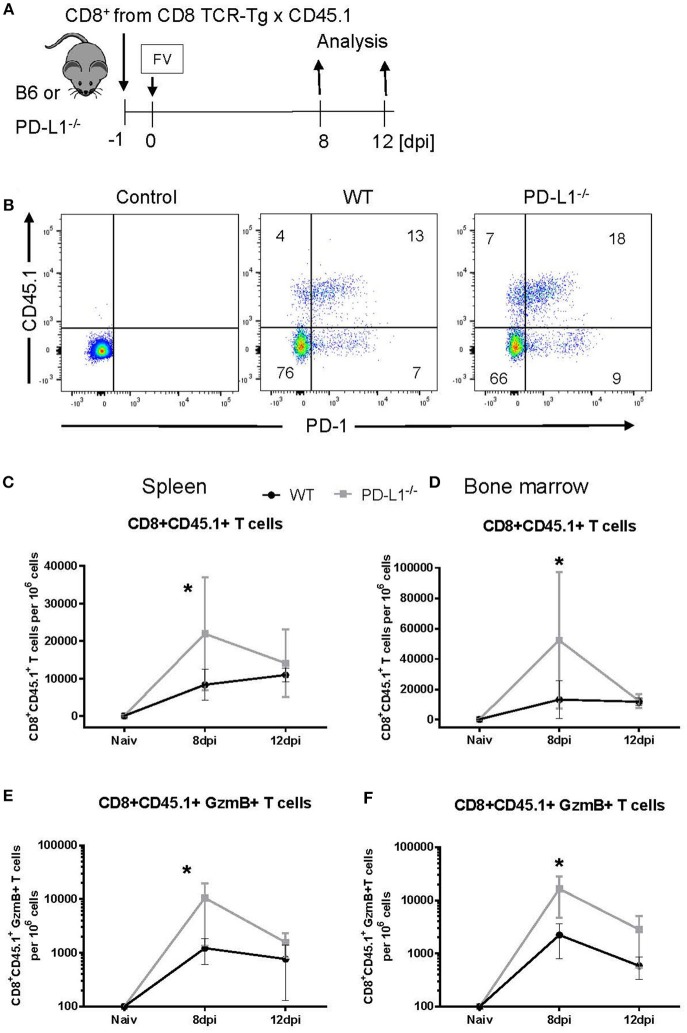
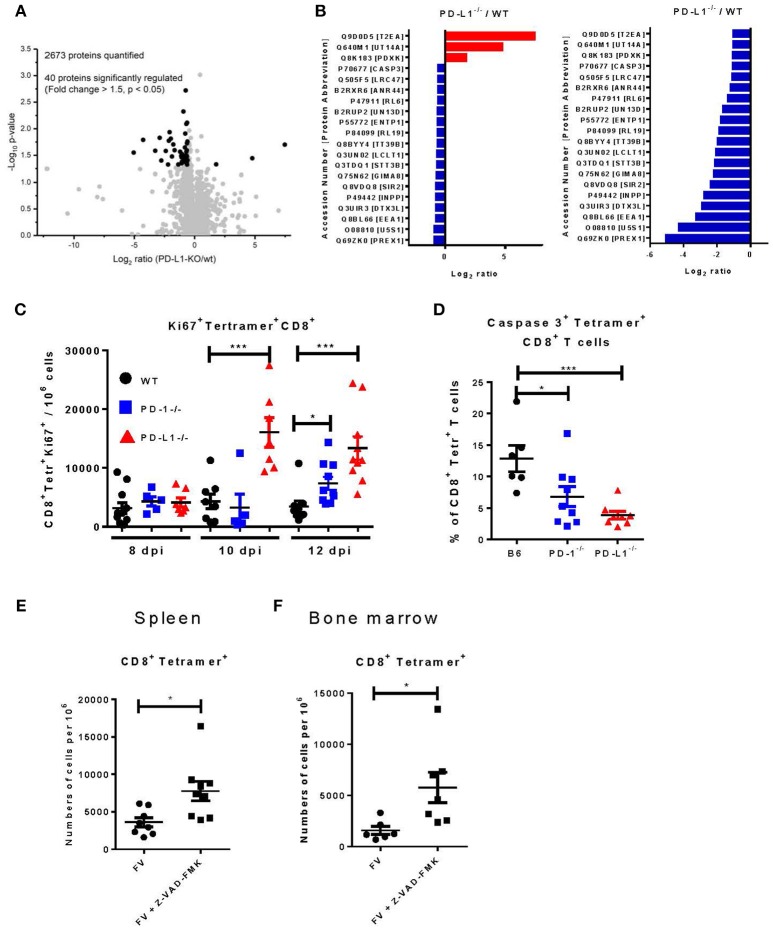
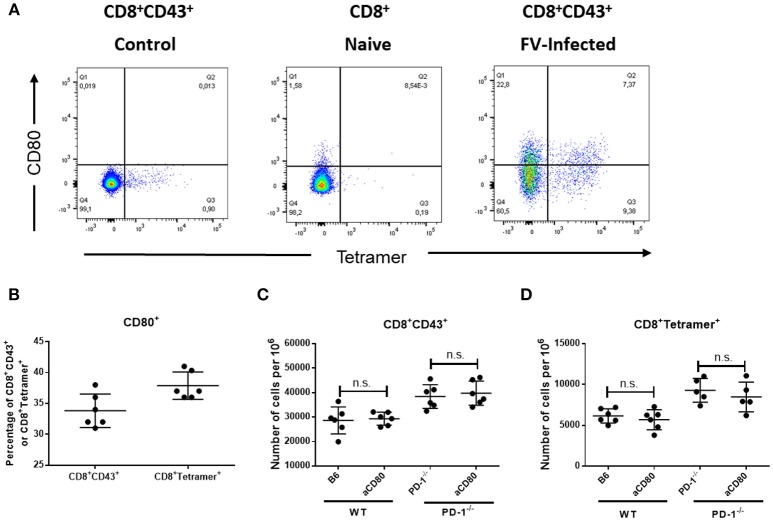
Cytotoxic CD8+ T lymphocytes (CTL) efficiently control acute virus infections but can become exhausted when a chronic infection develops. The checkpoint receptor PD-1 suppresses the functionality of virus-specific CD8+ T cells during chronic infection. However, the role of the PD-L1/PD-1 pathway during the acute phase of infections has not been well characterized. In the current study the effects of PD-1 or PD-L1 deficiency on the CD8+ T cell response against Friend retroviral (FV) infection of knockout mice was analyzed during acute infection. We observed an enhanced proliferation, functional maturation, and reduced apoptosis of effector CD8+ T cells in the absence of PD-1 or PD-L1. The knockout of PD-L1 had a stronger effect on the functionality of CD8+ T cells than that of PD-1. Augmented CTL responses were associated with an improved control of FV replication. The strong phenotype of FV-infected PD-L1 knockout mice was independent of the interaction with CD80 as an additional receptor for PD-L1. Furthermore, we performed a detailed analysis of the production of different granzymes in virus-specific CD8+ T cells and observed that especially the simultaneous production of multiple granzymes in individual T cells (multifunctionality) was under the control of the PD-1/PD-L1 pathway. The findings from this study allow for a better understanding of the development of antiviral cytotoxic immunity during acute viral infections.

Keywords: CD8 T cells; PD-1; PD-L1; apoptosis; caspase 3; immunoregulation; retrovirus.


Figures

Figure 1
Figure 1
Expansion of effector CD8+ T cells and FV loads during acute infection of mice without PD-1 signaling. C57BL/6, PD-1−/− and PD-L1−/− mice were infected with FV and splenocytes and bone marrow were isolated at different time points after infection. Flow cytometry was used to detect the numbers of effector CD8+ T cells in spleen (A) and in bone marrow (B) expressing the activation associated glycoform of the CD43 molecules. The numbers of effector CD8+ specific for the FV gagL epitope were determined in spleens (C) and bone marrow (D). Viral loads were determined in spleen (E) and in bone marrow (F). Mean numbers plus SD of 5–9 mice are shown. Data was pooled from three independent experiments with similar results. One-way ANOVA with a Tukey post-test was used for the comparison of both KO mice strains with WT animals at every analyzed time point. Statistically significant differences between the groups (blue for comparison with PD-1−/− and red for comparison with PD-L1−/−) are indicated (*p < 0.05, **p < 0.005, ***p < 0.0005).
Figure 2
Figure 2
Cytotoxic CD8+ T cell responses in mice without PD-1 signaling. C57BL/6, PD-1−/− and PD-L1−/− mice were infected with FV and splenocytes and bone marrow were isolated at different time points after infection. Flow cytometry was used to detect intracellular granzyme B in effector CD8+ T cells (CD43+) and in CD8+ T cells specific for the FV gagL epitope (Tetramer+). A kinetic analysis was performed at different time points after FV infection. Shown are the numbers of effector CD8+ T cells expressing B (GzmB) from spleen (A) and bone marrow (B) and the numbers of virus-specific CD8+ tetramer+ CD8+ T cells expressing granzyme B in spleen (C) and bone marrow (D). Each dot represents the mean number plus SEM per one million nucleated cells for a group of 5–9 mice. Data were pooled from three independent experiments with similar results. One-way ANOVA with a Tukey post-test was used for the comparison of both KO mice strains with WT animals at every analyzed time point. Statistically significant differences between the groups (blue for comparison with PD-1−/− and red for comparison with PD-L1−/−) are indicated (*p < 0.05, **p < 0.005). CFSE labeled spleen cells from naïve CD45.1 mice were loaded with FV peptide and were injected intravenously into naïve and 8 or 15 days infected mice. As controls similar number of CD45.1 spleen cells from naïve mice without peptide were co-injected into the same recipient mice. The spleen and bone marrow cells from recipient mice were isolated 2 h after injection and analyzed for numbers of CD45.1+ and CFSE fluorescence. The figure shows the percentage of eliminated FV peptide-loaded donor cells in spleen (E) and bone marrow (F). Each dot represents an individual mouse and the mean numbers and SD are indicated. Differences were analyzed by one-way ANOVA with a Tukey post-test. Statistically significant differences between the groups are indicated (*p < 0.05, **p < 0.005, ***p < 0.0005).
Figure 3
Figure 3
Production of different granzymes in CD8+ T cells from PD-L1−/− mice. C57BL/6 (white columns) and PD-L1−/− (black columns) mice were infected with FV and splenocytes were isolated at 8, 10, and 12 days after infection. Flow cytometry was used to detect intracellular expression of GzmA, GzmB, and GzmK in effector CD8+ T cells (CD43+) and in CD8+ T cells specific for the FV gagL epitope (Tetramer+) from the spleen. The analysis was performed at day 8, 10, and 12 after FV infection. Shown are the numbers of all effector CD43+ CD8+ T cells (A–C) and virus-specific Tetramer+CD8+ (D–F) expressing single, double, or all three granzymes together. Each dot represents an individual mouse and the mean numbers and SD are indicated. Data were pooled from two independent experiments with similar results. Differences were analyzed by unpaired t-test (*p < 0.05, **p < 0.005, ***p < 0.0005).
Figure 4
Figure 4
Expansion of transferred CD8+ T cells in PD-L1−/− mice. CD8+ T cells were isolated from CD45.1 × TCR Tg mice and adoptively transferred into WT and PD-L1−/− mice. Recipient animals were infected with FV on the next day after CD8+ T cell transfer (A). Flow cytometry was used to detect the transferred donor CD8+ T cells (CD8+ CD45.1+). A representative dot plot shows the IgG isotype control for CD45.1 and PD-1 stining on CD8+ T cells, CD8+ T cells from the spleen of WT and PD-L1−/− recipient mice on day 8 after FV infection (B). The frequency of CD45.1+ CD8+ donor cells in the spleen (C) and bone marrow (D), and frequency of CD45.1+ CD8+ donor cells expressing granzyme B in the spleen (E) and bone marrow (F) of 8- and 12-day infected recipient mice were determined. Mean numbers plus SD of 4–7 mice are shown. Data was pooled from two independent experiments with similar results. Unpaired t-test was used for the analysis of differences at every time point. Statistically significant differences between the groups are indicated (*p < 0.05).
Figure 5
Figure 5
Proteome analysis, proliferation, and apoptosis of virus-specific CD8+ T cells in PD-L1−/− mice. CD8+ T cells were isolated from CD45.1 × TCR Tg mice and adoptively transferred into WT or PD-L1−/− mice. One day later recipient animals were infected with FV. CD8+ CD45.1+ T cells were sorted from spleens of WT and PD-L1−/− mice and lysated for proteome analysis at day 12 after FV infection. (A) Volcano plot showing the comparison of protein expression in CD8+ CD45.1+ T cells isolated from WT and PD-L1−/− mice. Significantly regulated proteins are highlighted as black dots. (B) The list is showing significantly regulated proteins and the ratio of protein expression in PD-L1−/− to WT for every protein. (C) C57BL/6, PD-1−/−, and PD-L1−/− mice were infected with FV and splenocytes were isolated at different time points after infection. Flow cytometry was used to detect the numbers of virus-specific Tetramer+ CD8+ T cells expressing the intracellular proliferation marker Ki67. (D) C57BL/6, PD-1−/− and PD-L1−/− mice were infected with FV and splenocytes were isolated at day 8 after infection. Flow cytometry was used to detect the expression of activated caspase 3 in the cytoplasm of the virus-specific Tetramer+ CD8+ T cells. C57BL/6 mice were infected with FV and at day 6 and 7 after infection they were treated with pan-caspase inhibitor Z-WAD-FMK. Flow cytometry was used to detect numbers of virus-specific Tetramer+ CD8+ T cells in spleen (E) and bone marrow (F) of 8 days infected mice. Each dot represents an individual mouse and the mean numbers and SD are indicated. Differences were analyzed by Benjamini-Hochberg corrected one-way ANOVA (A,B), one-way ANOVA with a Tukey post-test (C,D), or an unpaired t-test (E,F). Statistically significant differences between the groups are indicated (*p < 0.05, ***p < 0.0005).
Figure 6
Figure 6
Expression of CD80 on virus-specific CD8+ T cells and treatment with anti-CD80 antibody. C57BL/6 mice were infected with FV and splenocytes were isolated at day 10 after infection. Flow cytometry was used for phenotypic characterization of effector CD8+ T cells and virus-specific Tetramer+ CD8+ T cells. (A). A representative dot plot of CD8+ T cells from naïve mice (left) or effector CD8+ CD43+ T cells from infected mice (right) show the staining with Tetramers and CD80. (B). Percentage of effector CD8+ T cells and virus-specific CD8+ T cells expressing CD80. (C,D). C57BL/6 and PD-1−/− mice mice were infected with FV and treated with anti-CD80 antibody. Flow cytometry was used to detect the frequency of effector CD8+ T cells and CD8+ T cells specific for the FV gagL epitope (Tetramer+) in anti-CD80 treated and non-treated animals. Each dot represents an individual mouse and the mean numbers and SD are indicated. Two independent experiments with similar results were performed. Differences were analyzed by unpaired t-test.

Similar articles

Cited by

References

    1. Sharpe AH, Wherry EJ, Ahmed R, Freeman GJ. The function of programmed cell death 1 and its ligands in regulating autoimmunity and infection. Nat Immunol. (2007) 8:239–45. 10.1038/ni1443 - DOI - PubMed
    1. Barber DL, Wherry EJ, Masopust D, Zhu B, Allison JP, Sharpe AH, et al. . Restoring function in exhausted CD8 T cells during chronic viral infection. Nature (2006) 439:682–7. 10.1038/nature04444 - DOI - PubMed
    1. Ahn E, Araki K, Hashimoto M, Li W, Riley JL, Cheung J, et al. . Role of PD-1 during effector CD8 T cell differentiation. Proc Natl Acad Sci USA. (2018) 115:4749–54. 10.1073/pnas.1718217115 - DOI - PMC - PubMed
    1. Zelinskyy G, Myers L, Dietze KK, Gibbert K, Roggendorf M, Liu J, et al. . Virus-specific CD8+ T cells upregulate programmed death-1 expression during acute friend retrovirus infection but are highly cytotoxic and control virus replication. J Immunol. (2011) 187:3730–7. 10.4049/jimmunol.1101612 - DOI - PMC - PubMed
    1. Greenough A, Shaheen SO, Shennan A, Seed PT, Poston L. Respiratory outcomes in early childhood following antenatal vitamin C and E supplementation. Thorax (2010) 65:998–1003. 10.1136/thx.2010.139915 - DOI - PubMed

Publication types